In 2026, running a separate analytical platform just for a heatmap is like buying a dedicated computer for every single program. The tools might work, but the financial investment simply doesn’t pay off.
Any trader who is serious about Order Flow knows this frustrating routine: one subscription for a heatmap, a separate software for footprint charts, another window for the order book, and an extra tab for market replay. In the end, your desktop is cluttered and your workflow is weighed down by workarounds.
This heatmap trading software comparison is for scalpers and day traders who want to build a streamlined, unified analytical stack. We aren’t evaluating heatmaps in a vacuum. We are looking at how each platform performs within a complete, real-world trading setup.
Start now!
Try ATAS free with no time limit
We evaluated the software based on five strict criteria:
- Rendering performance under heavy, live market loads.
- Native integration between the heatmap and footprint charts (no manual syncing).
- Order book (DOM) depth and capabilities.
- Multi-market asset coverage and ease of connections.
- Overall cost and licensing transparency.
In this comparison, ATAS is not just another alternative for tracking resting liquidity. It is a unified ecosystem where the heatmap serves as your market entry point, while the core volume analysis and trade confirmations are driven by advanced footprint charts and filters.
| Parameter | ATAS | Bookmap | Quantower | TradingLite |
|---|---|---|---|---|
| Rendering technology | GPU / .NET 600+ FPS | CPU / Java fallback to 125 FPS | CPU depends on data | Browser limited by WebGL |
| 3D Heatmap | ✓ | ✗ | ✗ | ✗ |
| Footprint Chart | ✓ 400+ variations | paid addon | ✓ native | ✓ basic |
| Synchronization Heatmap + Footprint | ✓ native Price Scale Sync | ✗ impossible without 3rd-party software | requires binding setup | crypto only |
| Smart DOM | ✓ native | Basic DOM | ✓ DOM Surface | ✗ |
| Indicators | 240+ out of the box | Basic+ addons | Multi-asset suite | Basic set |
| Crypto – free | ✓Free | ✗ from $19/mo | Depends on broker | ✓Free |
| Market Coverage | Crypto · Futures · Stocks | Crypto · Futures · Stocks | Crypto · Futures · Stocks · Options · Forex | Crypto only |
| Market Replay | ✓ | ✓ | ✓ | ✗ |
| Price (basic) | €24.95/mo Start — free | $99/mo from $19 Digital | $70/mo from $0 via broker | Paid as needs grow |
| Installation | Desktop Windows / Mac | Desktop Windows / Mac | Desktop Windows | Browser · all OS |
| Iceberg Detection | In Roadmap | ✓ via MBO | Partially | ✗ |
Quick Comparison: All Software at a Glance
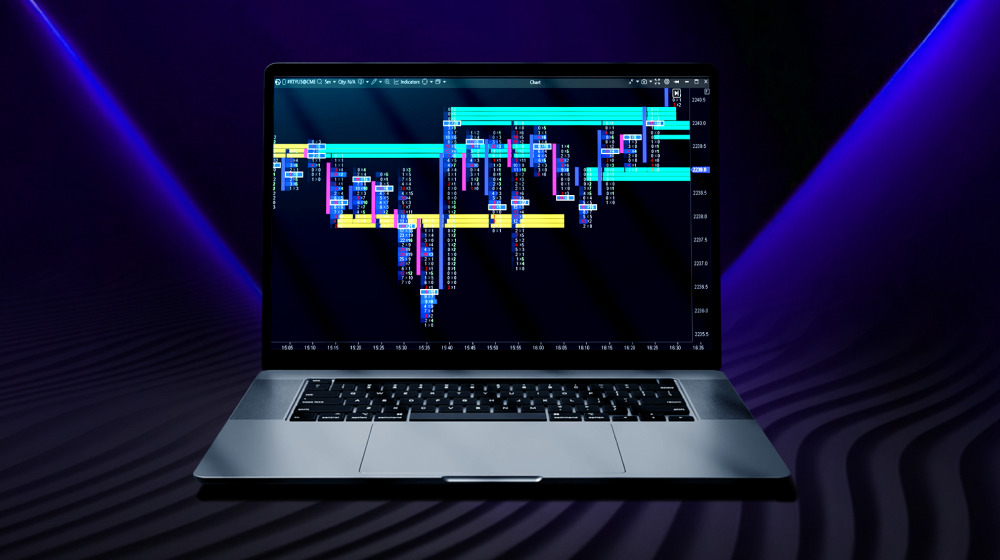
A heatmap is only useful if it keeps up with the market. During a 3% BTC swing in two minutes, or in the first seconds after an NFP release, liquidity levels shift faster than most analytical platforms can render them.
This is where rendering architecture either keeps up with the market—or doesn’t.
Important nuance
Latency does not occur at the data reception stage — both platforms operate with nanosecond precision. The bottleneck lies between receiving the data and rendering it on the screen. This is exactly where the CPU architecture chokes during moments of market chaos, while GPU rendering keeps pace without dropping frames.
ATAS Heatmap runs on GPU rendering. The graphics processor handles visual output independently, while the CPU stays focused on data processing.
The result: smooth 600+ FPS rendering1 that holds under volatility, with color gradients that update continuously rather than in visible jumps.
Rendering speed is the first filter in any order flow software comparison—and the one most traders underestimate until they’ve watched a CPU-based heatmap freeze mid-spike.
Bookmap vs ATAS: When a Heatmap Alone Is No Longer Enough
Bookmap set the industry benchmark. They were the first to plot the order book over time, creating what traders now universally call a “heatmap.” Their MBO-driven iceberg detection remains a serious technical achievement—something that deserves honest recognition before any comparison begins.
But in 2026, trader demands have fundamentally matured. A bare heatmap—no matter how clean its rendering—only provides a single layer of market context. It shows you where liquidity is sitting. It does not explain what is happening inside the candle, how volume is distributed between bid and ask, or what the order flow tape is printing at those key levels.
This hidden gap is exactly why more traders are looking for a Bookmap alternative. They want software where the heatmap works in tandem with a comprehensive suite of order flow tools.
ATAS approaches this from an entirely different angle. It is a complete analytical ecosystem where the heatmap acts as a visual trigger to pinpoint key levels, while Footprint charts, the Smart DOM, and volume filters instantly dissect the execution context behind them.
Speed & Rendering: Java Architecture vs 600 FPS
Both platforms operate with nanosecond data precision ($0.000000001$ s). In terms of data feed quality, they are identical.
However, the metric that matters most in a heatmap trading software comparison isn’t data precision. The real issue always occurs between receiving that data and rendering it onto your screen. This is exactly where the bottleneck happens.
Bookmap is built on Java—a sensible choice for its era. However, Java’s architecture relies on CPU-bound rendering. The computer’s processor is forced to calculate incoming market logs while simultaneously drawing the graphics. Under calm conditions, it goes unnoticed. But when heavy action strikes—during the NYSE open, sharp crypto liquidation cascades, or high-impact macro releases—users report CPU usage climbing past 80%². The overloaded processor struggles, begins sacrificing visual frames, and the heatmap on your screen lags split-seconds behind the actual live price.
ATAS Heatmap (Beta) completely unloads visual rendering onto the GPU. While your CPU handles incoming data logic, your graphics card commands everything you see on the screen. The heatmap renders at a fluid, consistent 600+ FPS. Color gradients update perfectly smoothly, and aggressive zooming never breaks liquidity walls into pixelated artifacts. For an active scalper operating in market chaos the quality of limit order book heatmap visualization under pressure determines the difference between defending your account and blowing it up.
3D Heatmap: A Visual Dimension You Can Feel
Standard heatmaps are flat. Because of this, heavy liquidity clusters resting on adjacent price ticks visually bleed together into a single blur. Intricate depth patterns simply get lost in color shade variations.
The 3D mode in ATAS Heatmap (Beta) adds a structural dimension, transforming the flat grid into a physical marketplace landscape:
- Heavy limit order concentrations change from bright flat lines into steep, instantly recognizable vertical walls.
- These liquidity walls dynamically rise and fall, offering an immediate grasp of depth shifts.
- Market order bubbles float as spheres over this landscape, marking exactly where aggressive market orders slammed into resting limit walls.
This doesn’t change your core trading logic, but it dramatically accelerates your perception speed. You no longer have to squint at pixels to estimate volume sizes—order book density is visually obvious.
As of May 2026, no other trading platform offers a native 3D heatmap setup—which is a key reason traders view ATAS as the best Bookmap alternative.
Add-ons vs Ecosystem: What You Actually Pay For
A professional order flow workflow requires an entire suite of tools: a heatmap, footprint charts, cumulative delta, a specialized DOM, and market replay capabilities. Many traders patch this stack together using three different software packages.
Bookmap is engineered strictly as a heatmap tool. Footprint configurations, volume profiles, and advanced historical analytics are kept outside the core subscription—requiring you to buy them individually as expensive add-ons.
ATAS takes the opposite approach. The Heatmap is just one module inside a massive trading ecosystem where everything comes standard under a single subscription:
— 240+ built-in volume and technical indicators;
— 400+ Footprint chart variations;
— Institutional Smart DOM and DOM Trader panels;
— Widgets for advanced market analysis;
— Integrated market Replay engine and trade simulator.
— Results log;
—
Following Manager and much more.
While both tools offer a genuine free heatmap for trading (via ATAS Start and Bookmap Digital), the price discrepancy becomes immense the moment you scale up to futures and require a complete analytical toolkit.
Price Scale Sync: The Small Detail That Changes Everything
Having tools under one subscription is convenient, but how they talk to each other is what matters. ATAS handles this through automatic price-scale synchronization.
The moment you scroll or zoom into the ATAS Heatmap (Beta), your linked Footprint charts and Smart DOM windows instantly lock onto the exact same price range.
The heatmap flags where the heavy liquidity sits, while the footprint chart right next to it reveals how market buyers and sellers are reacting to that wall in real time. No manual scaling, no window swapping, and zero reload lag.
In Bookmap, this out-of-the-box cross-module synchronization is simply not available.
Honest Take: Where Bookmap Holds Its Ground
Bookmap earned its reputation for a reason. For over a decade, their platform has been an industry staple, and their pioneering work with MBO-driven iceberg tracking is elite.
However, the field has leveled. ATAS has directly closed the microstructure gap by introducing its own suite of deep-data tools: Icebergs Tracker, Stop Runs Tracker, and Sweeps Tracker. These tools tap into the same Level 3 (MBO) order logs to expose hidden institutional activity.
Ultimately, Bookmap’s final remaining strongholds are its years of legacy video content and user muscle memory. In every technical category—from GPU rendering speeds and 3D terrain to price-scale syncing and all-inclusive pricing—ATAS is now a step ahead.
Quantower vs ATAS: Specialization vs Multi-Asset
Quantower is a serious multi-asset analytical terminal. It supports over 60 brokers and data providers, covers futures, stocks, forex, and options, and ships with two completely different features that traders often confuse:
- Market Heat Map in Quantower is simply a grid-based performance table (a screener) that shows which stocks or coins went up or down during the day, closely resembling a periodic table or a color-coded asset matrix (like the market maps on TradingView or Finviz). Its purpose is purely high-level market monitoring to track daily percentage gains or losses. It is completely free.
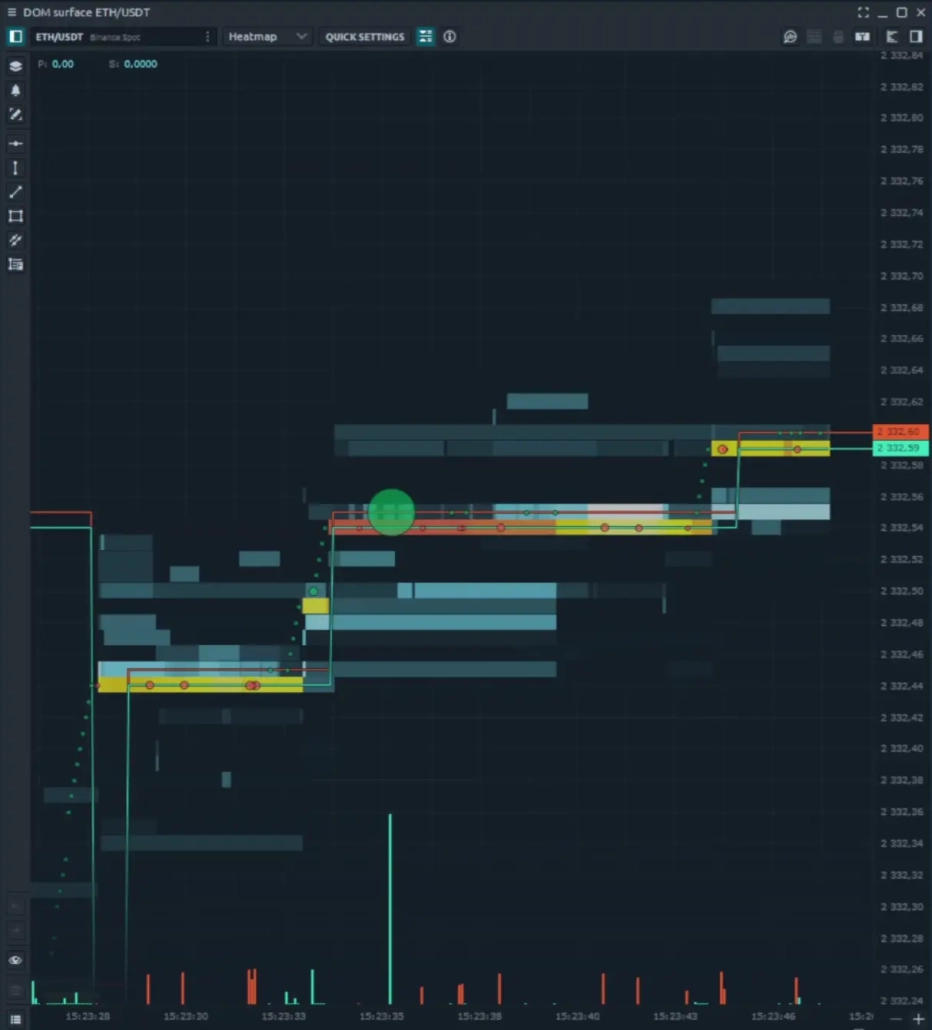
- DOM Surface is the actual real-time liquidity heatmap (order book tracking) equivalent to the ATAS Heatmap. Its purpose is microstructure analysis, visualizing historical resting limit orders, and identifying heavy liquidity walls where the price might stall or reverse. It is strictly gated and only available in their most premium All-in-One plan.
The comparison comes down to a fundamental question: what matters more for your workflow—access to virtually every market and broker through one interface, or surgical-grade precision in order flow and volume analysis?
Quantower’s strength is breadth. ATAS’s strength is depth. For traders whose edge depends on reading liquidity and executed volume at the microstructure level, the difference between a multi-asset terminal and a tool built specifically for order flow analysis becomes visible quickly—and measurably.
What is DOM Surface in Quantower?
DOM Surface is the real liquidity heatmap in Quantower: it visualizes limit orders by price and time in real-time — a direct equivalent of the ATAS Heatmap. Do not confuse it with the “Market Heat Map” in Quantower: the latter is a standard screener for asset percentage changes, like on TradingView or Finviz. DOM Surface is available only on the All-in-One plan.
DOM Surface vs Heatmap: Speed and Granularity
Quantower heatmap equivalent—DOM Surface—visualizes resting limit orders across price and time, serving the same analytical function as a traditional heatmap within its modular environment. For standard market conditions, it delivers solid liquidity visualization that integrates cleanly with Quantower’s overall workspace.
However, the fundamental architectural differences become striking under heavy market load. During high-volatility NASDAQ sessions, within deep crypto order books, or when running multiple instruments simultaneously, Quantower’s engine begins to struggle. The platform is forced to split CPU resources across numerous active panels, causing performance to drop: the refresh rate stutters, color gradients lose their smoothness, and the real-time picture starts to lag.
ATAS Heatmap (Beta) is engineered completely differently: it completely decouples calculations from rendering. The visual layer runs independently on the GPU, completely isolated from analytical data processing. This means that any volatility spikes overloading the CPU have absolutely zero impact on the fluid smoothness and precision of the image on your screen.
Furthermore, the 3D mode in ATAS offers something that Quantower DOM Surface simply cannot provide. Heavy liquidity walls that flatten into a single, two-dimensional colored line in 2D gain physical depth and relief in three dimensions. This gives you a clear spatial understanding of the actual depth and concentration of orders at key levels—completely eliminating the need to guess volume sizes based on color shades alone.
Workflow Integration: Out-of-the-Box vs Manual Binding
Quantower’s modularity is both its ultimate strength and its biggest demand on the user. Since every panel operates completely independently, building a cohesive workspace requires conscious effort: you have to configure link groups, bind windows together, manually align price scales, and verify that real-time updates don’t break across panels. For traders who enjoy spending hours engineering their own software setup, this yields a highly customized environment. For those who prefer to spend that time actually analyzing the market, it represents unnecessary friction.
While ATAS Heatmap (Beta) opens as a dedicated module, the moment you place it alongside Footprint charts and Smart DOM, your workspace is instantly ready to go. The entire analytical chain—from a heavy liquidity wall on the heatmap and its execution via Delta in the footprint, to the order book depth in the Smart DOM—is instantly locked into a single, unified price scale. No workarounds or manual alignment required.
Depth Over Breadth: Order Flow Specialization
Breadth and depth are competing priorities in any analytical software. Quantower chose breadth: a single modular environment covering futures, crypto, equities, options, and Forex, adaptable to virtually any trading style.
However, when it comes to heatmap analysis, that wide reach quickly narrows. The DOM Surface module demands full Level 2 data (order book depth), which is reliably available only in futures and cryptocurrency markets. Equities and options are heavily dependent on specific brokers and data feeds, while Forex—as an over-the-counter (OTC) market—lacks a centralized order book altogether. Consequently, Quantower’s core selling point of multi-market accessibility simply does not translate to liquidity visualization.
Where an order book does exist, the real comparison shifts to the depth of the order flow toolkit. Quantower covers the fundamentals well: or book charts (DOM Surface), cluster charts, Power Trades, and volume profiles are all solid, capable tools integrated smoothly into its modular workspace. What is missing, however, is that elite level of granularity: it offers fewer footprint configurations, lacks a dedicated tape module, and completely omits MBO DOM support.
ATAS was engineered from day one for pure volume and order flow microstructural analysis. It allows you to dissect limit and market orders individually or in combination. You can open a dedicated OrderFlow chart or use the corresponding indicator on a classic footprint setup, overlay tools like Big Trades, Speed of Tape, CVD and CVD Pro, or other professional indicators, dive deep into exchange-level logs via MBO DOM, and execute trades seamlessly through Smart DOM or DOM Trader.
Pricing: Crypto for Free vs License Complexity
While both platforms offer free access to the cryptocurrency market, what you actually get in those tiers varies dramatically.
The ATAS Start plan gives you a complete, professional toolkit completely free: the Heatmap (Beta), Footprint charts, Smart DOM, Smart Tape, and core indicators.
In contrast, Quantower’s free tier only covers basic charts, the high-level Market Heatmap overview, and is strictly limited to a single broker connection—leaving out footprint charts, volume profiles, and the actual DOM Surface heatmap.
ATAS keeps things straightforward: premium tiers start at an accessible €24.95/month with a transparent, clear-cut feature breakdown per plan.
The Verdict: If your workflow genuinely demands options, Forex, and futures together within a single environment, Quantower’s All-in-One plan is a reasonable investment. However, for traders tightly focused on order flow, volume, and liquidity analysis, ATAS stands out as a far more streamlined Quantower alternative—offering a much lower barrier to entry and eliminating unnecessary configuration overhead.
ATAS – An Advanced Alternative to TradingLite
⚠️ Important Update
Currently, the TradingLite web platform has effectively suspended its operations. For those left without their familiar analytical workspace, ATAS offers a complete desktop alternative. With the Start plan, you can analyze cryptocurrencies absolutely free. Not only will you protect yourself from browser lag, but you will also gain access to a vastly deeper suite of professional order flow software.
TradingLite is a popular web-based tool among crypto scalpers. It features a modern interface, clear liquidity heatmaps, and basic footprint charts. It serves as an excellent training ground for beginners to easily understand order book mechanics without installing any software.
But as capital and experience grow, the TradingLite order flow browser version inevitably hits its technical ceiling. A standard browser tab simply cannot deliver the raw power of a dedicated desktop engine.
ATAS is the logical step forward when you outgrow that stage. You move beyond a simple crypto web interface and get an institutional-grade analytical platform. Here, a powerful GPU-driven heatmap is natively combined with volume profiles, deep order flow analytics, and multi-market access.
Browser vs Desktop: Where Performance Hits a Ceiling
TradingLite has established itself as a popular crypto trading volume heatmap with zero entry barrier. The analytical platform runs smoothly in any browser without installation or hardware dependencies. This makes it highly convenient for monitoring the market from a phone or laptop. Under calm conditions, the tool handles its job perfectly.
However, professionals demand absolute stability during high-volatility spikes. This is where browser architecture falls short. A browser tab simply cannot keep up with processing hundreds of thousands of limit order updates during sharp BTC or ETH liquidations.
That is exactly why ATAS operates on a native desktop engine powered by the GPU. The analytical platform offloads the entire visual burden directly to your computer’s graphics card. As a result, ATAS consistently maintains a stable 600+ FPS on both Windows and macOS, even under extreme market loads.
For an active scalper, this is about defending your account. Where a browser-based crypto heatmap tool lags, freezes, or compromises data granularity, the ATAS desktop engine shows the exact volume absorption points in real time.
Crypto-Only vs Multi-Market: Growing Beyond One Asset Class
TradingLite is built exclusively for cryptocurrency. If your strategy is 100% restricted to digital assets, the TradingLite heatmap is perfectly adequate. But successful traders always scale up. If you decide to add liquid legacy futures (like CME’s ES, NQ, or CL) to your trading, TradingLite becomes obsolete. You will be forced to fragment your workspace across multiple applications.
ATAS eliminates these workarounds. It provides a single unified environment for crypto, global futures, and equities. You analyze the market and execute trades within one window. Furthermore, the basic footprint in TradingLite cannot even come close to the deep volume analytics found in ATAS.
True entry confirmation happens when the heatmap works in tandem with a powerful footprint configuration and the Smart DOM. If you only need clean charts today, TradingLite will work. But if you view trading as a long-term profession, choose the TradingLite alternative that eliminates a painful migration to new software in the future.
Free Tier Comparison: ATAS Start vs TradingLite Entry
Both analytical platforms offer free access for crypto traders, but their long-term structural value differs fundamentally.
The ATAS Start plan delivers a powerful, professional environment for crypto at zero cost. It includes the Heatmap for trading crypto, over 400 footprint configurations, the Smart DOM, and the tape. When you decide to expand into futures or equities, you won’t have to change anything. You simply upgrade your license within the platform. All your workspaces, templates, indicator settings, and hotkeys stay exactly where they are.
What is included in ATAS Start for free
✓Heatmap (Beta) with GPU rendering at 600+ FPS
✓400+ Footprint configurations — professional-level cluster analysis
✓Smart DOM and Smart Tape — depth of market and time & sales in a single window
✓Upgrade without changing platforms — all settings and workspaces are saved when switching to a paid plan
Free for crypto traders. Switch to futures and stocks — at any time without migrating to new software.
TradingLite also provides a free basic tier. However, the moment you outgrow crypto, you will have to abandon the platform completely and rebuild your setup on desktop software from scratch. While both tools cost nothing to start, ATAS is engineered to support your entire professional career.
Also Worth Knowing: Sierra Chart, Jigsaw Trading & NinjaTrader
When researching the Bookmap order flow heatmap trading screen setup, you will inevitably run into three legacy giants: Sierra Chart, Jigsaw Trading, and NinjaTrader. They are pillars of institutional volume analysis, but they operate on a completely different philosophy. They don’t compete with ATAS directly as standalone heatmap solutions, because their core focus lies in legacy infrastructure and order routing. Still, understanding their architecture and limitations is crucial for the full picture.
NinjaTrader: Entry-Level Futures, Plugin-Dependent Flow
NinjaTrader is a massive ecosystem and the default software for millions of traditional futures day traders. The platform’s automated strategy infrastructure and deep C# development environment are highly reliable. However, using it for modern market visualization introduces immediate financial and technical friction.
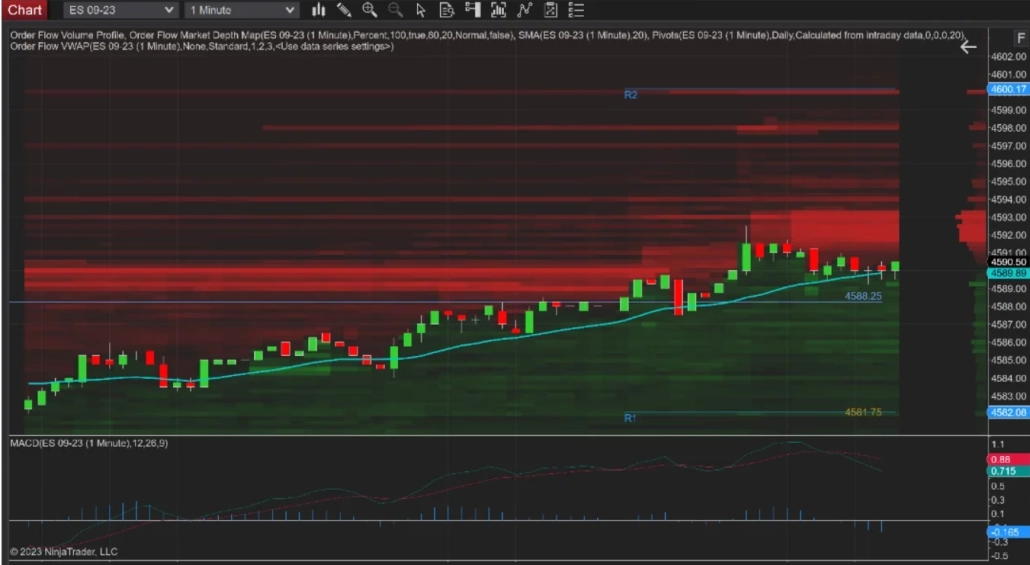
The features in the base tier clearly fall short of a modern trader’s needs. To get access to a standard liquidity heatmap or a fully functional footprint engine, you must subscribe to the separate Order Flow+ add-on for an extra $59/month or pay $1,499 upfront for a lifetime license. On top of that, the platform completely lacks native support for macOS.
In sharp contrast, ATAS keeps things frictionless. The core features required for basic order flow and volume analysis are available even on the free tier. Furthermore, the newly released ATAS X (Beta) is available completely free for all users. It is a fully cross-platform analytical ecosystem that delivers top-tier heatmap rendering and deep footprint analytics natively on both Windows and macOS—without hidden upcharges or clunky workarounds.
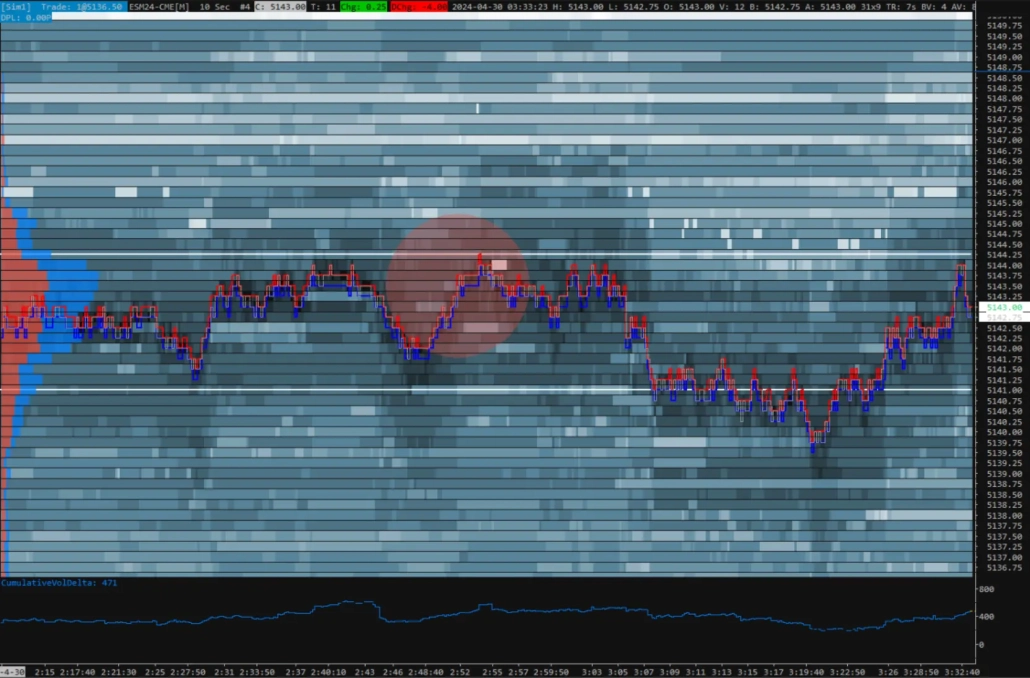
DeepDOM (DeepChart): High Speed with a Focus on “Raw” Data
DeepDOM by DeepChart is a tech-driven software from the Volumetrica team, built for deep order flow enthusiasts. The developers have banked on MBO (Market by Order) data support and microsecond-level update speeds. It is a solid “radar” if you want to track every single micro-change in the order book.
However, the flip side of such intense granularity is a heavy visual load on the trader. By default, DeepDOM’s flat 2D interface broadcasts the order flow “as is,” which can cause the chart to quickly fill up with a dense cluster of dots in an active market. To keep the interface readable, you have to constantly tweak the contrast and filtering settings for every market situation.
How it differs from ATAS: DeepDOM is a decent option if you need a raw, ultra-fast data stream in a classic format. ATAS Heatmap (Beta) takes a different path and handles part of the analytical structuring for you. Here, volume markers are automatically grouped into clear chains, helping you read market mechanics without the need to constantly readjust contrast manually.
Sierra Chart: Ultimate Power, Endless Setup Time
Sierra Chart is an incredibly powerful, low-latency software heavily favored by prop traders who view trading as a pure engineering challenge. When it comes to customization and C++ backend speed, this analytical platform is practically unmatched.
The trade-off, however, is your time. The interface has remained functionally unchanged since the early 2000s. Setting up a clean, usable workspace from scratch can take weeks of manual configuration. The platform does include a native heatmap—the Market Depth Historical Graph—but its visualization has never been a priority.
To activate and fine-tune its liquidity map, you have to manually configure complex parameters across advanced indicators. Sierra Chart is an excellent backend, but it completely lacks the intuitive, out-of-the-box integration that traders expect from modern platforms for scalping.
Jigsaw Trading: Elite DOM, Limited Heatmap
Jigsaw Trading is a highly specialized tool built primarily for tape reading and order book analysis. Its core strengths are the Daytrader DOM and a reconstructed tape, engineered specifically for short-term scalpers tracking aggressive market participants.
However, as a comprehensive visual toolkit, Jigsaw hits clear architectural limits. While its Auction Vista module includes a basic liquidity map, historical depth visualization is secondary here—all focus is locked onto the price ladder. Furthermore, Jigsaw lacks a robust, multi-layered footprint engine, and the platform itself often functions as a plugin, requiring external data bridges and third-party software.
With a one-time lifetime license starting at $579, it can be a practical option if your strategy relies strictly on the DOM. But if your workflow demands a unified, ready-to-go ecosystem with advanced cluster analytics and a heatmap, you will quickly outgrow its feature set.
In sharp contrast, ATAS keeps things frictionless. The core features required for basic order flow and volume analysis are available even on the free tier. Furthermore, the newly released ATAS X (Beta) is available completely free for all users. It is a fully cross-platform analytical ecosystem that delivers top-tier heatmap rendering and deep footprint analytics natively on both Windows and macOS—without hidden upcharges or clunky workarounds.
Tiger.com: Strong Scalping Interface, Basic Heatmap
Tiger.com (formerly TigerTrade) is a popular software featuring a modern, modular design for Windows and macOS. On the plus side, it offers a free license for crypto, alongside a dynamic DOM and clusters tailored specifically for scalping.
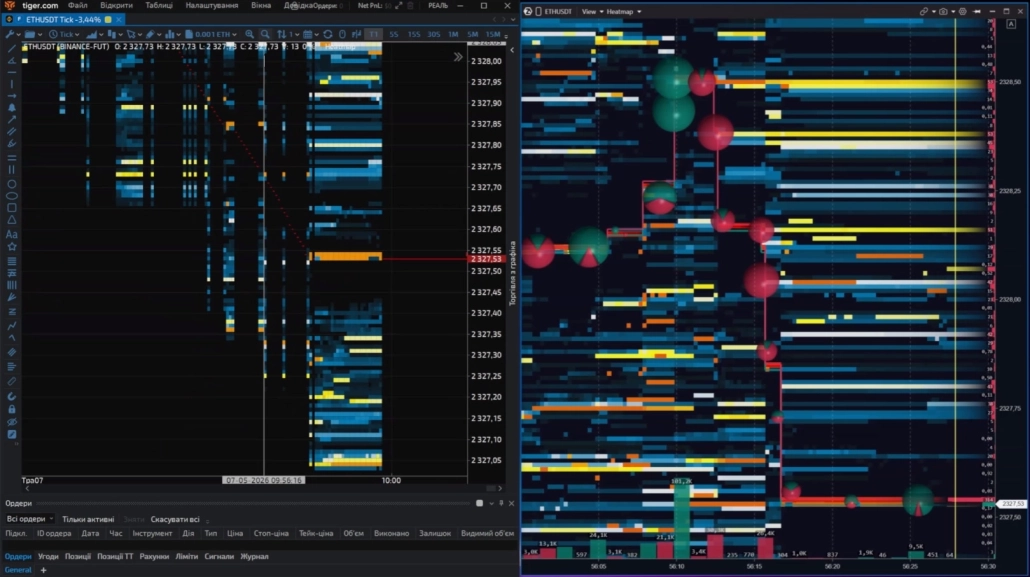
However, when it comes to the heatmap, the platform offers a standard 2D format. Its indicator for large orders displays levels on a flat plane. Because of this, during moments of high volatility, large trade circles inevitably overlap, covering the liquidity map itself and creating visual “traffic jams.” Additionally, with a dense flow of orders, this type of rendering can put a heavy load on the CPU. Tiger.com is an excellent and accessible tool for order book trading. But if you need deep spatial analysis—where large trades don’t blind you but instead line up in clear chains, allowing you to see liquidity levels right through the executed volume—the ATAS Heatmap (Beta) architecture offers a fundamentally different level of analytical clarity.
Frequently Asked Questions
It completely depends on your trading goals, target markets, and preferred workspace:
- Bookmap is a solid fit if you need an isolated heatmap with high execution speeds, clean historical rendering, with a long track record on traditional futures exchanges, the order flow heatmap in Bookmap trading platform is widely recognized in the industry.
- TradingLite is an excellent, budget-friendly choice for crypto traders who prioritize a lightweight web solution without installing software on their PC.
- ATAS is ideal if you want a complete desktop ecosystem where a high-performance heatmap, advanced footprint configurations, and an institutional Smart DOM are natively unified within a single window across multiple markets.
If you evaluate standalone order book visualization in a vacuum, Bookmap remains the gold standard with its dedicated fan base.
However, ATAS opens up more possibilities: it offers faster GPU-driven rendering (600+ FPS), a native 3D mode, and significantly more analytical tools wrapped into a single subscription. For a day trader who demands a comprehensive, all-in-one workflow, ATAS stands out as a more logical and cost-effective choice.
Bookmap is a highly specialized utility. It is engineered almost exclusively for tracking visual order book depth, meaning you have to purchase separate add-ons to analyze clusters or cumulative delta.
ATAS, on the other hand, is a comprehensive volume analysis ecosystem. The heatmap, a powerful footprint engine, the Smart DOM, and over 240 professional indicators are all included right out of the box. Bookmap reveals a single data layer; ATAS covers the entire order flow analysis spectrum.
Yes, professional volume analysis is available to crypto traders at no cost. The ATAS Start plan provides a free heatmap trading solution, Footprint charts, the Smart DOM, and core indicators completely free. If your strategy scales into global futures or equities over time, you can upgrade to an advanced license at any moment.
Quantower is a powerful analytical platform with massive market reach, making it an excellent multi-asset environment for traders handling options, Forex, and futures simultaneously on a single screen.
But if your core edge relies strictly on liquidity and volume analysis, ATAS delivers deeper cluster customization, faster GPU rendering, and seamless automatic price-scale synchronization across windows.
While the modular Quantower order flow tools are strong as a multi-format environment, ATAS is a specialized tool built purely for sharp order flow execution.
TradingLite was originally created as a web-based service for the crypto market, known for its beautiful interface and zero barrier to entry. It was a decent first step for beginners; however, its browser architecture always hit a performance ceiling during heavy market flushes, and its footprint capabilities remained basic.
Following the recent suspension of the service, traders are migrating en masse to desktop analytical platforms. ATAS represents the perfect free alternative for cryptocurrencies: it completely eliminates browser lag, ensures high performance during extreme volatility, and provides an advanced suite of analytical tools absolutely free.
If you want maximum desktop capabilities at zero cost, choose ATAS Start. It gives you a free heatmap for trading crypto natively synced with a powerful footprint engine and order book.
If you want to analyze crypto and global legacy futures side-by-side on a professional level, the premium tiers of ATAS offer the highest technical ceiling.
If you absolutely prefer a browser-based setup without installing software on your PC, TradingLite is the right fit.
Ready to Test One of the Fastest Heatmaps on the Market?
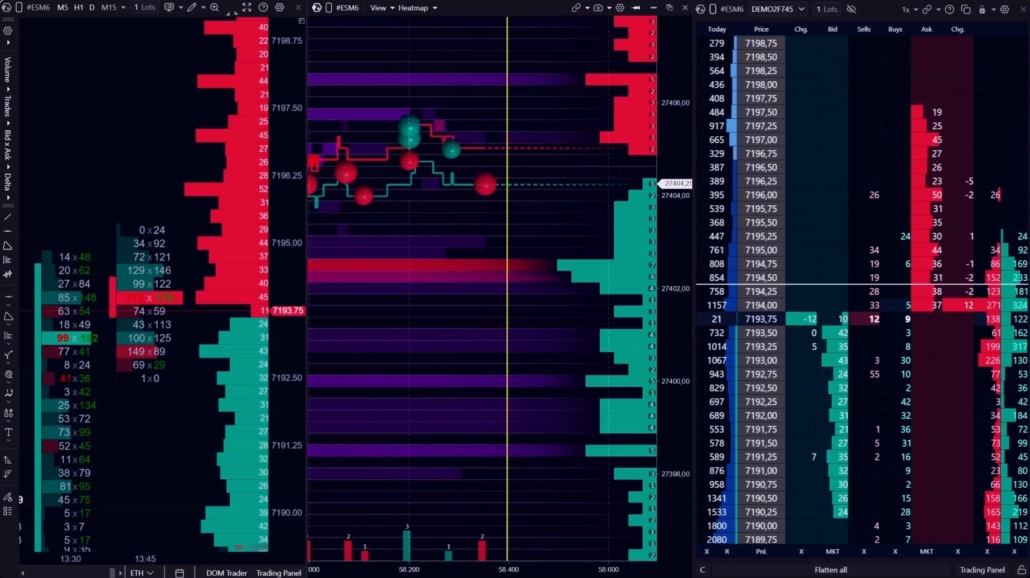
A high-performance liquidity map is a powerful asset, but true professional advantage comes from the ecosystem built around it. Your market analysis becomes genuinely comprehensive when you can spot heavy resting limits on the heatmap and immediately evaluate the price reaction in the adjacent window using volume filters, footprint delta, and execute your orders via the Smart DOM.
ATAS eliminates the constant chaos of juggling multiple open applications, providing a single GPU-driven workspace that scales alongside your career. Start exactly where you are today:
- Crypto: Free Heatmap, Footprint, and core analytical tools on the Start plan.
- Crypto + Futures + Equities: Advanced volume and order flow analysis tools starting from €24.95/month.
- 14-Day Trial: Test the complete, institutional-grade toolkit completely free.
Try one of the fastest Heatmap in the industry. Free for crypto traders on ATAS Start.
1Per internal ATAS LLC testing. Actual performance varies by system configuration and workspace complexity.
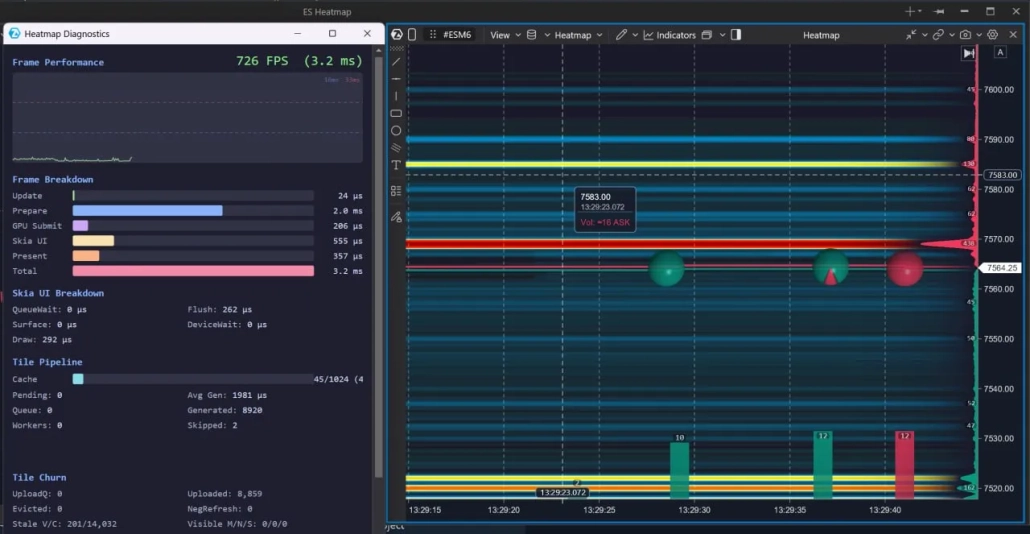
The baseline rendering performance of Heatmap is 650+ FPS. However, in an optimized environment, the engine delivers even higher performance. Below are the recorded results of our internal testing:
- Peak speed up to 726 FPS: Under optimal conditions, the interface refresh rate reaches 726 frames per second. This is 12 times faster than the industry standard of 60 FPS, eliminating delays and chart micro-freezes even during a landslide influx of market data.
- Instant frame rendering (3.2 ms): The system spends a total of just 3.2 milliseconds to completely render a single frame. Compared to the critical limit of 16–33 ms required for smooth human perception, the platform’s graphics power margin exceeds 500%.
- Microsecond-level optimization (Skia UI): Thanks to the Skia UI architecture, the direct UI rendering takes a mere 555 microseconds (μs), proving the engine’s readiness for extreme workloads.
- Stable Big Data processing: Even during heavy rendering of a dense Heatmap with thousands of active limit orders and instant display of large trades (large volume spheres on the chart), the engine maintains peak performance without any frame rate drops.
2Based on user-reported performance data from Bookmap community forums.
Information in this article cannot be perceived as a call for investing or buying/selling of any asset on the exchange. All situations, discussed in the article, are provided with the purpose of getting acquainted with the functionality and advantages of the ATAS platform.
Subscribe
Get the latest ATAS news delivered conveniently