The latest ATAS 8.0.14 update brings a wave of improvements that cut out routine busywork and help you navigate charts faster. We’ve rounded up the key changes to help you set up the new tools your way.
Smart Search in the Instrument Manager
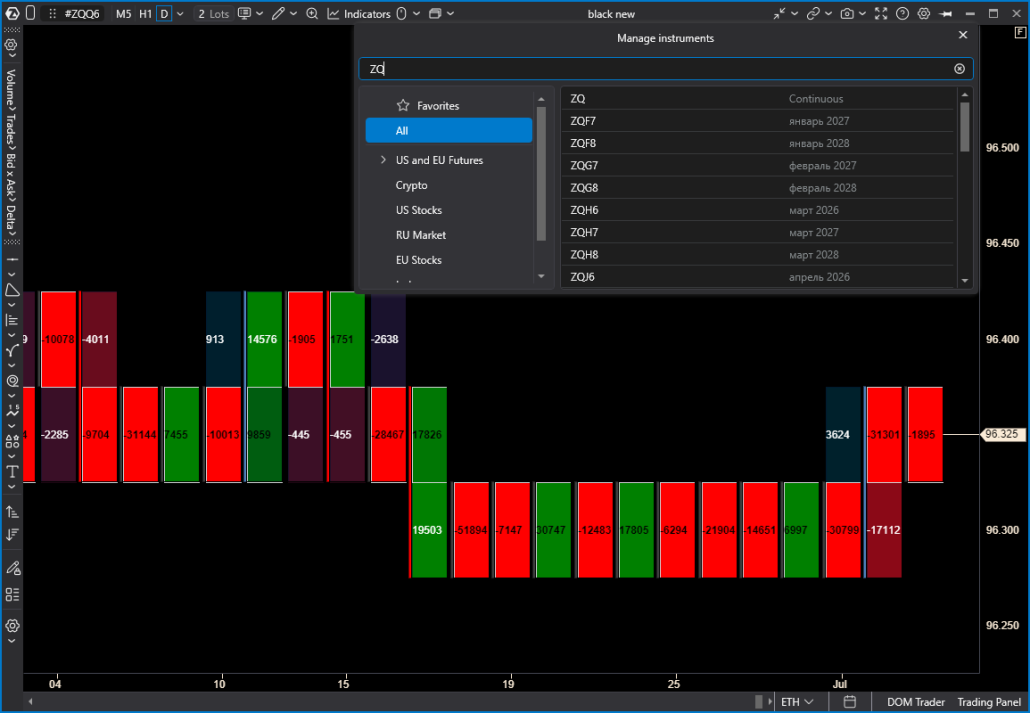
Finding the contracts you need is now much faster — we rewrote the window’s underlying logic so you don’t have to click around as much.
- Favorites right at hand: Now, when you open the Instrument Manager, your favorite tickers load first by default. The instruments you use most are visible right away.
- Search without the mix-ups: The search algorithm is more precise now. The system shows exact matches for your input first, then partial ones. Similar exchange codes no longer get jumbled together in the results.
- Dynamic groups: Instrument categories in the left panel now adjust to your query in real time. As you type a ticker, the menu filters out irrelevant groups and shows only the ones with matches.
New ZQ Futures: The Fed’s Key Barometer
In the US Futures section, the 30-Day Federal Funds Rate futures — ZQ — is now available for analysis on the CQG data feed.
Why this instrument is useful:
- Reflects the market’s rate expectations: The contract price is tied directly to the EFFR rate through the formula:
Price = 100 – Rate
Changes in ZQ quotes give you insight into the pace of Fed moves the market is pricing in for upcoming meetings. - A news-scalping instrument: ZQ works well for analyzing price activity during the ultra-short-term windows created by major macro releases — CPI, Non-Farm Payrolls, and others.
- A primary data source: Probabilities in services like CME FedWatch are calculated from this contract’s order book and volume. Now you can track these capital flows directly inside ATAS.
Price-Based Chart Sync
You may have already seen similar functionality in Heatmap (Beta). Starting with version 8.0.14, linking is now available for charts too.
A familiar situation: you’re analyzing one ticker across several screens — say, a footprint chart on one and a volume profile on another. Previously, zooming moved them independently of each other.
Now you can sync charts by the price axis. As soon as you zoom or scroll one chart, the others adjust automatically. Linking works for any number of windows showing the same ticker within a workspace.
How to turn it on:
- Method 1: In the chart menu, click the cursor icon and select Sync Crosshair.
- Method 2: In the chart menu, click the chain icon 🔗 and enable the Link to Left / Link to Right toggle.
Watchlist: New Interface, Presets, and Drag-and-Drop
Working with lists of instruments is now much easier, thanks to a refreshed interface and ready-made templates.
- Ready-made presets at hand: ATAS now comes with preconfigured lists by default — TOP 10 US Futures and BinanceFutures_USDT. You can easily edit each preset to fit your needs, trimming or adding tickers.
- Custom lists: You can now build your own instrument lists from scratch — tailored to specific analysis sessions and strategies.
- Two-way drag-and-drop: Just drag a ticker from the Watchlist, and it opens instantly on the chart or in the order book. It works the other way too: spot an interesting move on the chart, drag the instrument straight into your Watchlist to keep an eye on it going forward.
Protective Strategy Templates for the Trading Panel
You no longer have to enter your stop-loss and take-profit parameters by hand before every trade. The Trading Panel now has ready-made templates — set up your workflows once, then switch between them in two clicks, right while you’re trading.
How it works:
- Simple — the classic choice for traders who like closing a position all at once. One stop, one target — quick and simple.
- Multi-level — a must-have for scaling out. It lets you split your exit into parts: for example, lock in partial profit at the first level, move your stop up, and take the rest later. A solid way to manage risk when the market gets choppy.
If you switch templates mid-trade, all active protective orders are instantly recalculated and re-placed in real time.
Custom Trading Sessions on the Chart and in Smart DOM
If you only analyze the market during specific hours — say, gold at the London open or crypto during the US session — and want to filter out extra price noise, setting up a custom schedule is now much simpler.
Previously, the chart’s bottom menu only let you pick the standard Regular Trading Hours (RTH); later we added a button for setting up custom sessions. Now any session you create can be renamed or deleted in just a couple of clicks.
- Full control in two clicks: No more clutter in your lists. Any custom session you’ve created can now be renamed, edited, or deleted in seconds, right from the menu. Name it however you like, and get straight to work.
- The order book and chart, in sync: The standout feature — automatic syncing with the order book. All your personal sessions now automatically appear in the Smart DOM module, in the Sessions column. No more manually cross-checking the time: order book and chart data are now tightly locked to the same time frame, making it much easier to analyze volume distribution.
A Unified System for Templates and Snapshots
We’ve merged chart templates and snapshots into one convenient system, so you can build your workspaces like building blocks and switch between them on the fly.
- Selective data saving: When saving a template, you can now check off exactly what to remember: chart settings, indicators, drawing objects, or timeframes. When you load a template, you likewise choose which pieces of it to apply to your current analysis.
- Custom folders for organization: You can now sort templates into folders however you like. For example, keep crypto and futures presets separate, or group templates for Smart Money (SMC) and other approaches into their own folders.
Volume Profile & TPO: A New Name and Clearer Visuals
The Market Profile & TPO indicator and drawing object have officially been renamed to Volume Profile & TPO. We’ve also given the visuals a serious upgrade, so it’s easier to read the balance of power in the market.
- New TPO modes: Previously, TPO levels were marked on the chart with triangles only. Now you can choose a more visual option — turn on square highlighting, keep the triangles, or run both modes at once.
- Precise manual proportions: Using the Width (% of area) slider, you can now manually set a specific profile width (just uncheck auto-proportions to do it). The same manual proportions are now available for the ZigZag indicator, markers, and letters in TPO mode.
- A clearer delta: With delta display enabled, the histogram now builds strictly from the start of the selected period instead of from the center, like before. That makes it much easier to see at a glance who’s winning in the moment.
Smart Auto-Filter and Zones in Big Trades
One of ATAS’s most popular indicators just got more flexible. Spotting large players’ footprints and building support and resistance levels from them is now nearly automatic.
- Three sensitivity levels: The auto-filter calculates the market’s average trade volume on its own, to highlight genuine large-capital anomalies. Previously you could only turn it on or off — now you control its sensitivity directly. Pick the mode that fits current volatility: Weak, Medium, or Strong filtering.
- Protection from system overload: If you turn off the auto-filter and set the Minimum Volume too low by accident, ATAS will flag that there are too many small trades on the chart. Just raise the value to cut the visual noise and keep the system from getting overloaded.
- Zones mode: The most powerful feature of this update. Large trades are no longer just dots on the chart. From every major Big Trades cluster, you can automatically draw horizontal lines. They’re handy to use as local support and resistance levels.
How to set up zones your way:
- In the indicator settings, turn on Zones mode.
- Choose the candle position: build lines for all trades, or only for those that occurred inside the candle body / in its wicks.
- Set the candle-type filter: for lines from the body, choose which candles to focus on — all of them, only trend candles, or only reversal candles.
- Set the line length: lines can extend to the end of the screen or a set number of candles forward.
A Global Drawing Panel with Maximum Customization
If you actively mark up your charts — drawing channels, levels, and trendlines — you’ll appreciate the new drawing panel. Managing drawing objects is now far more convenient, and you can clear your workspace of extra visual clutter.
- Only the buttons you need: You choose which groups or individual tools stay on the panel, and which ones you hide because you don’t need them. Keep only the tools you actually use every day, and hide the rest. You can also resize the icons themselves and make the panel narrower or wider to fit your monitor.
- See the tool you’re picking, instantly: All your favorite templates and drawing objects now mirror their real look right on the panel buttons. If you’ve set up a thick yellow line, it shows up on the panel as a yellow line; a purple freehand line shows up as a purple freehand line. No more confusion between a bunch of similar icons.
- One universal panel for your whole workspace: If you have several charts open at once, you don’t need to keep the drawing panel open on each one. You can leave the drawing panel on just your main chart and hide it on the rest, or drag it anywhere on the screen. The active tool will still draw on any chart — even on top of the Heatmap module.
- Smart timeframe binding: You can set which timeframes show your lines and channels, and which ones hide them automatically, so your chart doesn’t get cluttered. All these settings are saved into templates.
Information in this article cannot be perceived as a call for investing or buying/selling of any asset on the exchange. All situations, discussed in the article, are provided with the purpose of getting acquainted with the functionality and advantages of the ATAS platform.
Subscribe
Get the latest ATAS news delivered conveniently