

A liquidity grab is a simple pattern from the Smart Money Concept (SMC) approach. It occurs when the price briefly breaks above or below a previous high or low—but instead of continuing, it quickly snaps back. While the move is usually small in terms of price, it plays an important role in shaping market structure.
This pattern is closely tied to the concept of market structure in the SMC and is often mistaken for a liquidity sweep. To help traders understand what a liquidity grab is and how to use it, we will break it down step by step—with the help of advanced volume indicators from ATAS. These tools give deeper insight into how liquidity grabs work and how to use them to spot potential trade opportunities in any market.
Disclaimer. ATAS is not affiliated with Michael Huddleston (Inner Circle Trader, ICT) and does not promote his strategies. This article is intended to introduce key concepts of market liquidity and the liquidity grab pattern, as well as highlight tools available in the ATAS platform that may be useful for traders exploring Smart Money Concepts.
Start now!
Try ATAS free with no time limit
What Is a Liquidity Grab?
The name of the pattern—liquidity grab—speaks for itself: as the pattern forms, liquidity is actively redistributed in the market.
But who is taking the liquidity, from whom, why, and how? You will get the answers as you read on.
Example. The screenshot below shows a 1-minute candlestick chart of the E-mini Dow Jones futures, featuring a clear example of a liquidity grab.
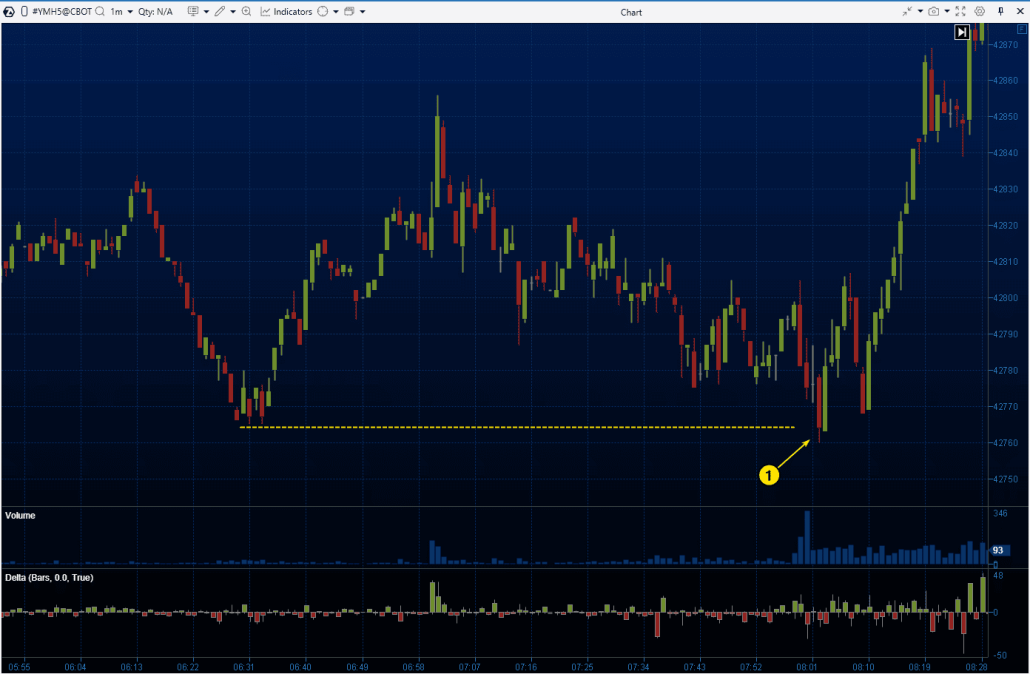
Number (1) shows an example of the liquidity grab pattern: at the start of the European session, the price briefly dropped below the local low of the Asian session. It is believed that this is how Smart Money finds the liquidity they need to set up positions according to their strategy.
How Does a Liquidity Grab Work?
Let’s say Smart Money had a bullish outlook in this scenario—meaning they were looking to get liquidity from sellers. Therefore:
1. They drove the price below the previous low, where buyers’ stop-losses were placed.
2. Triggered stop-losses from buyers created a wave of sell orders, giving Smart Money the liquidity they needed to buy the asset at favorable prices.
3. Smart Money was ready when the price started to rise.
Understanding Liquidity Zones
The idea behind the liquidity grab pattern plays out across all markets—whether it is crypto, stocks, or futures. That is because Smart Money trades in large volumes. To fill these big orders at favorable prices, they need liquidity zones. These zones are where Smart Money finds the liquidity they need to enter the market.
Learn more about liquidity zones:
- What Is the Smart Money Concept and How Does the ICT Strategy Work? – this article explains how large players hunt for liquidity—like whales going after schools of smaller fish.
- Market Structure in Smart Money – a breakdown of how price swings shape the path from one liquidity zone to another.
- Liquidity Sweep – a detailed explanation of liquidity zones, methods for spotting them, and a breakdown of the liquidity sweep pattern, which is similar to the liquidity grab in many ways but differs in one important aspect.
What Is the Difference Between a Liquidity Sweep and a Liquidity Grab?
A liquidity sweep and a liquidity grab are two patterns from the ICT Smart Money concept. Not only do they have similar names, but their underlying principles are also closely related.
The main difference between them lies in scale:
- A liquidity sweep forms when the price enters a liquidity zone in a broad move and remains there for some time, creating fluctuations.
- A liquidity grab is a minimal entry into the liquidity zone, after which the price quickly reverses.
The diagram below illustrates the difference between a liquidity sweep and a liquidity grab using an example of the price entering a buyside liquidity zone.
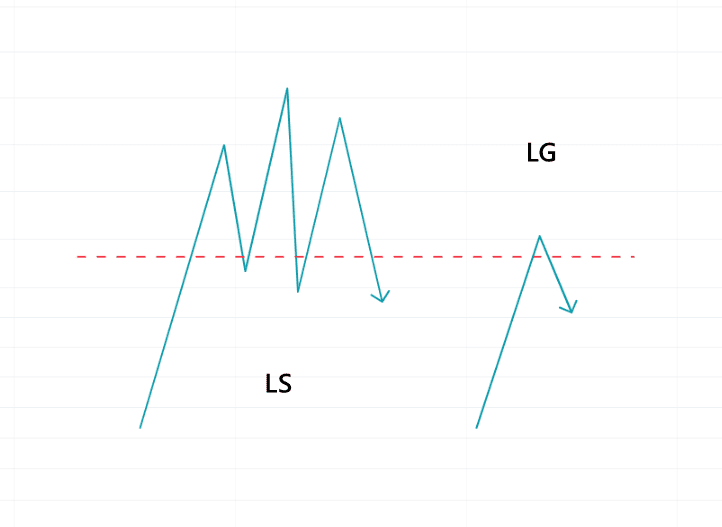
It is clear that a liquidity grab is, at its core, a false breakout of the previous extreme aimed at triggering the “hidden” stop-losses placed in that area. We explored this phenomenon in detail in the following articles:
Trading Strategy for Liquidity Grabs
Let’s say you have identified a zone where stop orders are concentrated. When the price moves through this area and then reverses, it could signal that Smart Money anticipates a continuation of the move in the direction of the reversal. This assumption serves as the foundation for developing trading strategies using the liquidity grab pattern.
Liquidity Grab Trading Strategy: Key Takeaways
A simple trading strategy using the liquidity grab pattern can be broken down into three steps:
Step 1: Identifying liquidity zones. This involves:
✔ Analyzing the market context.
✔ Identifying price extremes where stop-losses are likely to be located.
✔ Drawing levels based on these extremes.
Step 2: Waiting for the levels to be breached. This indicates that Smart Money is executing a false breakout to improve their position. To avoid missing the key moment when the price reaches important levels, you can set alerts on horizontal levels in the ATAS platform.
Step 3: Entering the position. Open a position when the price returns to the previously identified level, confirming the false breakout and the reversal.
Additionally:
- Set your stop-loss just beyond the newly formed reversal extreme.
- Set your take-profit to target the opposite liquidity zone.
Next, we will explore the following aspects with examples:
✔ How the basic liquidity grab trading strategy works on real charts and which tips can help improve it;
✔ How you can enhance this strategy by adding confirmations, refining the entry rules, and reducing risks by using advanced volume analysis tools in ATAS, such as footprint charts, the Delta indicator, the Market Profile indicator, and more.
Example 1: Liquidity Grab in Forex
Below is a chart of the Euro futures contract, data from the CME exchange. While currency futures and the spot interbank forex market are technically different, they are closely linked. Therefore, this provides a suitable example for studying the liquidity grab pattern in forex. Moreover, futures markets offer additional advantages as they enable the analysis of market dynamics using volume analysis tools.
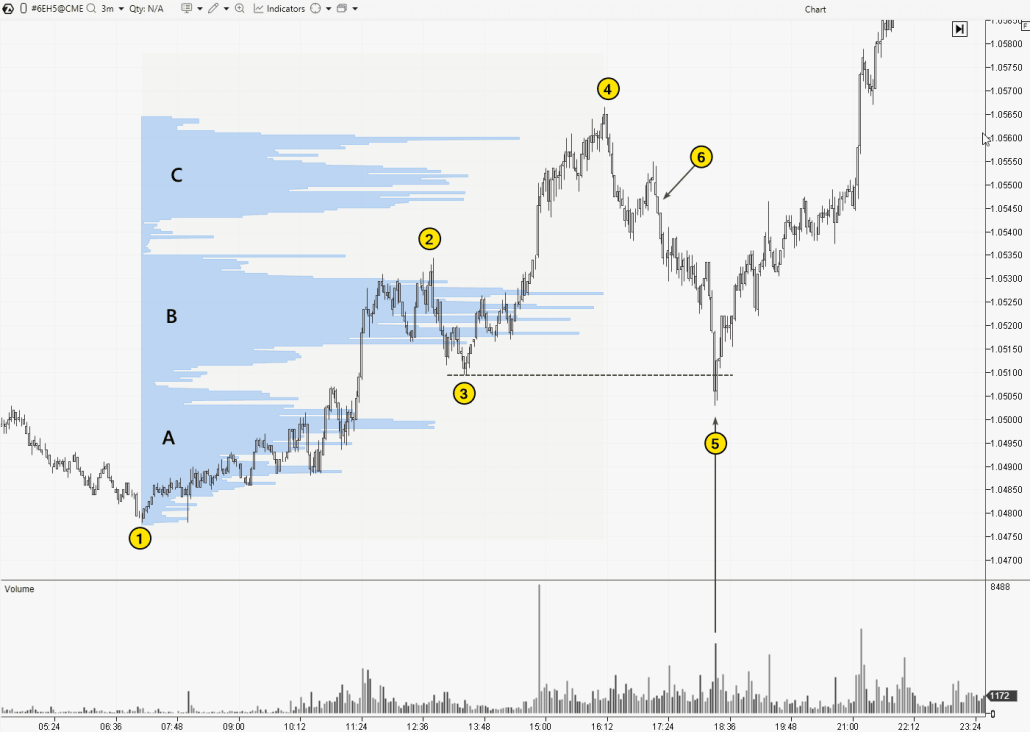
On the left, a bullish 1-2-3-4 structure is shown. The price was rising, creating higher highs and higher lows, with bulges A, B, and C on the profile, indicating price areas where market supply and demand were balanced.
Imagine how a trader holding a long position might have acted. They would likely have considered it rational to keep their stop-loss below the low at point (3):
- this would have been a reasonable spot for a protective order when buying as the price finished forming the balance zone B or broke above it;
- the stop-loss could also have been raised for buys made during the formation of balance zone A.
This reasoning is confirmed when the price reached point (5), where the liquidity grab pattern formed. Smart Money capitalized on the stop-losses below the extreme at (3), triggering them to improve their long positions during the uptrend reversal.
How to Trade Such Situations
When the price rises above the horizontal dashed line, it indicates that “the job is done.” If you decide to buy, you can place the stop-loss below the minimum (5), and the take-profit at the maximum (4) or near the bearish Fair Value Gap pattern (6).
As a general guideline, it is important that the potential profit exceeds the risk, ideally with a reward-to-risk ratio of at least 1.5:1 or 2:1.
Advantages of Volume Indicators
A spike in the vertical volume in the histogram confirms the formation of the liquidity grab pattern, as stop-losses were triggered almost simultaneously. The market profile, in turn, provides an independent assessment of the current situation and helps predict where the liquidity zone (i.e., the stop-losses of small retail traders) may have been.
Example 2. Liquidity Grab Setup in the Bitcoin Market
The screenshot below illustrates how the liquidity grab pattern could be traded in the cryptocurrency market. The data is taken from the BTC/USDT market on Binance Futures.
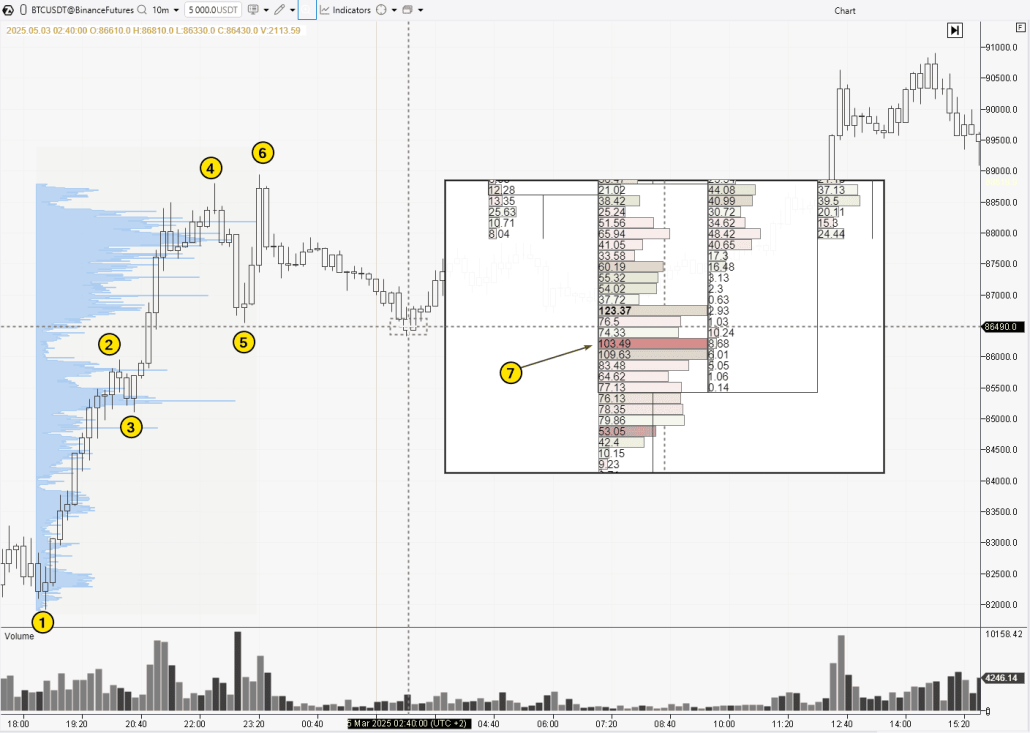
On the left, a bullish structure labeled 1-2-3-4-5-6 is shown. The market profile, with its pronounced peaks, highlights the areas of significant trading activity that occurred above the $87k level.
Once again, let us consider where traders who decided to go long might have placed their protective stop-loss orders. The area below the low at point (5) appears to be the most logical choice. It is therefore not surprising that the price dropped into this zone, forming a liquidity grab pattern.
How to Trade
When a trader has a strong reason to believe that the price is refusing to move lower and signs of an upward reversal appear, they may decide to open a long position. The rationale is that Smart Money expects the upward movement to continue and has already improved their positions by triggering the stop-losses of those who sold below the low at point (5).
- Stop-loss: placed below the liquidity grab low;
- Take-profit: set near the highs around points (4–6), based on the scenario that the price may continue its upward trend.
Advantages of the Footprint Chart
The Magnifier tool (to activate it in the ATAS platform, press the “M” key and hover your mouse over the relevant area of the candlestick chart) enables a more detailed view of the liquidity grab pattern. Note the bright red cluster (7). What is it, if not the triggered stop-losses placed below the low at point (5)? After all, if these market sell orders had represented genuine selling pressure, the price would likely have continued to decline.
If you would like to learn more about trading with footprint charts, be sure to review the following materials:
Example 3. Liquidity Grab Pattern in the Gold Market
Let’s examine how the liquidity grab pattern can be traded in the gold market using a futures chart with data from the COMEX exchange.
The screenshot below shows:
- on the left: a candlestick chart, with arrows marking the liquidity grab patterns;
- on the right: footprint charts detailing the formation of two bearish versions of the liquidity grab pattern.
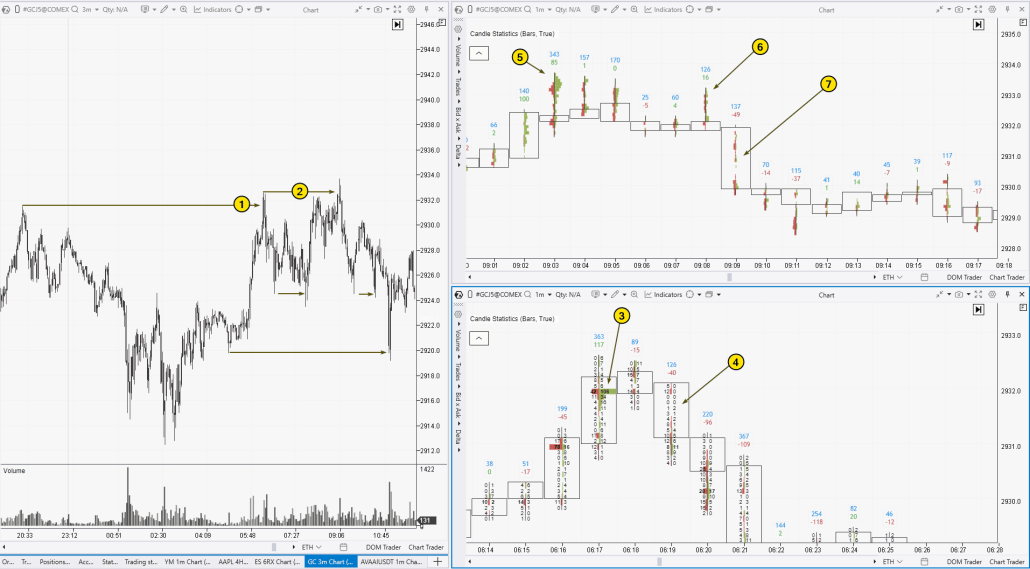
Now, let’s focus on a liquidity grab (1) on the footprint chart in the bottom right:
- number (3) shows buyer activity that did not lead to any upward price movement – an inside bar formed at the next price level;
- number (4) indicates a sharp price drop with no trading activity (shown by zeros in the clusters). This area could be interpreted as a Fair Value Gap, providing confirmation for entering a short position.
Let’s examine a liquidity grab (2) on the footprint chart in the top right:
- in this case, the liquidity grab occurred above the previous one, illustrating how multiple liquidity grabs can form sequentially at the same level;
- number (3) shows buyer activity that did not lead to price advancement, as the candle closed with a long upper wick, confirming the liquidity grab.
- number (6) provides further confirmation of the bulls’ inability to make progress. This is quite similar to the upthrust pattern.
- number (7) marks a decline with indications of a Fair Value Gap, which could serve as a trigger for entering a short position (if the trader has not already entered earlier in a more aggressive manner).
How to Trade
In both cases, stop-loss orders can be placed either below the high of the liquidity grab pattern or above the high of the bearish candle, where the price declines, showing signs of a Fair Value Gap (indicating the strength of sellers).
Take-profit levels can be calculated, for example, using a straightforward mathematical approach. A more advanced method would involve analyzing the chart in a broader context to identify potential sellside liquidity zones, which Smart Money may target as a goal for driving the price lower.
Example 4. Liquidity Grab Pattern in the Cryptocurrency Market
The final example illustrates a series of liquidity grab patterns that formed in the cryptocurrency market.
The screenshot below shows the following charts:
- on the left: a range chart, where increasingly wide price swings not only formed the classic technical analysis pattern known as a “Megaphone,” but also produced a series of liquidity grab patterns;
- on the right: footprint charts displaying detailed formation of two liquidity grab setups.
A range chart can be an effective tool for filtering out market noise and highlighting price movements that form the liquidity grab pattern.
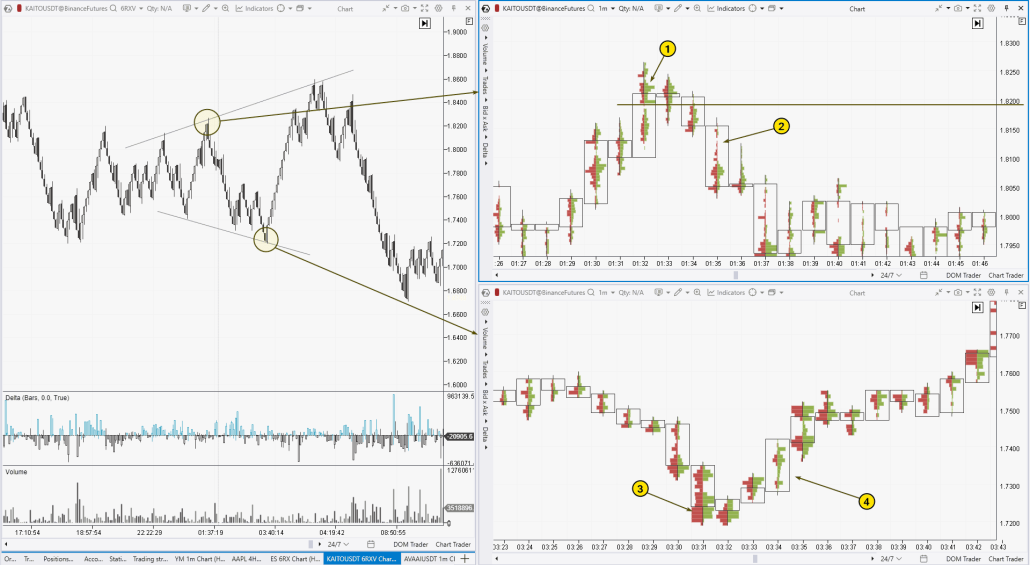
Top right – a bearish liquidity grab:
- Number (1) indicates a spike in buying activity, suggesting that stop-loss orders placed above the 1.8200 level were triggered. Immediately after this surge, the upward momentum slowed.
- Number (2) shows a sharp decline with little to no trading activity — a sign of seller dominance. This can serve as confirmation of the liquidity grab pattern’s validity and/or act as a trigger to enter a short position.
Bottom right – a bullish liquidity grab:
- Number (3) marks a spike in selling activity that occurred as the price dropped to levels corresponding to significant lows on the left. However, despite market sells, the price did not accelerate downward — a sign that sellers’ stop-losses had been triggered.
- Number (4) marks a strong upward movement with no resistance from sellers. Overall, this reflects a mirror image of the earlier scenario.
We hope these examples have helped you gain a clearer understanding of how to apply the liquidity grab pattern in trading.
Tips for Trading the Liquidity Grab Pattern
Before risking real capital, it is important to ensure that you have sufficient grounds to believe that trading the liquidity grab pattern—when executed by you—is more likely to generate profit than loss. It is advisable to follow two steps.
Step 1: Study the theory
Focus on studying materials that are directly or indirectly related to the core concept of the liquidity grab pattern. For example, the following articles on false breakouts may prove helpful:
- False Breakouts in Trading
- Strategy of Trading False Breakout with Market Profile
- Breakout Trading Ideas
- Footprint Patterns
Gain proficiency in volume analysis tools that will help you identify clear and reliable signals to confirm the liquidity grab pattern. Use ATAS tools such as footprint charts, cumulative delta, vertical and horizontal volumes, and others. These tools can also assist in finding optimal entry points and reducing risk.
Step 2: Practice on a demo account
Use the ATAS Market Replay tool. Practicing in a market simulator is one of the most effective ways to reinforce your skills. Explore ATAS functionality to replay historical data in real time, identify liquidity grab patterns, and develop trading skills using the built-in demo account. This enables you to analyze your mistakes and refine your approach — all without risking real capital.
To try the simulator, download the ATAS platform for free, install, and launch it, and then:
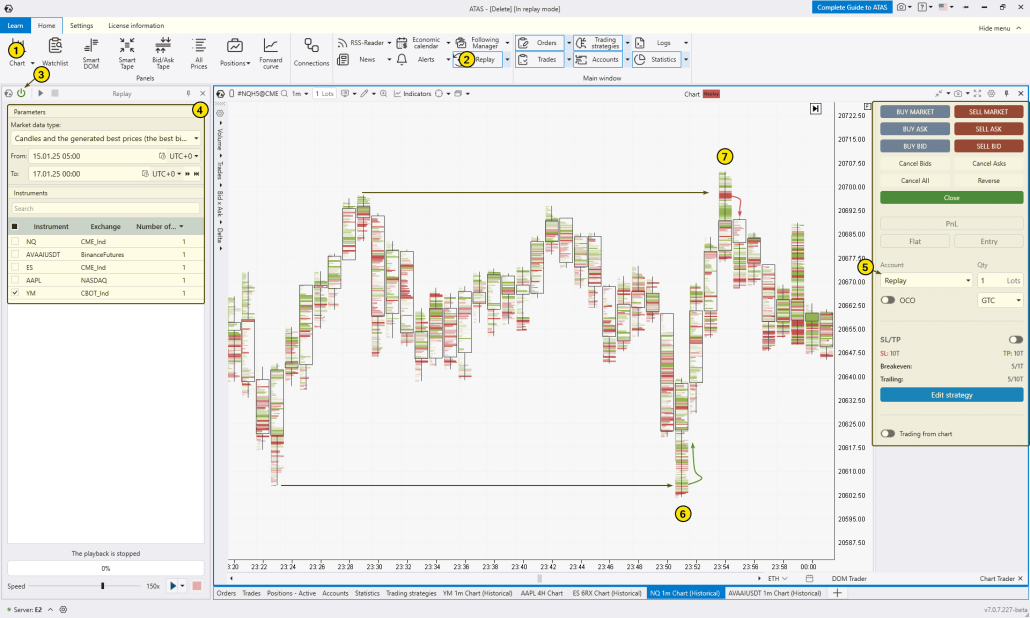
The chart above shows two more examples of the liquidity grab pattern:
- Bullish (6) – when the price dropped below a significant minimum on the left. Bright red clusters at the minimum (without further price decline) indicate triggered stop-losses, while green clusters signal activity from buyers, most likely Smart Money, which led to the progress.
- Bearish (7) – a similar situation, but in the mirror image.
FAQs on Liquidity Grab
What is a liquidity grab?
A liquidity grab (LG) refers to a swift movement of price towards liquidity zones, where stop-loss orders are concentrated. This process is a key element of the Smart Money strategy related to market liquidity.
How to use liquidity grab in trading?
Traders using the ICT Smart Money Concept strategy consider a liquidity grab as a potential signal for a price reversal. Large players often take advantage of these moments to improve their positions by triggering retail traders’ stop-losses, which typically results in price movement in the opposite direction. To confirm that you are observing a liquidity grab, use ATAS volume analysis tools. They will provide reliable confirmations and help minimize the risk of false signals.
Is a liquidity grab a bullish or bearish pattern?
Both scenarios are possible, depending on the context. If the overall market trend indicates upward movement, bullish liquidity grabs are preferred. On the other hand, if the market is predominantly trending downward, bearish LGs are more appropriate.
Why are liquidity grabs popular among Smart Money concept traders?
Liquidity grab trading appeals to traders due to its clear entry signals and the ability to control risks, especially when using advanced software. This strategy helps to identify moments when Smart Money grabs liquidity, often leading to sharp and significant price movements. Additionally, LGs form frequently, even within a single trading day, making them ideal for active trading.
What is the difference between a liquidity grab and a ChoCh?
Both patterns from the Smart Money Concept strategy are similar, but they differ in their nature. A liquidity grab is a trend continuation pattern, while a change of character is an early sign of a potential trend reversal.
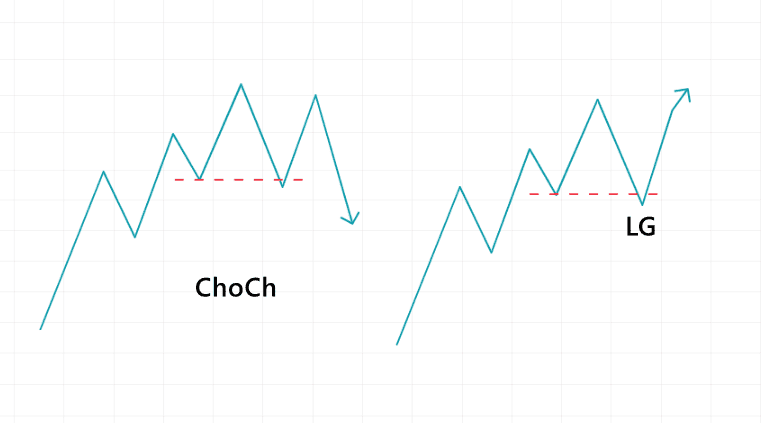
The diagram above clearly shows the similarities and differences between the liquidity grab and the ChoCh. If you want to learn how to accurately identify the ChoCh and differentiate it from the liquidity grab using volume analysis indicators, make sure to read the article: “What Is Change of Character in Trading?”
What is the difference between a BOS and a liquidity grab?
Both concepts are part of the Smart Money Concept methodology and can be viewed as trend continuation patterns. However, in the case of the break of structure (BOS), the trend continues without breaking the sequence of HH → HL → HH → HL (in an uptrend) or LL → LH → LL → LH (in a downtrend). In contrast, the liquidity grab pattern may temporarily disrupt this sequence, potentially misleading trend-following traders.
These two concepts are part of the Smart Money Concept and are often interpreted as signals of trend continuation. However, the key difference lies in the nature of the price movement:
✔ The break of structure (BOS) signals trend continuation without disrupting its structure:
- Uptrend: HH → HL → HH → HL
- Downtrend: LL → LH → LL → LH
✔ The liquidity grab, unlike the BOS, may briefly violate this sequence, creating the false impression of a reversal — which often misleads traders.
Conclusion
Understanding and applying the liquidity grab pattern enables traders to gain deeper insight into the behavior of large market participants (Smart Money) and the mechanics of false breakouts. Developing the skill to identify the liquidity grab on a chart provides an opportunity to enter the market at moments when many participants are exiting after their stop-losses have been triggered.
Advantages of the liquidity grab pattern:
- Following Smart Money’s intentions. The liquidity grab is associated with analyzing liquidity zones—areas where retail traders’ stop orders tend to cluster. Retail traders often act in a predictable and conventional manner.
- Adaptability to various trading styles. The pattern can be used on lower time frames for scalping, as well as on higher time frames for swing trading.
- Compatibility with volume analysis. Market profiles, footprint charts, the Delta indicator, and other volume-based tools help confirm whether a liquidity grab was genuine.
- Favorable risk-to-reward ratio. The accepted risk is usually limited by the newly formed extreme point, allowing for potential returns that often exceed the risk by more than two to one.
Disadvantages of the liquidity grab pattern:
- Trading against the trend. When trading the liquidity grab pattern, traders may find themselves “catching falling knives” or “shorting rockets,” thereby increasing the risk of incurring losses.
- Challenging for beginners. Successful trading based on the liquidity grab pattern requires experience and the ability to accurately identify valid setups—especially during periods of high volatility. Beginners can easily mistake a liquidity grab for other false breakouts or market corrections, making this strategy difficult to master without sufficient knowledge and practice.
- Additional risks. The liquidity grab approach can be fairly subjective, as different traders may interpret the same market conditions in different ways. This increases the likelihood of analytical errors, particularly in unstable markets where liquidity in stop-loss zones may not be as apparent.
Access to tick data, Market Replay, footprint charts, and market profile tools in ATAS offers unique opportunities for in-depth analysis of the liquidity grab pattern. These tools allow for precise examination of price behavior in the context of volume analysis, enhancing your ability to identify optimal entry points. You will be able to track price movement from one liquidity zone to another with high accuracy, which can significantly improve trading performance.
Do not miss the next article on our blog. Subscribe to our YouTube channel, follow us on Facebook, Instagram, Telegram or X, where we publish the latest ATAS news. Share life hacks and seek advice from other traders in the Telegram group @ATAS_Discussions or on Discord.
Information in this article cannot be perceived as a call for investing or buying/selling of any asset on the exchange. All situations, discussed in the article, are provided with the purpose of getting acquainted with the functionality and advantages of the ATAS platform.


