Trading Journal
The Statistics Journal is a log of your market activity that aggregates and processes information from executed and open trades into a single, visual overview. The module organizes everything neatly, highlighting your strengths and weaknesses.
Review your results through an interactive calendar where you can leave notes for each day. All order and trade lists are highly customizable, sortable in a single click, and exportable to CSV if you need to crunch the numbers elsewhere.
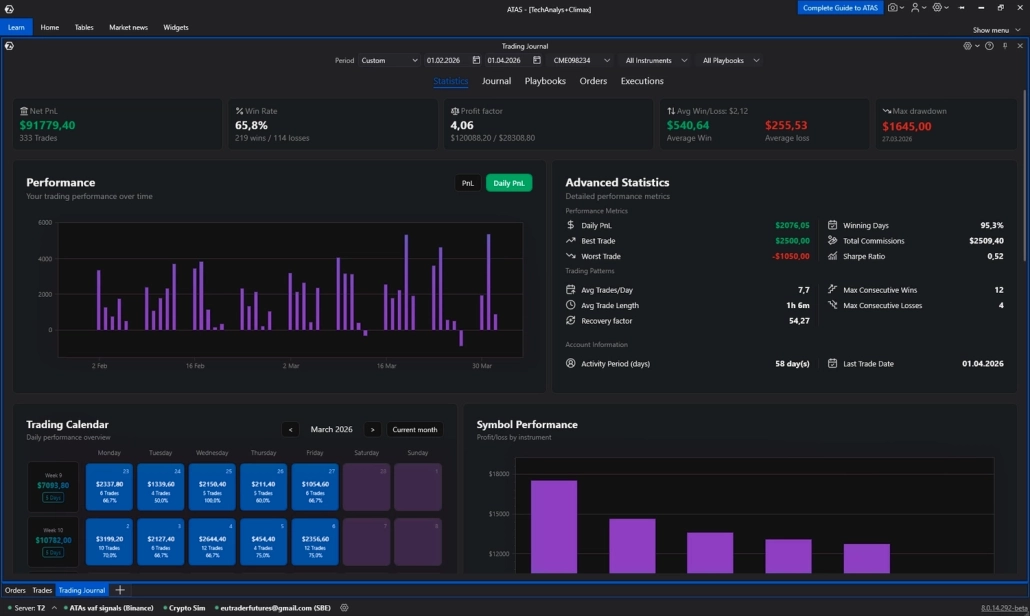
Analyze your metrics, save your best setups into a playbook, and export detailed reports in spreadsheet format.
Under-the-Hood Metrics
The module calculates Net PnL, win rate, profit factor, and drawdowns, plotting a clear equity curve. No more manual Excel tracking: you see your net performance factoring in commissions, average trade duration, and results for your best or worst days instantly.
Your Rules in Playbooks
Stop throwing all your trades into one pile. Create custom playbooks for different strategies, patterns, or even impulsive off-system entries. Simply tag your trades in the journal, and ATAS will display clean statistics for each scenario separately.
Trend Identification
Analyze your volume distribution across each instrument using clear graphs organized by hours and days of the week. Spot patterns easily—such as whether you consistently lose money on Fridays or systematically perform well during the opening hours of the session.