All Markets on One Screen
When you focus on dozens of coins or stocks, it is physically impossible to track the charts of all assets simultaneously. Gather the instruments you need into a single compact table to see the broad picture instantly. Group assets by sectors or categories, track real-time price shifts, and switch charts in a single click without losing focus.
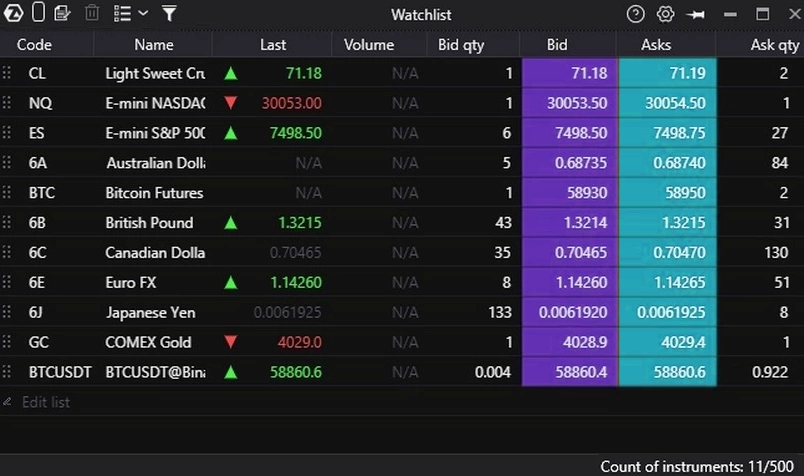
Group the assets you watch into custom lists. Track price and volume changes in real-time charting software, and switch between different instrument layouts or simply drag tickers across your workspace in a single click.
Smart Sorting & Presets
Rank instruments by price change, volume, Bid/Ask, or delta in real time. Configure filters to automatically highlight rows when specified values are hit. Use instant built-in presets—like TOP 10 US Futures or BinanceFutures_USDT—to load high-liquidity assets in a flash, or build your own custom lists from scratch for different analytical sessions or strategies.
Intuitive Drag-and-Drop
Seamlessly drag any ticker from your Watchlist table directly onto a chart or order book to open it instantly. It works both ways: spotted an unusual volume spike or interesting activity? Drag the instrument straight from your active workspace chart or DOM back into your preferred watchlist. Alternatively, you can copy a prepared list of instruments from any external source and paste it directly into the table with a single keystroke.
Cross-Window Linking
Link your Watchlist to charts and the order book within a single workspace. A single click on an instrument in the table instantly recalibrates all open modules on your screen to that asset.