Dow Jones futures let traders gain exposure to movements in the index without buying individual stocks. If you plan to trade E-mini Dow futures, start with the contract size and risk calculation rather than the maximum position your broker allows.
This guide covers YM/MYM contract specifications, position sizing, order flow analysis, and a practical YM example using Volume Profile, Footprint, and Delta. For traders trading E-mini Dow futures, these details provide a framework for evaluating the contract before placing a position.
What Are E-mini Dow (YM) and Micro E-mini Dow (MYM) Futures?
E-mini Dow Futures (YM) are CBOT-listed futures based on the Dow Jones Industrial Average. The contract multiplier is $5 × the DJIA, so each 1-point move is worth $5. The Micro E-mini Dow uses a $0.50 multiplier, making MYM one-tenth the size of YM.
Both contracts track the e-mini dow jones industrial average and provide exposure to the index through a single futures position. The DJIA is a price-weighted index of 30 large U.S. companies; see our guide to the Dow Jones Industrial Average (DJIA) for background on how the index is constructed.
The key difference is point value. A 100-point move is worth $500 for one YM contract and $50 for one MYM contract. The formal product names may appear as the E-mini Dow Jones Industrial Average futures contract and the Micro E-mini Dow Jones Industrial Average Index futures contract.
Start now!
Try ATAS free with no time limit
E-mini Dow Futures Contract Specifications
The E-mini Dow futures contract specifications determine the contract size, tick value, settlement method, and available contract months. Both YM and MYM are based on the same index, but their dollar exposure differs by a factor of ten.
When searching for quotes, you may encounter several terms referring to the same market, including Dow Jones futures symbol, Dow futures ticker, DJIA futures symbol, or simply YM for the standard E-mini contract and MYM for the Micro E-mini. On CME Globex, the official contract codes are YM and MYM.
How Much Do You Need to Trade E-mini Dow Futures? Margin and Cost
You do not need to pay the full notional value of an E-mini Dow futures contract to open a position. Instead, the broker requires margin — funds set aside to support the position and cover potential losses. Margin requirements vary by broker and can change with market volatility, so no single fixed amount should be treated as a universal requirement.
YM requires more capital per position than MYM because its multiplier is ten times larger. As a result, the same move in the Dow produces a dollar gain or loss that is ten times greater for one YM contract than for one MYM contract.
When choosing position size, margin alone should not determine how many contracts you trade. For example, a 100-point move in the index changes the position value by $500 for one YM and $50 for one MYM. If the market moves 300 points against the position, the corresponding loss is $1,500 for YM or $150 for MYM, before commissions and other trading costs.
Margin therefore indicates how much capital is required to maintain a position, but it does not define the amount of risk that is appropriate for a trade. Position size is better determined by the amount you are prepared to lose if the stop-loss is triggered. For a smaller account, Micro E-mini Dow futures can make it easier to scale position size to a predefined risk level than the standard YM contract.
When Can You Trade E-mini Dow Futures? (Trading Hours)
YM and MYM trading hours
YM futures trade through CME Globex from 6:00 p.m. Sunday to 5:00 p.m. Friday ET, with a daily 5:00–6:00 p.m. ET maintenance break. The schedule is nearly continuous during the U.S. trading week, but liquidity is not uniform. CME’s current contract specifications show the same session structure for YM and MYM.
Overnight volume is generally lower. Activity often increases around the U.S. stock market open at 9:30 a.m. ET, with the 9:30–11:00 a.m. window often attracting more volume and price activity. Holiday schedules can differ, and broker access and execution conditions may also vary.
The session schedule matters when reading an e-mini dow futures chart. The same setup can look different during a quiet overnight session and during the main U.S. session because participation and volume change.
How to Trade E-mini Dow Futures for the First Time
To start trading Dow Jones index futures, you first need to select the appropriate contract and determine your position size. The process is essentially the same for YM and MYM, but the dollar value of a price move differs by a factor of ten.
- Choose YM or MYM. If $5 per point is too large for your intended risk, MYM provides $0.50 per point.
- Select the expiration month. Use the current, liquid contract rather than one approaching expiration.
- Choose the direction. A long position benefits from a rise in the futures price; a short position benefits from a decline.
- Calculate position size. A 100-point move equals $500 on YM and $50 on MYM.
- Set a stop-loss. Base the stop on market structure and the amount you are willing to risk.
- Place and manage the order. Monitor price, volume, and the market’s reaction around the level that matters to your setup.
For example, if the stop-loss is placed 100 points away from the entry, the potential loss is approximately $500 for one YM or $50 for one MYM, excluding commissions and other trading costs. The choice between YM and MYM should therefore be based primarily on position size and acceptable risk, rather than on available margin alone.
How to Analyze E-mini Dow Futures with Volume and Order Flow
Why order flow matters
A standard price chart does not always provide enough information to understand what is happening around a key level. Volume and order flow analysis adds another layer of context: it shows where most trades are taking place, how actively buyers and sellers are interacting, and how price responds to their activity.
For example, suppose the YM price is approaching the previous day’s high. The approach itself does not tell you whether the level will break or trigger a reversal. On a footprint chart, you can examine how volume is distributed within each candle and identify the price levels that attracted the most trading activity.
The Delta indicator provides another layer of information by showing the difference between aggressive buying and selling volume. If positive Delta increases as price approaches the level and the market continues higher, this may indicate active buying. However, if heavy buying does not lead to further price gains, it is worth watching for potential absorption, where sellers absorb aggressive demand and prevent the market from moving higher.
This type of analysis helps put price movement into the context of volume and order flow. Rather than looking at the direction of the E-mini Dow futures chart alone, traders can assess how market participants are interacting at specific price levels and whether that activity is supporting or resisting the current move.
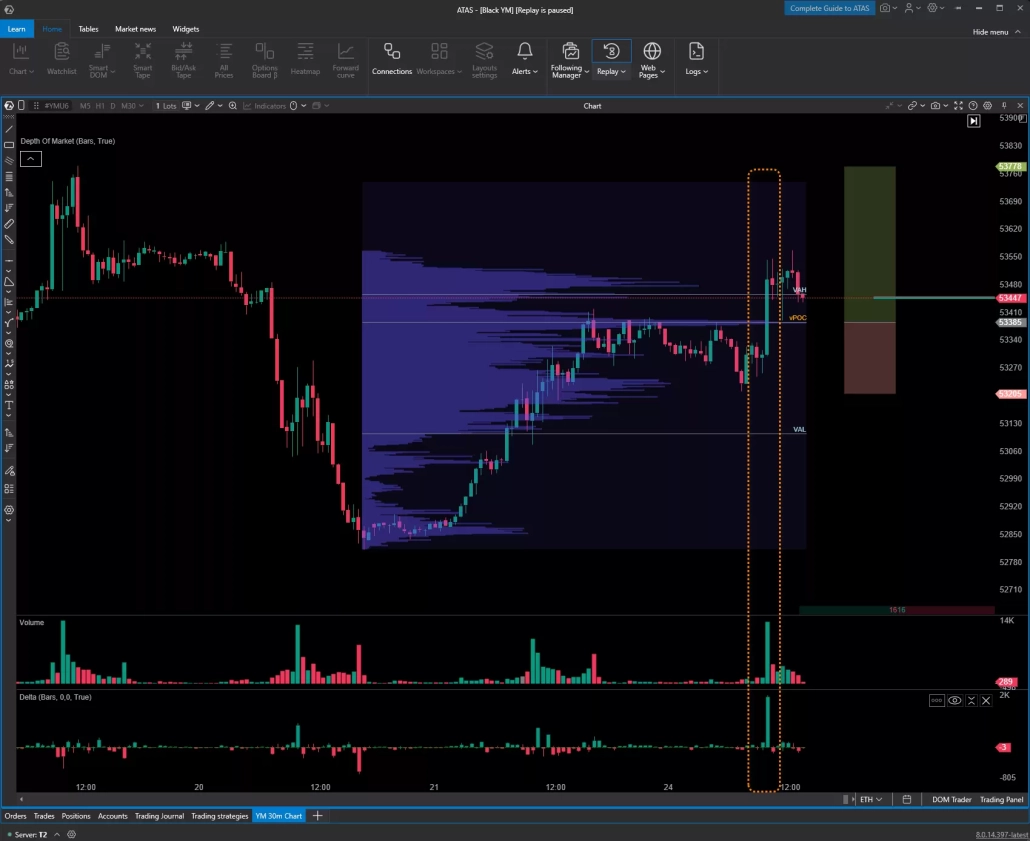
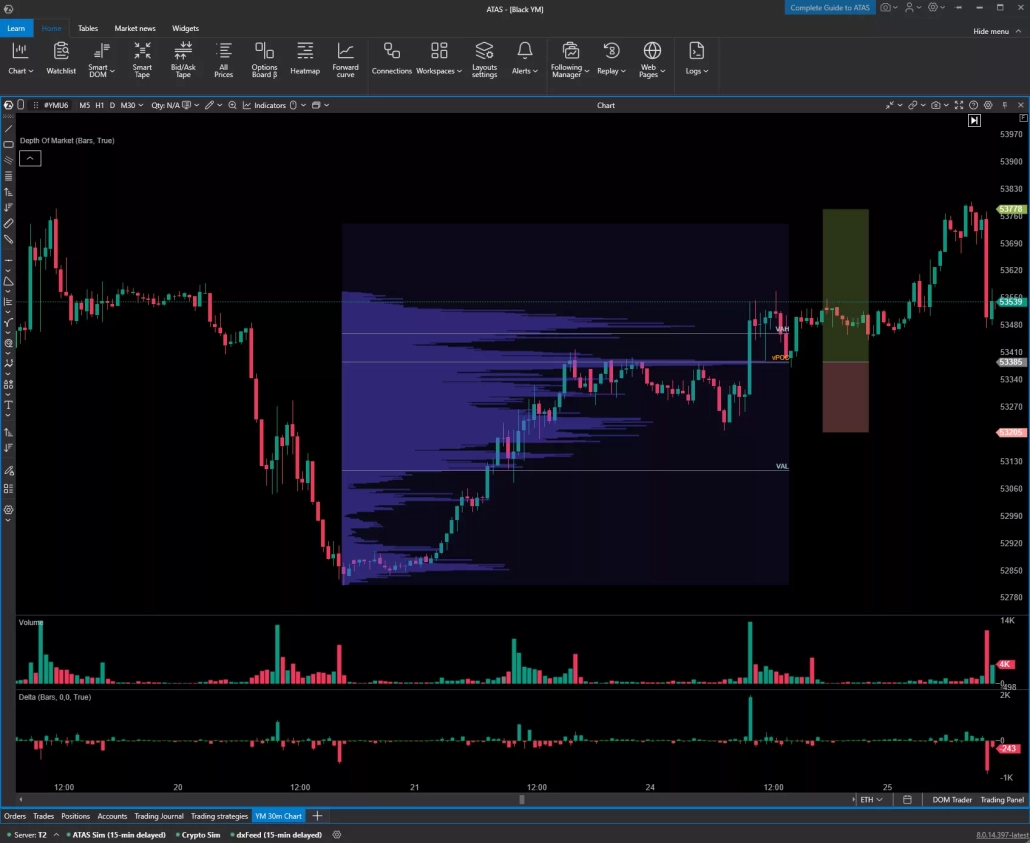
Consider a specific example on the chart. Price breaks through a resistance level around 53,400 that had formed over the previous days, with high volume and strongly positive Delta. This combination can provide additional context when assessing whether the breakout has genuine participation behind it.
If we extend the Volume Profile across the entire upward move, we can see that the highest volume was traded around 53,386, marking the Point of Control (POC). Price often revisits high-volume areas such as the POC, making them useful levels to monitor during a retest.
One possible scenario would be to consider a limit buy order near the POC, with a stop below the previous price low at 53,205 and a take-profit target near the previous high at 53,778. Another approach is to set an alert for a return to the POC and then examine the situation in more detail using a cluster chart to look for additional confirmation.
The key point is not the order itself, but the information available when price returns to a previously active level. Volume Profile, Delta, and the cluster structure can help put the retest into context before a trading decision is made.
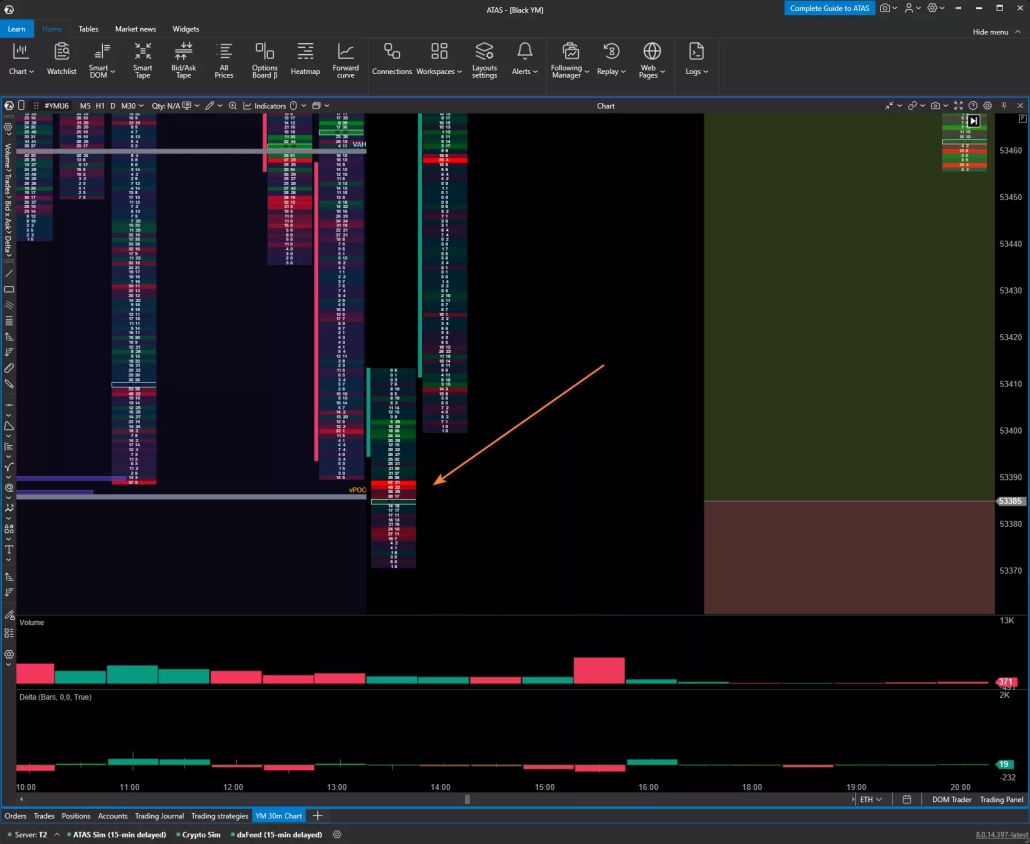
On the Footprint chart, the test of the POC shows signs of market sell-side absorption. A significant amount of aggressive selling is recorded at the retest level, yet price stops declining. This behavior can indicate that resting buy orders are absorbing the incoming sell pressure.
The test candle closes above the area of highest volume, providing additional evidence that buyers are defending the level and that the support may hold. From this perspective, the market has conditions to continue moving toward the previous high at 53,778.
The Footprint view adds important context to the POC retest: instead of relying on price alone, we can see how aggressive selling is being absorbed at the level and how price responds to that activity.
FAQ
Both contracts track the same Dow Jones Industrial Average. YM is worth $5 per point, while MYM is worth $0.50, so the Micro contract has one-tenth the point value.
The YM tick value is $5 per 1 index point. A 100-point move therefore changes the position value by $500 before commissions and other costs.
Yes. CME Globex offers trading from Sunday through Friday, with the daily maintenance break. Overnight liquidity is generally lower than during the main U.S. session.
There is no universal number. The answer depends on broker margin requirements and, more importantly, acceptable risk. Because a 100-point move is $500 on YM but $50 on MYM, MYM can provide more flexibility for scaling a position to a predefined risk level. The maximum number permitted by margin should not be treated as the appropriate position size.
Conclusion
E-mini Dow and Micro E-mini Dow futures provide exposure to movements in the Dow Jones Industrial Average through a single futures contract, without buying individual stocks in the index. The choice between YM and MYM should primarily reflect position size and acceptable risk: for the same price movement, MYM has one-tenth the dollar value per point of YM.
Understanding the contract specifications is only the starting point. When trading E-mini Dow futures, it is also important to see how price interacts with key levels and how much volume is behind a move. Volume and order flow analysis can add context to a standard price chart by showing the activity of buyers and sellers at specific price levels.
For a more detailed analysis of YM price action, you can use ATAS with Footprint, Delta, and other volume-analysis tools. These tools help traders study the structure of price movements and market participant activity before and during a trade, without replacing analysis with predefined trading signals.
Information in this article cannot be perceived as a call for investing or buying/selling of any asset on the exchange. All situations, discussed in the article, are provided with the purpose of getting acquainted with the functionality and advantages of the ATAS platform.
Subscribe
Get the latest ATAS news delivered conveniently