
ES approaches resistance: price is rising, and volume is increasing. Can buyers break through? Candles and volume bars alone reveal little about trading at the level. Order flow analysis shows where buying takes place and whether it can overcome the available sell orders.
This guide explains how to analyze S&P 500 futures using footprint charts, delta, and volume profile. Through three trading setups, we’ll examine what supports a trade, what invalidates it, and how to calculate risk.
What is the ES order flow and how do traders read it?
Reading ES order flow involves analyzing how orders in E-mini S&P 500 futures are executed and how price responds. You compare aggressive buying and selling with opposing liquidity to identify where traders seek immediate execution, which levels hold under pressure, and where price moves through.
Start now!
Try ATAS free with no time limit
⚠️ Trading futures and other financial instruments involves substantial risk of loss. Past results are no guarantee of future performance. ATAS provides data analysis and visualization tools — all trading decisions are made by the trader independently and at their own risk.
Every transaction involves an equal number of contracts bought and sold. “Buying pressure” refers to the aggressive side: buyers take available offers at the ask. Sellers seeking immediate execution trade at the bid. Resting limit orders provide the other side of these trades. This interaction underpins order flow analysis.
Suppose aggressive buying appears at resistance, but price barely advances. Sellers fill buy orders without requiring buyers to pay higher prices. If sell liquidity keeps replenishing, substantial volume can trade at the level without a breakout. This behavior is called absorption.
Now consider the opposite: few sell orders are available, so buying quickly consumes liquidity across several price levels. Price rises on relatively low volume. The height of a volume bar alone therefore cannot tell you how strong a move is.
The key question in order flow analysis
The key question is how far aggressive trading moves price. If buying continues but the rally stalls, the case for a breakout weakens. Before considering a reversal trade, look for the next development: can sellers take the initiative and push price away from resistance?
Why ES Futures Are Ideal for Order Flow Analysis
ES combines centralized exchange trading, high liquidity, and a nearly round-the-clock session. You can compare executed trades in a specific contract with the CME Globex order book. Deep liquidity and tight bid-ask spreads are key features of this market.
The data itself matters. The S&P 500 index is a calculated value with no order book of its own. ES futures have actual orders and trades, and volume measures the number of contracts traded. Concentrated volume on the chart therefore reflects trading activity at specific prices.
The extended session adds context. Suppose ES breaks above the previous day’s high overnight. After U.S. stocks open, you can check whether trading continues above that level or aggressive selling pushes price back into the prior range. The same reference point lets you compare the market’s response across sessions.
Compare volume with the activity of the current session
Always assess volume relative to current activity. A footprint cluster that stands out overnight may be unremarkable after the stock market opens. When setting large-trade filters in ATAS, account for the session: a single threshold can hide overnight activity and clutter the chart during busier hours.
ES Contract Specifications Every Trader Should Know
One ES tick equals 0.25 index points and is worth $12.50 per contract. These figures translate price distances into monetary risk. Trading hours and margin requirements also matter when working with the order book and footprint charts: they determine when you can trade and how much collateral a position requires.
ET is U.S. Eastern Time, which alternates between daylight saving and standard time. See the ES contract specifications for contract details and the CME trading calendar for holiday schedule changes.
ES or Micro E-mini (MES): Which Contract Should You Choose?
MES is one-tenth the size of ES, so the same price move produces one-tenth the profit or loss per contract. If one ES contract exceeds your risk limit at the planned stop distance, MES lets you reduce monetary risk without moving the stop.
☝🏻Did you know that ATAS supports cross-trading? You can analyze ES and manage orders directly on the primary chart, while executing trades through the MES infrastructure. This lowers the barrier to entry due to lower margin requirements, without compromising data quality.
How to enable it:
- Go to Platform Global Settings → check the Cross-trading box.
- Open Chart Trader on the E-mini chart → select the corresponding micro-ticker from the menu.
- A confirmation tag will appear in the window header, and Bid/Ask prices from the micro-futures market will start broadcasting next to the price.
Make sure everything works correctly. Any limit order placed on the primary chart is instantly duplicated on the micro-contract. You don’t need to keep the MES chart open — the order will go through automatically, even if only ES is open.
What Drives ES Order Flow?
Economic News
Economic releases, options and ETF transactions, and orders ahead of the stock market close all influence ES order flow. Similar-looking buys on the tape can serve different purposes: one trader expects a rally, while another is hedging an existing position. These flows help explain why a move can continue without fresh news.
Macroeconomic data releases are an obvious driver. If inflation exceeds expectations, traders may revise their outlook for Federal Reserve rates and adjust positions. Meanwhile, some withdraw limit orders to avoid fills at prices they no longer consider attractive. Selling can intensify just as bid liquidity thins, allowing price to fall through several levels more easily.
Options Hedging by Market Makers
Options hedging also plays a major role. An option’s delta measures its price sensitivity to the underlying asset; gamma measures how that delta changes as the underlying moves. As a result, a hedge may need adjusting through additional futures purchases or sales.
The direction depends on the position being hedged. With negative gamma, maintaining a hedge can require buying as prices rise and selling as they fall, reinforcing the move. Positive gamma can produce the opposite flow: selling into rallies and buying declines, potentially dampening price swings.
📣 Option analysis indicators directly on the ES chart will be available in the upcoming update:
- Options Chain Suite: Featuring four classic option analysis indicators, it allows you to track daily option levels, OI, and GEX profiles.
- Options X-Ray Suite: 10 next-generation indicators powered by CBOE 1-minute data. This lets you analyze 0DTE options in real time — without the blind spots typical of daily static snapshots. Everything you need to analyze SPX directly on the ES chart with today’s market context: option flows, breakdown by participant type, heatmaps, profiles, and market maker hedging zones.
- Options Board & Options Strategy Analyzer: An option chain displaying all series and strikes, Bid / Ask / Last, OI, Greeks, and expiration dates + a simulator for calculating potential P&L, time decay, volatility impact, and delta — available right now.
☝🏻 Options Chain Suite, Options Board, and Options Strategy Analyzer require a connection to Rithmic or Interactive Brokers. The 1-minute data feed used in Options X-Ray Suite is already included in the Ultra subscription — you only need to connect a broker or a third-party data feed for futures.
SPY Exchange-Traded Fund
ES is also linked to SPY, an ETF tracking the S&P 500. Suppose a market maker sells SPY shares to a client and ends up short. A rally would now cause a loss, so the market maker may buy ES to offset that exposure. The tape shows futures buying, although the primary purpose is to hedge a client transaction.
Near the stock market close, closing auction imbalances become another factor. Funds often need to trade at the closing price, but buy and sell interest may differ. NYSE begins publishing closing imbalances at 3:50 p.m. ET, ten minutes before the auction. Position adjustments and related hedging can affect ES during those final minutes.
The tape alone cannot reveal the motive behind every trade. These mechanisms provide context; the chart shows whether activity is moving price.
Essential Tools for ES Order Flow Analysis
The order book, footprint charts, volume profile, and delta show different aspects of the same move. Suppose ES approaches the previous day’s high. You need to assess the sell liquidity facing buyers, how trades execute at the level, and whether price can hold above it. Each tool helps answer part of that question.
Depth of Market — DOM
The order book displays resting limit orders at each price level. Smart DOM shows where buy and sell liquidity is concentrated and how it changes as price approaches. Watch both the size of the displayed liquidity and its behavior.
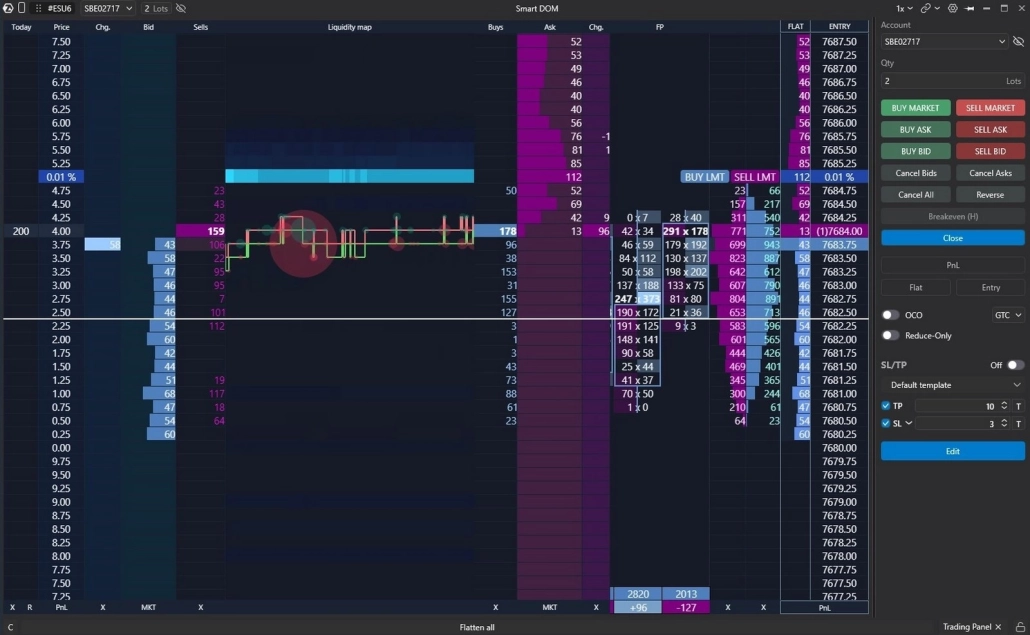
Suppose buyers face offers totaling 300 contracts. If those offers are canceled, the barrier disappears without any buying. If buyers trade against them but sell liquidity replenishes and price stalls, absorption may be occurring. This could reflect an iceberg order with only part of its volume displayed, or new limit orders arriving. In Smart DOM, compare changes in resting liquidity with executed trades.
Footprint Charts
A footprint chart records execution details within each candle, showing how many contracts traded at each price. In Bid × Ask mode, aggressive selling appears on the left and buying on the right. You can examine a level test even after price has moved away.
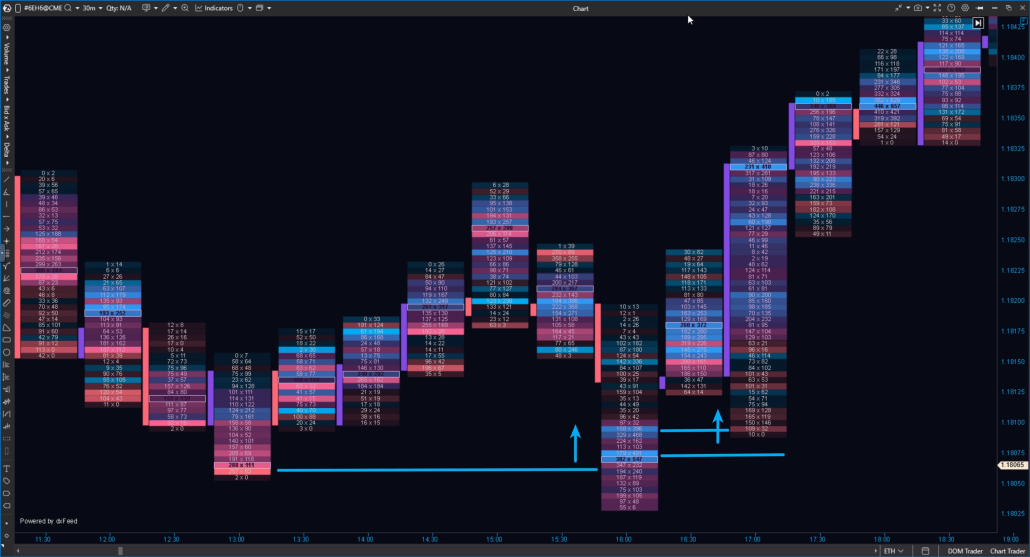
For example, ES briefly breaks above the previous day’s high, then falls back below it. The footprint shows whether buying concentrated above the level and whether price continued higher. Heavy ask volume near the high, with little upward progress, suggests possible absorption of buying.
Imbalances highlight a pronounced difference between buying and selling volume. A diagonal comparison measures ask volume against bid volume at the next lower price. For more detail, see our guide to footprint chart anatomy.
Volume Profile and Value Area
Volume profile shows how much volume traded at each price over a selected period. The longest horizontal bar marks the point of control (POC), the price with the highest volume. The value area contains a specified share of total volume, typically 70%; its upper and lower boundaries are value area high (VAH) and value area low (VAL).
Choose the calculation period in advance: the full Globex session or the regular U.S. stock market session. This choice determines the profile’s levels.
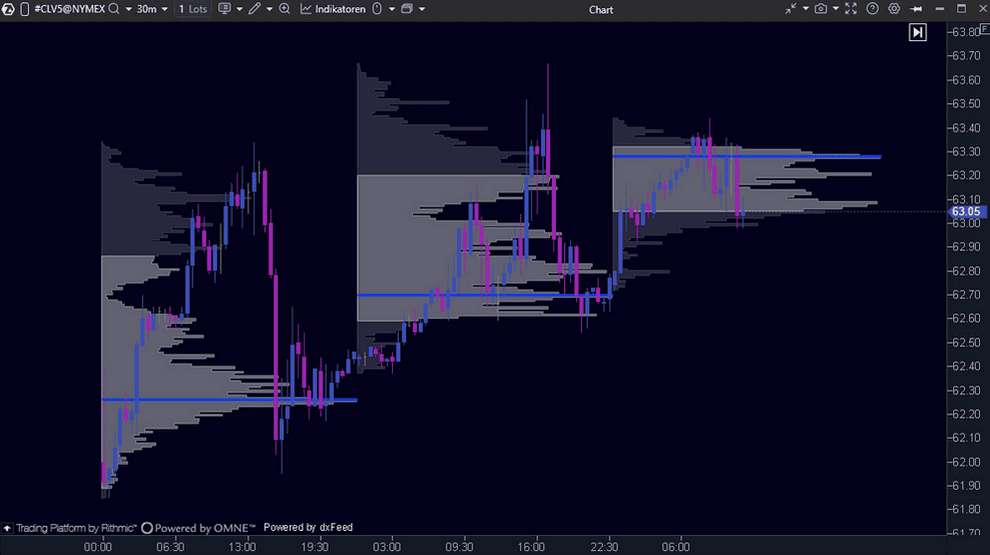
If price moves above the previous value area, watch whether sustained trading develops there. Continued trading above the boundary suggests acceptance of higher prices. A quick return inside indicates that the attempt to establish value higher has not yet succeeded.
Delta and Cumulative Delta
Delta measures aggressive buying volume minus aggressive selling volume. If 800 contracts trade at the ask and 500 at the bid, delta is +300. Cumulative delta adds these differences from a chosen starting point, tracking the balance of aggressive buying and selling throughout a move.
Suppose ES makes a new high while cumulative delta remains below its previous peak. The price high is not matched by a new high in cumulative net buying. This divergence warrants closer attention, but does not by itself signal a reversal.
The Cumulative Delta indicator in ATAS helps identify these divergences. Keep settings and starting points consistent when comparing readings: calculations starting at the Globex open and the U.S. stock market open cover different trading periods.
MBO Bundle – Order Book Granularity
The MBO Bundle reveals what remains hidden on standard depth of market (DOM) and cluster charts: icebergs, rapid liquidity absorptions, and stop-order clusters. The tool operates on market-by-order (MBO) data — processing every individual order separately rather than just aggregated price-level volume.
- Iceberg Tracker identifies iceberg orders and displays their full lifecycle, separating executed volume from the portion that remained hidden. For instance, if a sell order at a resistance level continuously restores itself after being filled, the Iceberg Tracker shows the actual ratio of bought versus sold contracts behind that level — not just the visible tip of the iceberg.
- Sweeps Tracker consolidates trades executed across multiple price levels by a single aggressive market order into a unified event, highlighting total volume and the number of swept levels. When a large order “eats” through several price ticks at once, standard Time & Sales shows it as a series of fragmented trades, whereas Sweeps Tracker gathers them into a single coherent picture.
- Stop Runs Tracker marks zones concentrated with buy stops and sell stops, evaluating total volume, price range, and order count within that area. This allows you to spot high-activity zones in advance as price approaches key levels, helping you refine your own stop placement.
☝🏻 MBO Bundle indicators are included as a bonus with the Ultra subscription and during the free trial of the corresponding plan. This special offer is valid until November 27, 2026, after which access to the MBO Bundle may become paid for all subscription types unless specified otherwise. Currently supported via Rithmic connection; dxFeed support is under development.
How to Read ES Order Flow: A Step-by-Step Approach
Start by choosing an area to watch. On the broader chart, identify a level where price previously encountered buying or selling interest. Then examine executed trades: which side is more aggressive, and is that activity moving price? Two tests of ES support illustrate the process.
1. Identify the Area to Watch
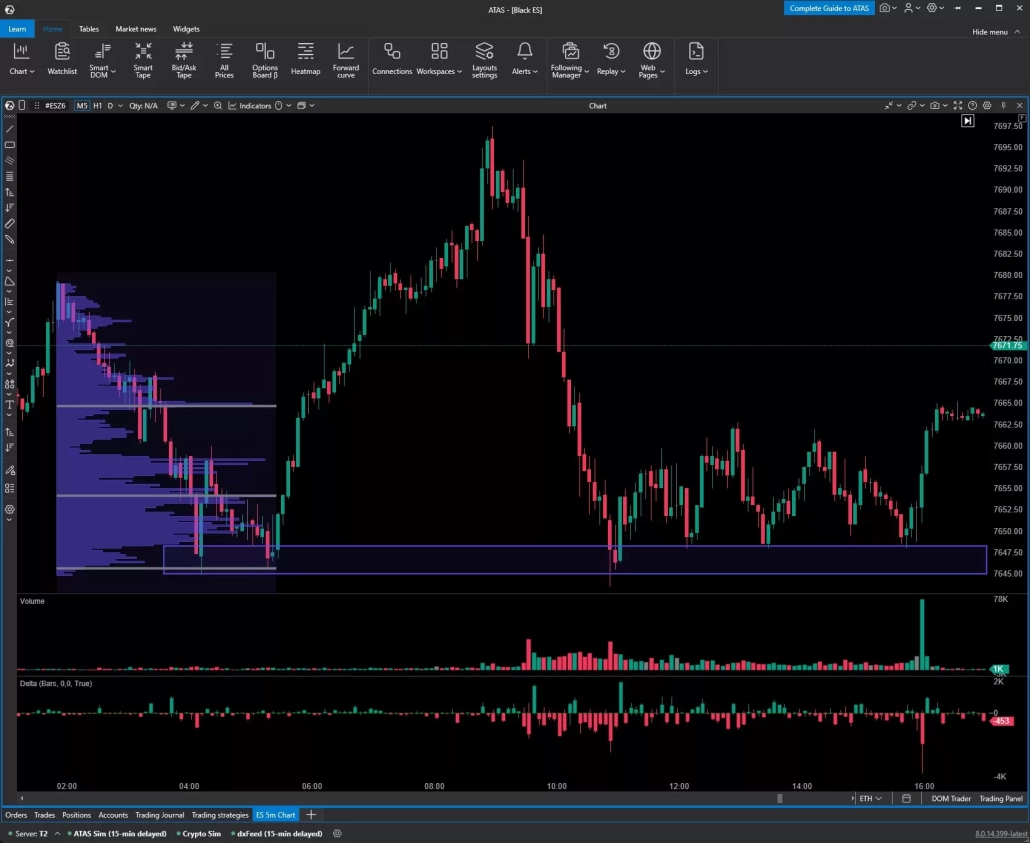
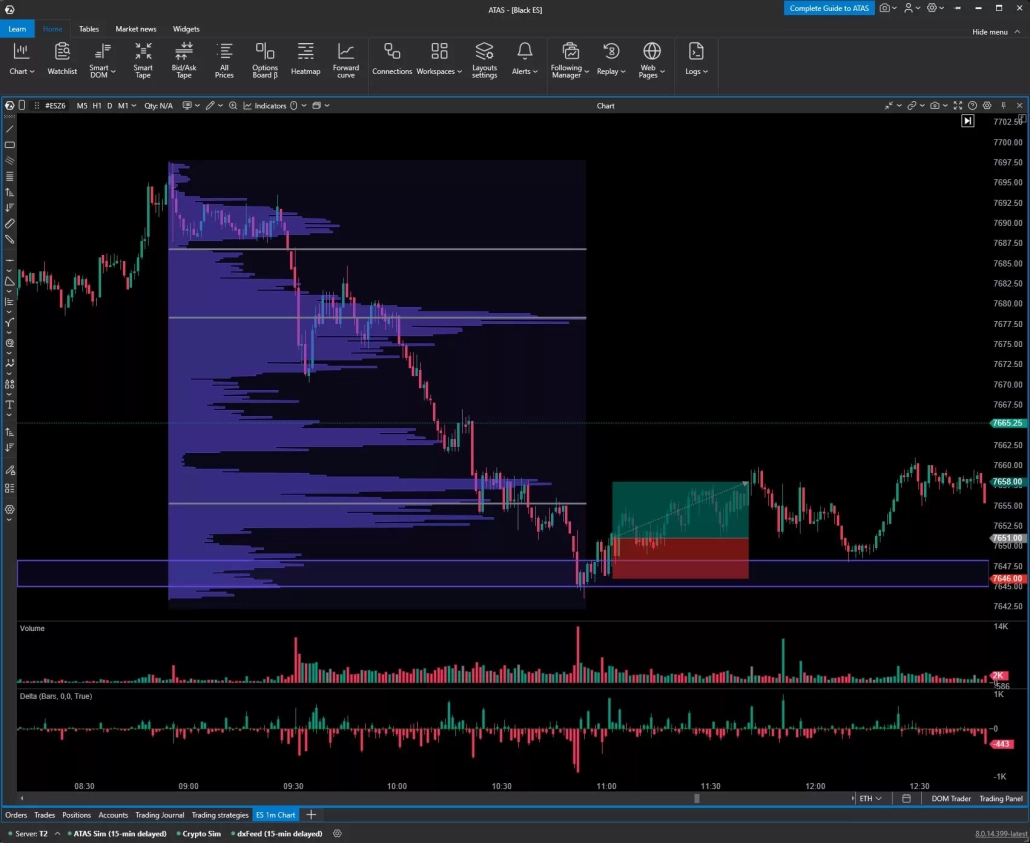
The five-minute ES chart shows morning lows around 7645–7648.50, where price previously rebounded. The volume profile on the left covers the morning period, placing those lows in the context of trading activity at each price. Together, they provide a reference for assessing support. For more on choosing these levels, see our guide to strong intraday levels.
2. Look for Signs of Absorption
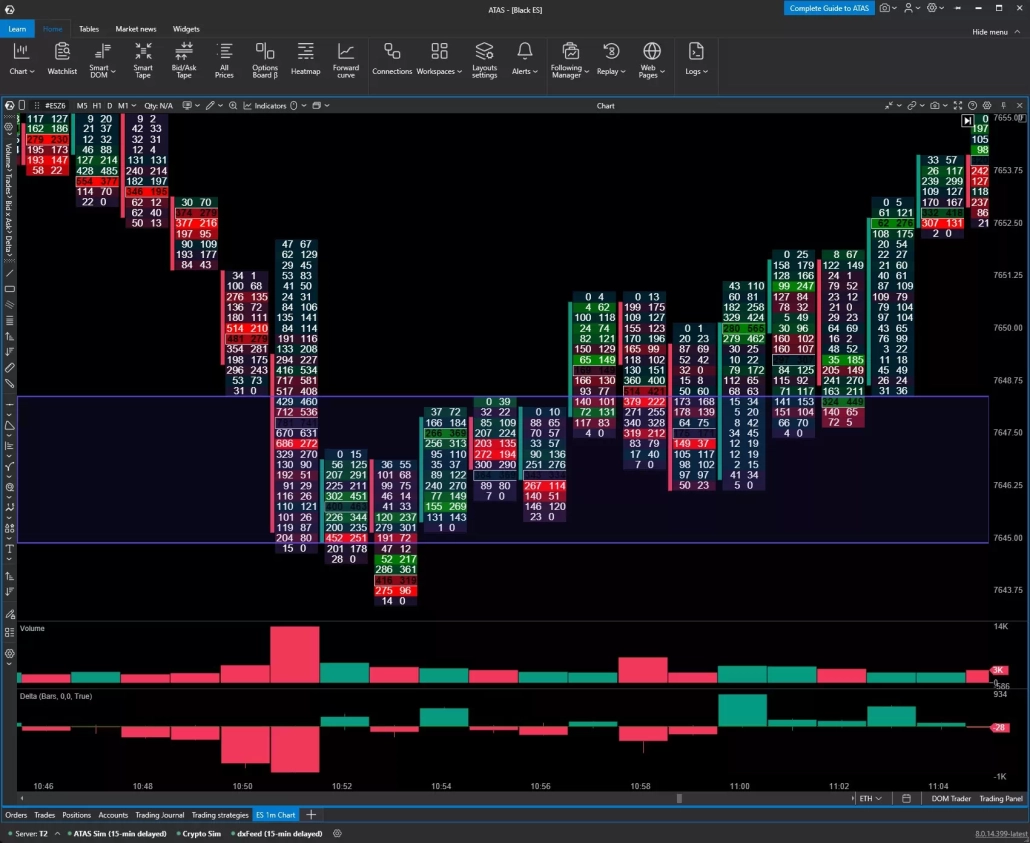
After a rally, price returns to the marked area. Does buying interest remain? The one-minute footprint chart provides a closer view: each row shows bid volume on the left and ask volume on the right.
At 10:51, volume surges, delta is negative, and price continues lower. Selling is still producing results. At 10:53, price moves below support before returning to the zone.
Selling resumes on the retest at 10:58–10:59. The 10:58 footprint shows Bid × Ask pairs of 514 × 421, 379 × 222, and 319 × 212. Yet the 10:53 low remains intact. At 11:00, price rises with strongly positive delta.
This sequence is consistent with sell-side absorption: resting buy orders absorb aggressive selling, and sellers fail to resume the decline. The interpretation rests on both volume and price response. A single large footprint value is not enough.
3. Check Imbalances on the Next Approach
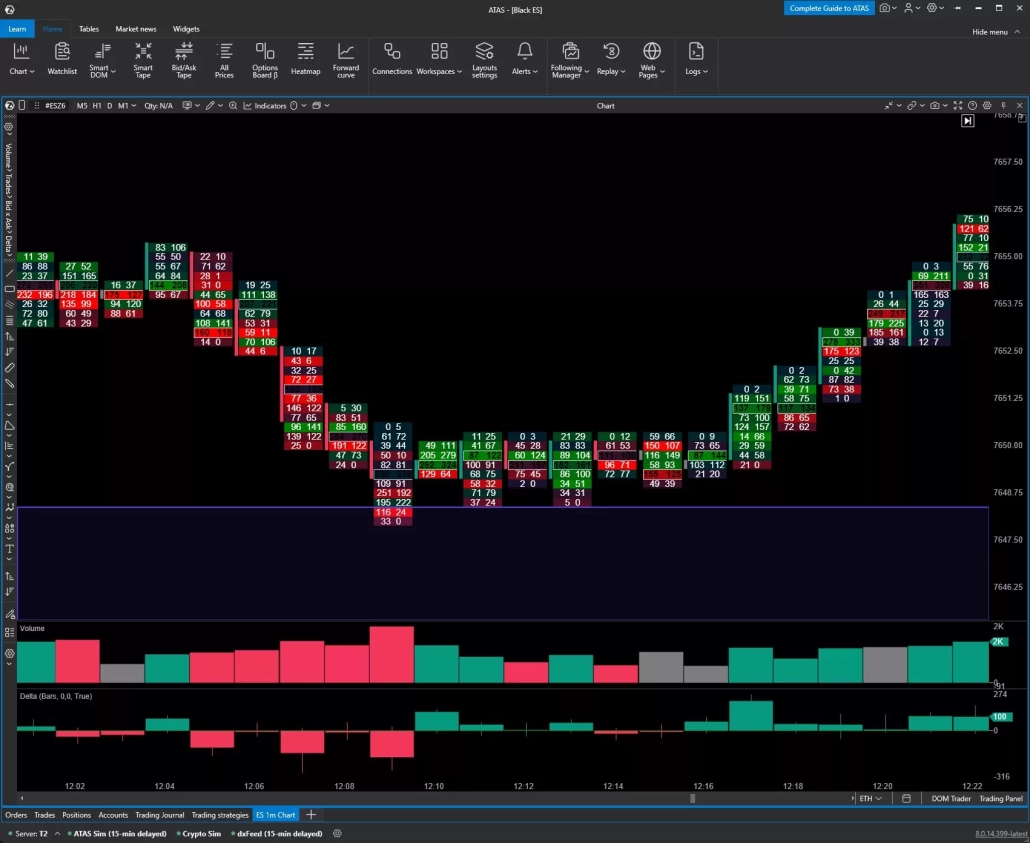
After noon, ES approaches support again. In the 12:07 footprint, compare bid volume with ask volume one price level higher. Three diagonal pairs stand out: 32 versus 6, 160 versus 27, and 146 versus 36. Aggressive selling exceeds buying at the adjacent price by approximately 5.3, 5.9, and 4.1 times, respectively. Selling dominates at several prices within the candle.
These imbalances show sellers’ activity as price approaches support. The continued decline confirms that their effort is still producing results. At the zone, watch whether selling keeps driving price lower or meets enough buying interest to halt the decline.
4. Assess Whether Selling Pressure Persists
At 12:09, price enters support on negative delta. It then stops making new lows. From 12:10 to 12:16, bar volumes are lower than during the 12:09 test, while delta fluctuates around zero. Selling continues but no longer drives a sustained decline.
This suggests weakening selling pressure, seller exhaustion, and a shift toward balance. Absorption involves active selling without corresponding downward progress; here, activity itself subsides. At 12:17, an up candle forms with positive delta, followed by further recovery.
5. Reassess the Original Trade Idea
Support held across both tests, but the behavior differed. In the first, renewed selling failed to break the earlier low. In the second, pressure faded after price reached the zone.
If selling drives price below support and attempts to reclaim it fail, the case for a bounce weakens. A brief move below the boundary followed by a return, as in the first example, can be examined as a potential false breakout.
Try this analysis in ATAS: compare the footprint, DOM, and volume profile as ES approaches your chosen level. Try ATAS for free. Real-time futures analysis requires a suitable subscription plan and an exchange data connection.
Three ES Order Flow Trading Setups
To turn an observation into a trading plan, define your entry condition, stop level, and target in advance. Absorption, delta divergence, and a failed breakout provide different reasons to consider a trade. In each setup below, confirmation must come before entry, and the target must offer enough potential relative to the risk.
Absorption at Key Levels
This setup develops when aggressive selling at support stops pushing price lower. Before going long, look for a response from buyers: the low holds, price recovers, and a local high breaks. The stop limits risk if this structure fails, while the target is based on reference levels visible before entry.
Return to the footprint example discussed earlier. During the support retest at 10:58–10:59, sellers failed to break the 10:53 low. At 11:00, an up candle formed with positive delta. The trade plan is:
The profile covers the preceding downward move. Earlier trading activity around 7658 makes this area a reference for taking profit that can be identified before entry. The trade offers 7 points of potential profit against 5 points of risk: a reward-to-risk ratio of 1.4:1 before commissions and slippage. If your plan requires a higher ratio, skip the entry.
Reversal on Delta Divergence
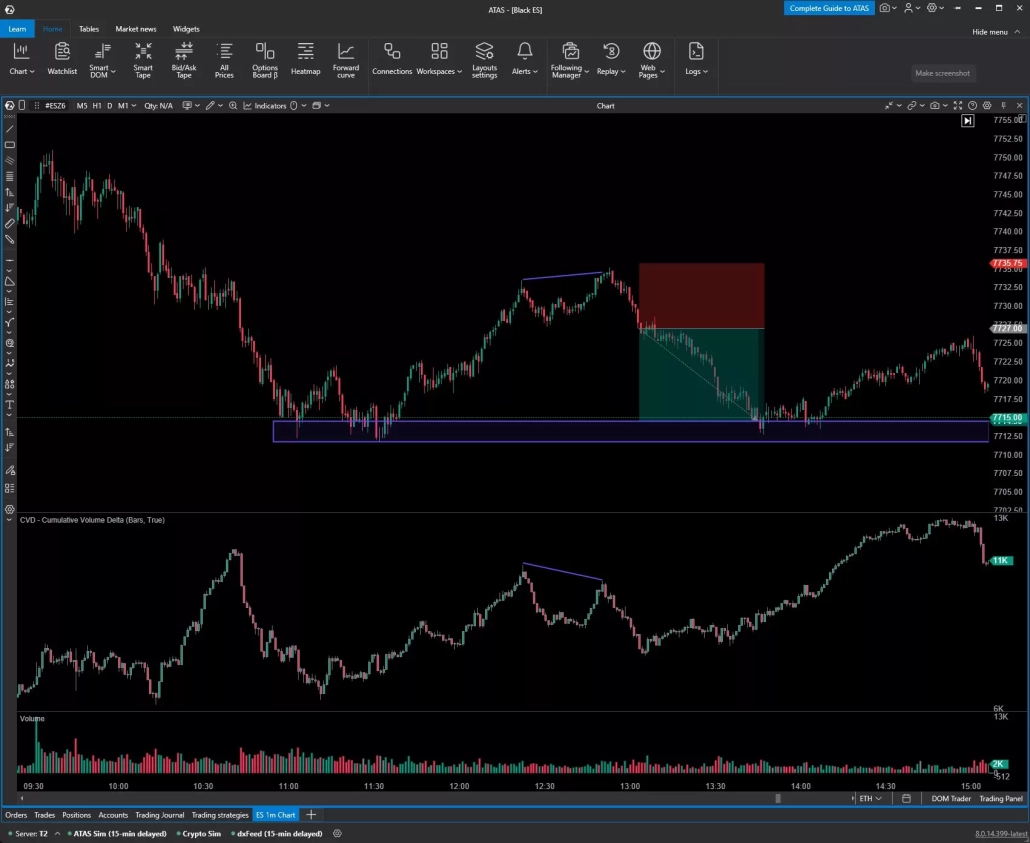
Bearish divergence occurs when price makes a higher high but cumulative delta does not. The new price high is not confirmed by a new high in cumulative net aggressive buying. This is a reason to watch for a reversal, but a short entry requires a break in the bullish price structure.
On the one-minute ES chart, the first high forms around 12:20. At approximately 12:50–12:55, price rises above it while CVD remains below its previous peak. The decline after the second high breaks the intervening swing low around 7727–7728.
The trade plan for this example is:
The target sits ahead of support so the short can be closed before a potential response from buyers. An entry at 7727.00 offers 12 points of potential profit against 8.75 points of risk, a reward-to-risk ratio of approximately 1.37:1 before commissions and slippage. If your trading plan requires a higher ratio, skip the trade.
Failed Auction Setup
In this setup, price breaks support or resistance but fails to hold beyond the level and returns. Traders who entered on the breakout come under pressure. After a downside break, short covering—including triggered stop orders—creates additional buying that can accelerate the recovery.
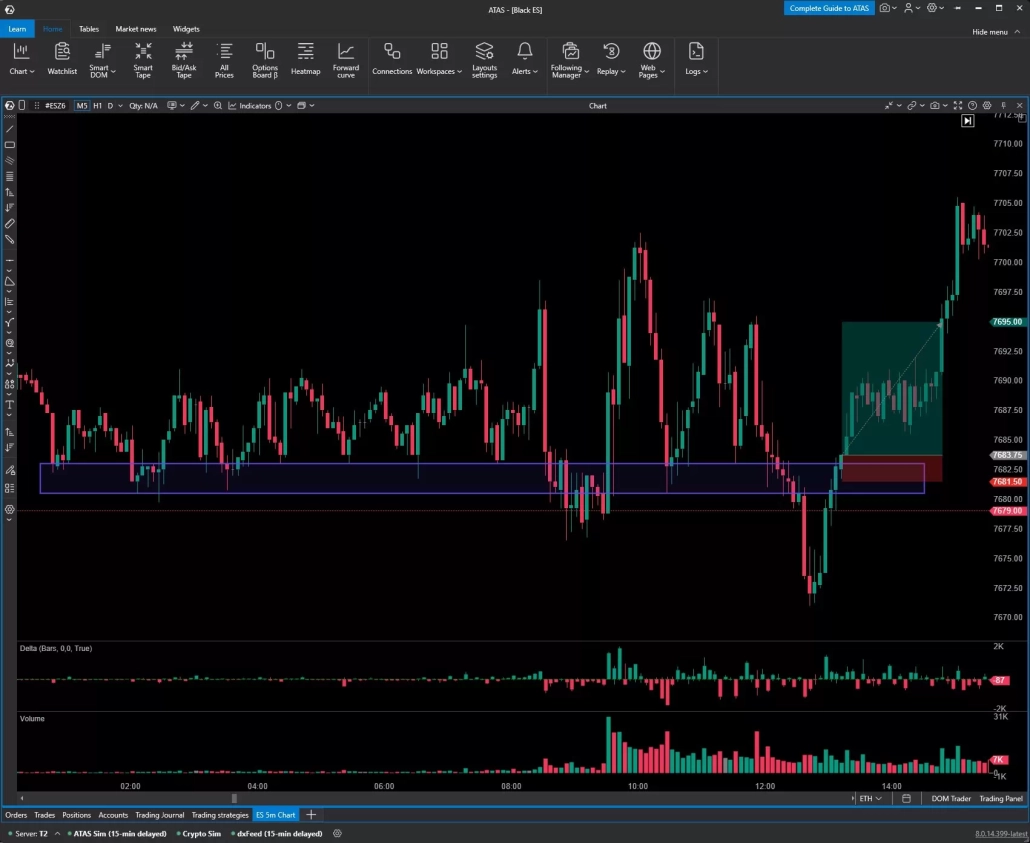
The five-minute ES chart shows support around 7680–7683, where price has repeatedly rebounded. After noon, the market breaks below it, forms a low, and recovers toward the zone. Before considering a long, wait for the reclaimed zone to hold: the first bounce alone does not establish that the downside breakout has failed.
On the one-minute footprint, the recovery at 12:56–12:57 comes with higher volume and positive delta. The 12:56 bar shows Bid × Ask pairs of 95 × 330 and 172 × 499: aggressive buying accompanies upward price progress.
Price first returns to the zone around 13:00, then slips below its lower boundary again. The second return at 13:07–13:09 is more telling. Selling continues during the 13:10–13:13 pullback, but price stays within the zone. Sellers no longer achieve the same downward progress.
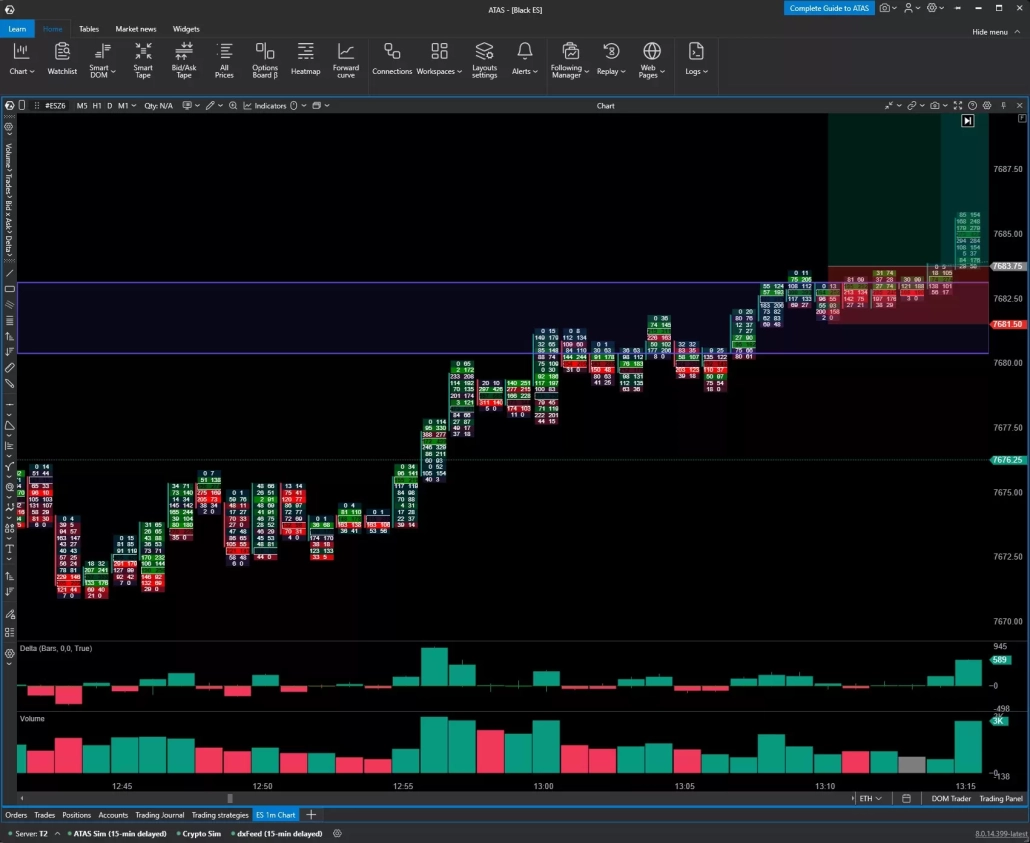
This sequence supports the following trade plan:
The stop is 2.25 points away, and the target is 11.25 points away, giving a planned reward-to-risk ratio of 5:1 before trading costs. This tight stop is based specifically on the local pullback after the recovery. There is no need to wait for price to revisit the low of the entire failed breakout before exiting.
FAQ
Order flow is the submission, modification, and execution of buy and sell orders. The DOM displays available limit orders, while the trade tape and footprint charts show completed trades. Comparing them helps you understand which side is acting more aggressively and how price responds to that activity.
Yes. Professional traders use order flow to assess liquidity, manage trade execution, and analyze short-term price movements. However, it is not essential to every strategy. For intraday traders, footprint charts and delta help clarify activity around predefined levels, but they do not replace a trading plan or risk management.
The choice depends on how much monetary risk your account can accommodate. MES is one-tenth the size of ES: a one-point move is worth $5 per MES contract versus $50 per ES contract. With the same stop distance, MES allows finer position sizing. A smaller contract reduces the monetary impact of a price move, but not the probability of a losing trade.
You need a platform with footprint charts, DOM, volume profile, and delta, plus an exchange data connection. ATAS lets you use these tools together. Real-time ES analysis requires a suitable subscription plan and a CME data feed; a full DOM view also requires market depth data.
Conclusion
Reading ES order flow means comparing trading activity with price movement. Footprint charts show executed trades, delta measures the balance of aggressive buying and selling, and volume profile identifies where trading is concentrated. Together, they help you assess whether a breakout gains follow-through, selling meets buying interest, or a new price extreme is supported by trading activity.
Start with one setup and review several sessions in ATAS. Before each potential entry, identify the confirmation you need, your stop, and your target. Then compare the outcome with your original trade idea. Include failed examples: they help you recognize when a familiar pattern does not offer suitable conditions for a trade.
Information in this article cannot be perceived as a call for investing or buying/selling of any asset on the exchange. All situations, discussed in the article, are provided with the purpose of getting acquainted with the functionality and advantages of the ATAS platform.
Subscribe
Get the latest ATAS news delivered conveniently