
Break and retest is a trend-following entry strategy: price breaks through a support or resistance level, then pulls back to retest that same level before continuing in the breakout direction. Traders use this pullback (the retest) to enter with a logical stop-loss placement and a clear profit potential.
The problem is that on real, noisy charts, clean retests are rare. Price often overshoots or undershoots the level, and sometimes the breakout turns out to be false: price fully reverses back across the level.
Most articles on break and retest stop at “look for a candlestick pattern to confirm it.” That’s not enough to avoid a false-breakout trap. Three real charts — the S&P 500 futures (ES), gold, and Bitcoin — show how Order Flow and volume analysis in ATAS let a trader tell a genuine breakout from a price manipulation.
Start now!
Try ATAS free with no time limit
⚠️ Trading futures and other financial instruments carries substantial risk of loss. Past performance does not guarantee future results. ATAS provides data analysis and visualization tools — all trading decisions remain the trader’s own, made at their own risk.
What Is the Break and Retest Pattern?
What Is a Breakout?
A breakout in trading is an impulsive price move that pushes through a previously established support or resistance level. A breakout is usually accompanied by a rise in volume and signals that the prior balance between buyers and sellers has broken down: price is searching for a new level that satisfies both sides.
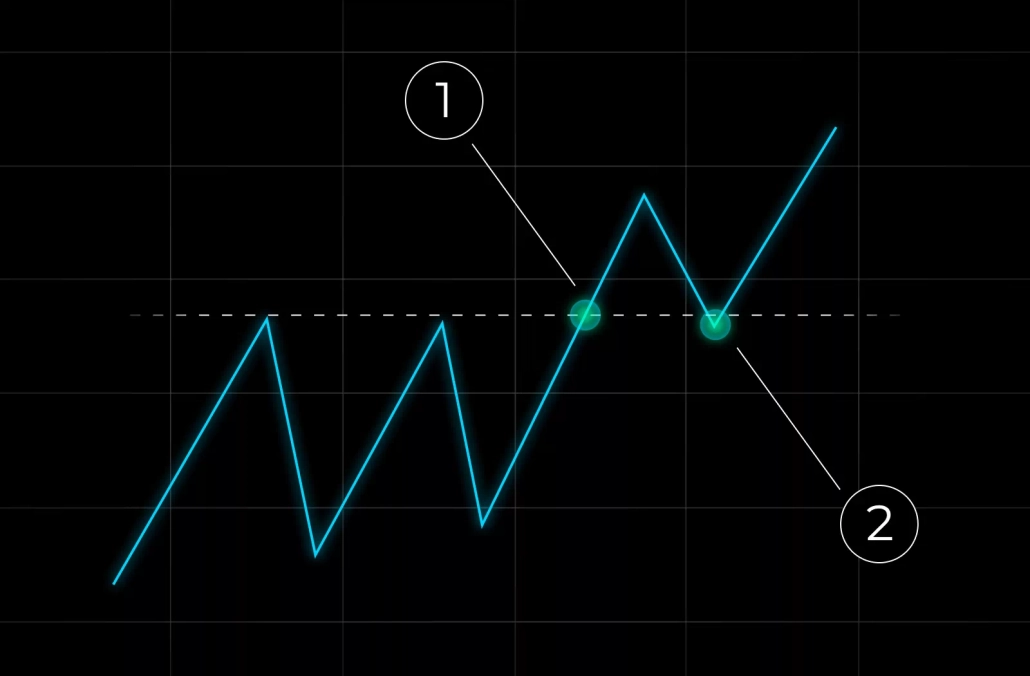
Arrow (1) marks a bullish breakout above resistance, arrow (2) marks the retest.
What Is a Retest in Trading?
A retest is price returning to a level it just broke through. After price breaks through the wall, it steps back to test that level from the other side, then resumes moving in the direction of the original breakout.
It’s precisely the reversal at the retest point that gives a trader a chance to enter with a favorable risk (capped by the breakout level) to reward (with trend-continuation potential) ratio.
Continuation Breakout vs Reversal Breakout
By context, breakouts fall into two types:
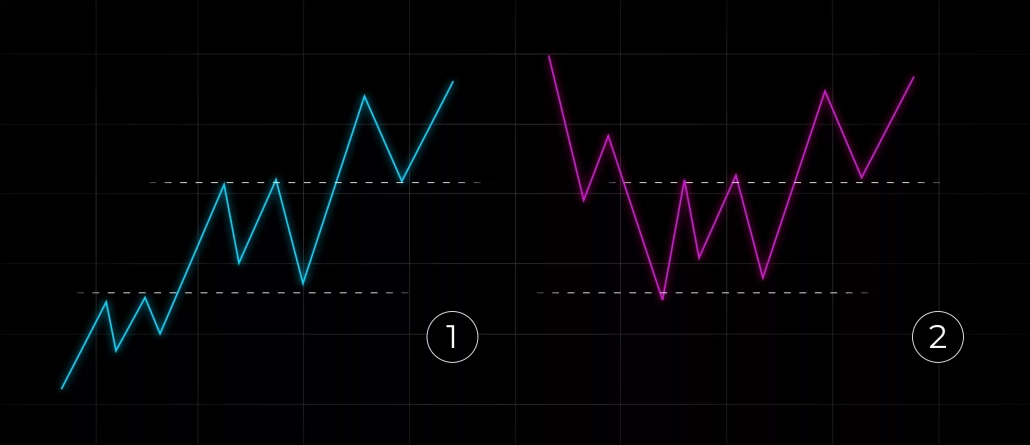
By the angle of the level, breakouts also fall into two types:
- Horizontal-level breakout — the classic case: a psychological price or a prior swing high/low on the chart.
- Angled-level breakout — forms on a trend channel or a triangle.
Why Resistance Becomes Support (and Vice Versa)
The price rise after a retest is usually explained by the interaction of several groups of traders: buyers who entered on the breakout defend their profitable positions and add to them; sellers who shorted from the level close their losing trades — buying to break even; traders who “missed the train” get a second chance to enter at a good price.
From a supply-and-demand angle: the balance that existed before the breakout is no longer relevant. After a bullish breakout of resistance, there usually aren’t enough sellers left at the retest — most market participants now believe in further upside. No sellers, no fuel for a drop.
From a trap angle: a retest can lure traders into it — they short expecting a false breakout, then get stopped out, which accelerates the move. At the same time, the retest pressures buyers who entered on the breakout: instead of growing profits, they see a loss, or close at breakeven right before the real move starts.
These aren’t the only explanations for the phenomenon — deeper footprint analysis can reveal more. But the pattern works, and from here we’ll focus on how to trade it in practice.
Real Breakout vs False Breakout
On a schematic, the pattern looks simple, but on a real, noisy chart a trader faces constant doubt: how do you tell, at the moment of the retest, whether this is the start of a new trend rather than a trap?
Common Retest Problems
- The retest is too shallow (which points to strength in the initial move) or too deep.
- After the retest, price fails to show any meaningful continuation of the original move.
- The breakout turns out to be fully false — price returns back across the level with no hint of continuation at all (more on this in the FAQ below).
Case Study: Failed Retest on ES Futures
- Balance. Price sat in a range between support (S) and resistance (R).
- Breakout. Price spiked above resistance (1) — likely on a news release. A volume spike is often treated as breakout confirmation, but not in this case.
- Retest. Price came back to the breakout level and reversed (2). Long lower wicks on the candles are a classic sign of demand.
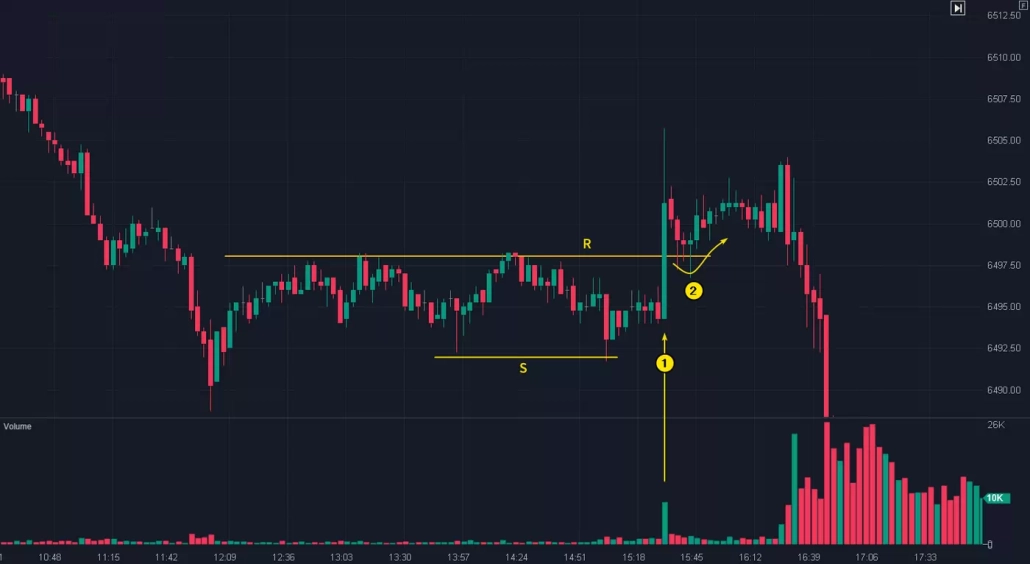
However, after the retest, price failed to develop the original move, and the rest of the US session led to heavy selling.
This example shows why it’s critical to protect a break-and-retest position with a stop and read the broader context:
- On the left side of the chart, price had been falling, so move (1) reads as an intermediate bounce within a downtrend rather than a reversal.
- The high of candle (1) had already reached the projected move based on the height of the R–S range, adding further doubt about upside potential.
Breaks and retests aren’t easy money. What follows are concrete rules, not vague confirmation signals.
How to Trade the Break and Retest Strategy (Step-by-Step)
We’ll bring theory and practice together and lay out the strategy’s rules by combining two approaches:
Step 1. Identify the Level
Find an obvious support or resistance level on the chart — one price has tested several times. It’s usually horizontal, but angled levels work too, sometimes even better. Support and resistance indicators can help here.
Example. The chart below shows an uptrend line (1) that price kept bouncing off. The shift from negative to positive delta, among other signs, confirms the level is acting as support.
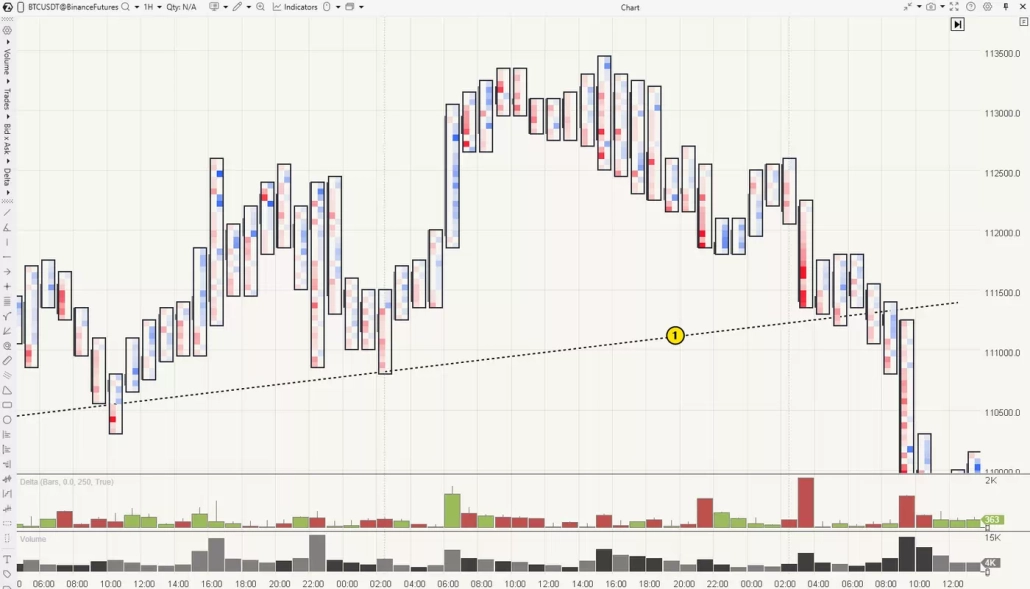
A quick way to spot pattern candidates is the built-in ATAS Breakout and Retest Signals indicator: it automatically highlights moments where a key level breaks and price returns to it. As ATAS’s own documentation notes, this signal doesn’t replace context and volume analysis — it just speeds up finding candidates that still need to be confirmed the way this article shows.
Step 2. Anticipate the Breakout
Classically, a trader waits for a candle to close beyond the level to confirm the breakout. A trader reading the footprint has more options:
- Study the recent context to find grounds for a breakout before it actually happens.
- Study the footprint to see one side building dominance while the other retreats (or resists but fails).
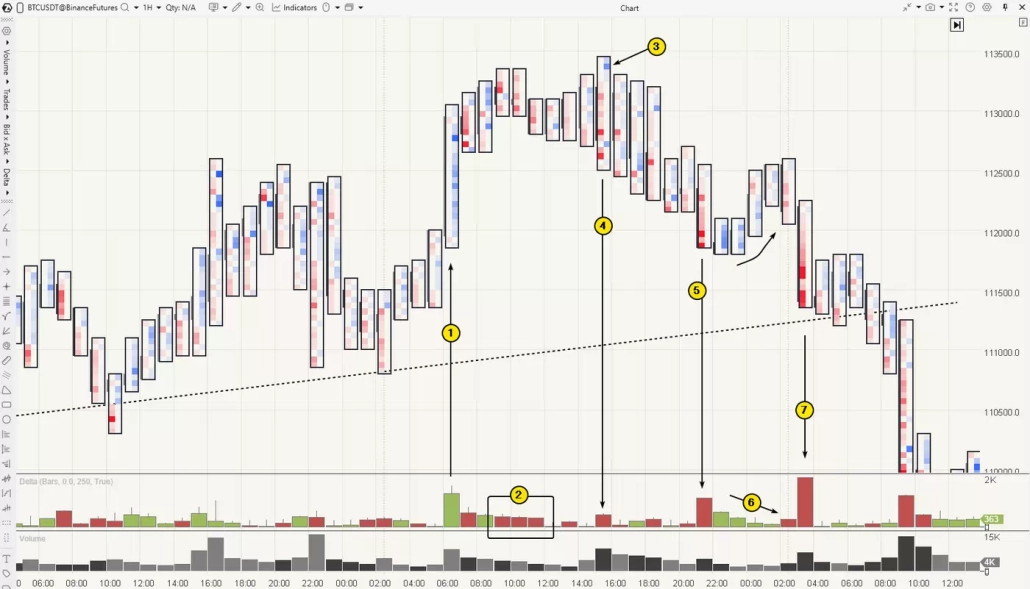
On the chart: (1) an unusually large positive delta spike, typical of a buying climax that ends a rally; (2) sellers step in immediately and halt the rise; (3) buyers get trapped; (4) sellers turn more active; (5) price dropping below a key level triggers the stops of buyers who went long on the FOMO candle; (6) after buyers get liquidated, price usually gets an upward push, but here it’s sluggish and comes with No Demand; (7) sellers grow more aggressive at a key support (the trendline). A bearish breakout is clearly brewing.
Step 3. Confirm the Breakout
Classic technical analysis says a candle needs to close beyond the level to confirm the breakout, then it’s worth waiting 1–2 more candles for price to hold there.
Rising volume confirms a breakout, but advanced volume-analysis techniques add more detail. Evidence that one side has the upper hand includes: a delta spike (clearly positive or negative); a thin profile (a sign of imbalance), paired with accelerating price movement.
Step 4. Wait for the Retest
The trader needs patience again, waiting for price to return to the broken level — keeping in mind this isn’t guaranteed: the strongest breakouts, in practice, often happen with no retest at all.
Classically, the pullback to the level happens on declining volume, but in practice it varies.
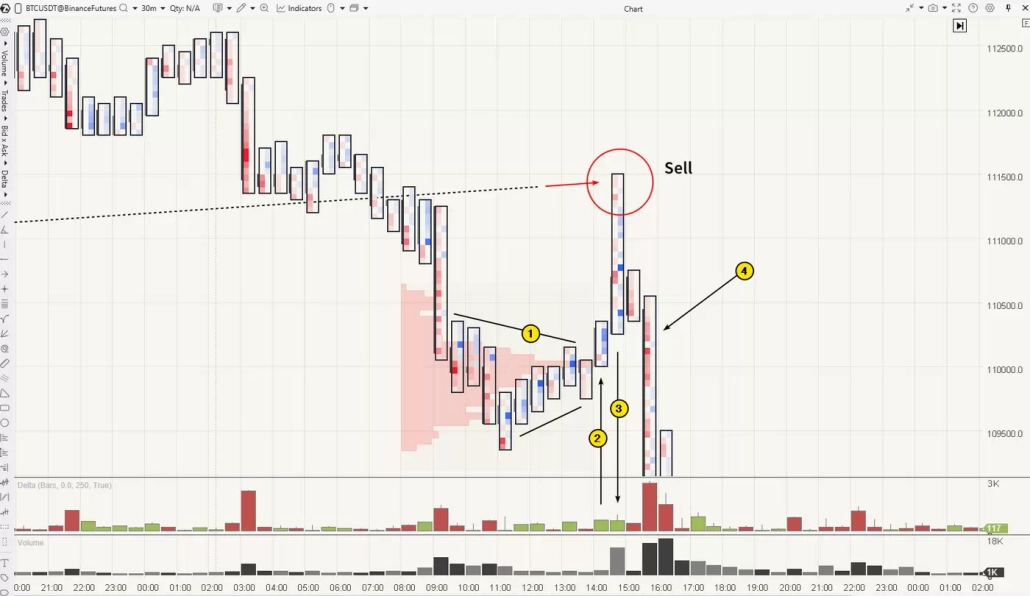
In our example, after a bearish break of a dotted level: price balanced out, forming a triangle (1); bulls then found the courage to break the triangle to the upside, confirmed by a positive delta spike (2), with price reaching the candle’s high (3).
Step 5. Look for Confirmation at the Retest
At the retest level, a trader looks for a reversal confirmation. Classically, that’s a visual candlestick pattern (pin bar, engulfing, hammer) or an indicator signal.
In volume analysis, the focus is on comparing effort (volume) against result (price change). For more timely detection of a shift in sentiment, it helps to drop to a lower timeframe and bring in Order Flow tools — for example, reading order book liquidity through the Heatmap. But even switching timeframes doesn’t always leave enough time to enter at the desired price: strong retests often reverse very fast. That raises the value of limit orders, alerts, and practicing in ATAS Market Replay to sharpen decision-making speed.
Step 6. Enter the Trade
Entry follows confirmation — either a candlestick pattern on a lower timeframe, or a shift in sentiment on the footprint (for example, bright blue clusters that fail to push price higher giving way to bright red ones).
Risk Management: Stop-Loss & Take-Profit
- Simple approach — beyond the boundaries of the reversal formation found on the lower timeframe.
- More advanced approach — beyond the footprint zone where the shift in sentiment between sides is visible.
- betting that the post-retest move will be at least as large as the breakout impulse;
- a mathematical approach — a 1:2 or 1:3 risk-reward ratio;
- a trailing stop — appropriate when pressure in the trend direction stays clear (don’t rush to lock in a quick profit if seller or buyer pressure is still obvious on the footprint).
Break and Retest in Action: Order Flow Case Studies
ATAS tools let you track the effort behind breakouts and retests, and evaluate the result it actually produced.
Quick definitions for the examples below:
Example: Gold Futures (CME)
An hourly gold futures chart, CME data. A typical trading article would describe it like this: “The 3470 level kept swapping roles between resistance and support. The retest after the bullish breakout offered a long entry at point B, and the retest after the bearish breakout offered a short entry at point C. Look for candlestick patterns on lower timeframes to confirm.” Simple enough — but it leaves plenty of questions.
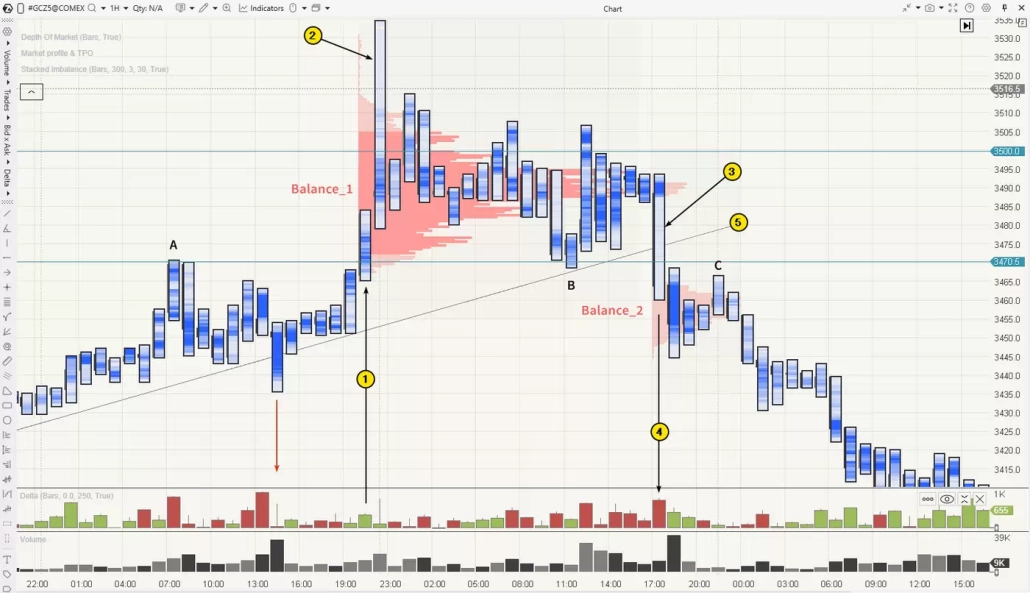
Volume analysis paints a more informed picture:
- The top-to-bottom reversal started at the psychological $3500 level — a detail typical of an FOMO-driven blow-off in trading, where retail traders tend to buy while smart money sells (a Distribution stage under the Wyckoff Method).
- Candle (2) has an unusually wide spread, characteristic of a buying climax.
These observations build the context — a sequential shift through phases: Mark-Up (uptrend) → Distribution → Mark-Down (downtrend). It looks obvious in hindsight; it’s harder in real time, but history tends to repeat.
Key volume-analysis readings add further detail:
- The red arrow on the left shows sellers failing to break the uptrend line, which raised the odds of a bullish breakout of top A.
- On the breakout of top A, the Delta indicator captured market-buyer activity — a sign the breakout was genuine. No surprise, then, that the market found support at the same level again at point B (the breakout got retested).
- The Market Profile shows active trading around the 3490 level (Balance_1): price satisfied both buyers who believed in further upside and sellers taking profit on their longs.
- The key event is a wide candle breaking the uptrend line (5). It shows an imbalance in sellers’ favor (3) — visible in the “thin” profile and aggressive market sells (4) on Delta. This isn’t just a breakout anymore — it’s a signal that control of the market has shifted.
Comparing the two takeaways:
- Plain technical analysis: a bearish break of the 3470 level occurred, and the retest at point C was a reason to consider a short.
- Advanced volume analysis: at the psychological 3500 level, a distribution stage played out, and buyers got trapped as the balance shifted from Balance_1 to Balance_2. That gives grounds to expect a significant downtrend — the short at point C isn’t just a reaction to a local pattern, it’s backed by the profile pointing to the formation of a new balance’s upper edge.
The second read gives a trader far more confidence and understanding of the market situation than the first.
Example: Bitcoin (Binance Futures)
An hourly cluster chart of Bitcoin’s price, Binance Futures data — two instances of the break and retest pattern around a dotted level: A — a short after a support breakout, B — a long after a resistance breakout. Neither pattern can be called a failure, but the outcome hardly matched the expectations of anyone hoping for a big payoff.
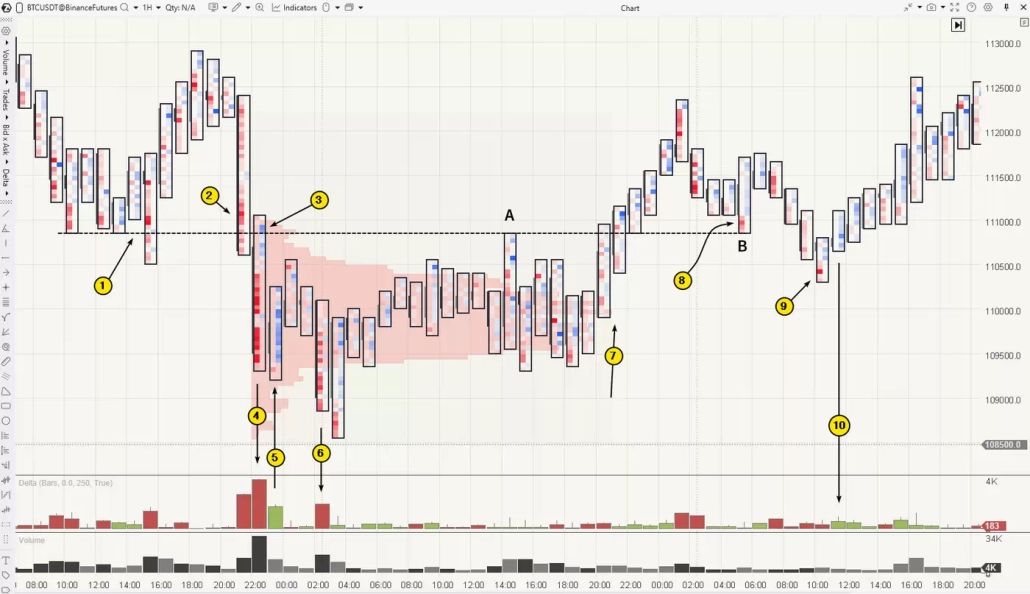
On the left side of the chart, the dotted level acted as strong support (1): sellers’ efforts show up on approach (red clusters), yet price kept reversing upward — except once, when a bearish breakout turned out false.
Sellers regrouped and launched a new attack (2), which succeeded. Buyers (3) were counting on another bounce but got trapped: as price dropped below the dotted level, a sharp spike in market sells appears (bright red clusters and a negative delta spike) with signs of panic. Notably, buyers were already stepping back in on the very next candle (5).
The contrast between candles (4) and (5) points to sellers getting liquidated (a selling climax), and what follows confirms it: sellers tried to resume the move (6), but despite the bright red clusters (effort), price reversed upward and balanced out — the market stopped being bearish.
The retest of the bearish breakout at point A gave enough grounds for a short entry, given the active back-and-forth at the dotted level earlier (1–3). The pattern drove price down to the lower edge of the new balance, where the decline stalled — confirming again that the market was no longer bearish.
Bulls then tried to seize the initiative:
- Breakout. Price broke back above the dotted level.
- Retest. A return to the breakout level at point B. Technically, this is a valid retest-of-breakout pattern: in the background is a selling climax (an early sign of a bottom-to-top trend reversal), and red cluster (8) — a sign the local decline is ending on the lower timeframe — adds further confirmation to buy.
Price did edge up a little, but bulls weren’t willing to push it above 112k, where sellers had been aggressive a few candles earlier. Price dropped again; red cluster (9) is another sign of the local decline ending, this time including stop-outs on long positions opened at the point-B retest. The subsequent pickup in buying (10) drove a more convincing rally.
This example makes two things clear:
- Trading the break and retest strategy doesn’t always go as planned. Textbook examples in popular articles show cherry-picked setups. In reality, a retest can overshoot, undershoot, or never show up at all, and the move after it can disappoint.
- Advanced volume-analysis techniques let a trader act with more insight. Studying supply-and-demand balances and imbalances helps you read the market situation better, understand which side is in control, and see whether that side is actually converting its effort into a matching price move.
This example runs on Binance Futures data, but the break and retest pattern reads just as well on other major crypto exchanges. ATAS offers advanced crypto market analysis — the same Order Flow and volume-analysis toolkit used in this article, working on data from Binance, Bybit, OKX, Bitget, WhiteBIT, and more.
Charting Techniques for Break and Retest
Horizontal vs Angled Levels, Channels, Triangles
Beyond the classic horizontal level (a psychological price, a prior swing high/low), break and retest setups often form on angled structures:
- Trendline or channel — price regularly bounces off an angled line, as in Step 1 of the methodology above.
- Triangle — a narrowing consolidation, as in the Bitcoin example: the pattern balanced inside a triangle before breaking upward.
- Other chart formations are covered in ATAS’s chart and candlestick pattern cheat sheets.
The tools covered in this article — delta, footprint, Market Profile — confirm break and retest specifically for this pattern. If you need additional volume-analysis tools to confirm level breakouts more broadly (not just within this specific pattern) — Stacked Imbalances and Speed of Tape, for instance — see the separate Level Breakouts breakdown on the ATAS blog.
Advantages and Disadvantages of the Strategy
What is break and retest? It’s a classic approach built around entering a trend-direction position from a broken support/resistance level. The strategy can be profitable, but no one can guarantee it.
- Trend-following logic. The strategy is built on the initial move developing into a full trend.
- Clear risk control. The retest gives a clean, logical level to place a stop-loss — beyond the broken zone.
- Works alongside volume analysis. As shown above, Order Flow tools help a trader confirm entries based on objective data, not just the visual pattern.
- A lot of “noise.” On real charts, clean retests are rare: price often overshoots or undershoots, making the entry point ambiguous.
- False-breakout risk. Price may hold beyond the level only briefly, then swing back into the range, running the stops of traders who entered in the breakout’s direction.
- Risk of no retest at all. Price can simply run away without giving even a hint of a retest.
- Subjectivity. Choosing support/resistance levels and validating retest confirmations both depend on trader experience and are a common source of mistakes.
Why We Don’t Quote a Win Rate
Many articles on the break and retest strategy quote a specific win rate (60–70%, say) without backing the number with data. We deliberately don’t do that: real-world performance depends on the market, the instrument, the timeframe, how well false breakouts get filtered out through Order Flow, and the trader’s own discipline. An averaged percentage without that context is more likely to mislead than to help anyone make a decision.
FAQ
The strategy has a sound rationale: a trend-direction entry with clear, limited risk. But as with any strategy, the outcome comes down to execution — telling a genuine breakout from a false one, and disciplined risk management. See “Advantages and Disadvantages” above for more.
We don’t quote a specific percentage — see “Why We Don’t Quote a Win Rate” above.
A breakout in trading is an impulsive price move (usually accompanied by rising volume) that pushes through and holds beyond a previously established support or resistance level. A breakout often signals a shift in the balance of power between buyers and sellers.
There are two main approaches: an aggressive one — entering the moment the level breaks, with a market order; and a conservative one — entering on the pullback to the broken level (the retest), where a limit order can be used. Neither approach is objectively better: the aggressive entry risks catching a false breakout, while the conservative one risks missing the move if no retest comes.
Sometimes, after a strong breakout, price never comes back to the level — it just keeps going (“break and run”). The best move in that situation is to do nothing: trying to “jump on a departing train” usually means entering at a poor price with a bad risk-reward ratio.
The logic of the break and retest pattern holds on any timeframe. But the lower the timeframe, the more market “noise” you’re dealing with. If trading retests is producing a lot of false entries, try moving up to a higher timeframe and use the lower ones for Order Flow confirmation instead.
Trading false breakouts is a counter-trend strategy. A trader waits for price to break a level, and if the move fails to develop, enters in the opposite direction once price returns back across the level.
Conclusion
The break and retest strategy is a classic approach to entering a trend-direction position from a broken support/resistance level. It has real strengths (clear risk management, trend logic) and real risks (noise, false breakouts, missing retests, subjective level selection). No strategy comes with guarantees — the right way to find out if it fits your style is to test it in practice without putting real capital at risk.
To do that, download ATAS and fire up the Market Replay simulator: find a few break-and-retest setups in your history and work through them using footprints and the other Order Flow tools covered in this article. The Breakout and Retest Signals indicator helps you spot candidates on the chart faster, and the volume-analysis techniques covered here help you tell a strong breakout from a manipulation. It’s the best way to find out whether the break and retest strategy fits you.
Information in this article cannot be perceived as a call for investing or buying/selling of any asset on the exchange. All situations, discussed in the article, are provided with the purpose of getting acquainted with the functionality and advantages of the ATAS platform.
Subscribe
Get the latest ATAS news delivered conveniently