NQ futures move fast. By the time you decide to enter a breakout, price may already be back below the level. Candles alone often leave you guessing. Order flow analysis reveals changes in the order book and the trades behind the move.
Most NQ guides cover contract mechanics, while order flow tutorials explain general techniques. This guide brings them together: NQ contract specifications, Footprint charts, the DOM and delta, four trading setups, and a practical process for planning a trade—from identifying an area of interest to calculating position risk.
What Is Order Flow Trading on NQ Futures?
Order flow trading on NQ involves analyzing orders and executed trades in Nasdaq-100 futures to understand how participants affect price. You compare aggressive buying and selling with the resting limit orders they execute against, assessing whether buyers or sellers can push price through a level you are watching.
Start now!
Try ATAS free with no time limit
⚠️ Futures trading involves leverage and carries a high risk of losing capital. Past performance does not guarantee future results. ATAS provides tools for analyzing and visualizing market data — the trader makes all trading decisions, including risk and position-size calculations, independently and at their own risk.
Every trade has both a buyer and a seller. The distinction is who initiates it. An aggressive buyer takes the available offer at the ask; an aggressive seller hits the bid. Resting limit orders fill the other side of each trade.
Suppose NQ drops toward support. Selling continues, but price stops making new lows. This may indicate absorption: resting buy orders are absorbing the selling and limiting further declines. If those sales instead push price lower with little resistance, there is less reason to expect support to hold.
The key is how price responds to the trading activity. Footprint charts show executed volume at each price, while the order book displays resting orders. Together, they help you assess the response to a level. Before considering a long after a decline stalls, look for the next development: can price recover and hold above the local low?
Why Are NQ Futures Ideal for Order Flow Trading?
NQ combines active trading, fast price moves, and a centralized order book on CME Globex. You can compare trades in a specific contract with the available resting orders. This helps you assess breakouts and reversals: how readily price moves through a level, where it meets resistance, and what happens on a retest.
The Nasdaq-100 index itself is a calculated value with no order book of its own. Nasdaq-100 futures have actual orders and traded volume measured in contracts. Use NQ data for this analysis. A similarly named CFD is a different instrument.
Heavy trading does not mean substantial liquidity is available at every price. When resting orders are sparse or get canceled, even relatively modest buying can move price up quickly. With NQ, watch both the size of the trades and how easily they move the market.
| Specification | NQ — E-mini Nasdaq-100 |
|---|---|
| Exchange | CME |
| Notional contract value | $20 × index level |
| Minimum price increment | 0.25 index points |
| Tick and point value | $5 per tick; $20 per point |
| Standard Globex session | 6:00 p.m.–5:00 p.m. ET the following day; Sunday evening through Friday |
| Maintenance break | 5:00–6:00 p.m. ET, Monday–Thursday |
| Margin | Varies with current exchange and broker requirements |
ET is U.S. Eastern Time, which switches between standard and daylight saving time. Holiday schedules may differ.
Margin ≠ trade risk
Margin is separate from trade risk. A 20-point move against your position means a $400 loss per NQ contract before trading costs, regardless of the margin your broker requires.
Core Order Flow Tools for Reading NQ
Reading NQ requires tools that show resting orders, executed trades, and price in relation to the session’s volume distribution. Footprint, DOM, cumulative delta, and VWAP serve different purposes. Use them in sequence: identify an area to watch, examine trading activity as price approaches it, and check whether the move follows through.
Footprint — trades inside each candle. In Bid × Ask mode, you see aggressive selling and buying volume at each price. During fast NQ moves, this reveals details of a level test that a regular candle cannot show: where trades occurred and how far price moved in response. For a closer look, see the anatomy of a Footprint chart.
DOM — the order book. It displays visible limit orders waiting to be filled. Smart DOM lets you compare changes in resting liquidity with executed trades: are sell orders being filled, canceled, or replenished? This distinction matters on NQ, where disappearing offers can accelerate a rally even without a surge in buying volume.
Cumulative delta — the balance of aggressive buying and selling. It tracks the running difference between volume traded at the ask and at the bid. If NQ makes a new high but cumulative delta does not, the rally deserves closer attention. That divergence alone does not confirm a reversal.
VWAP — volume-weighted average price. It shows where the market is trading relative to its average traded price over a selected period, weighted by volume. During a directional NQ move, a pullback to VWAP can be an opportunity to look for trend continuation. Touching the line alone is not enough to justify an entry.
Add a volume profile to identify areas where trading has concentrated. Set the profile’s period and VWAP’s starting point in advance: calculations covering the full Globex session will differ from those starting at the U.S. stock market open.
The Four Order Flow Setups on NQ: Absorption, Exhaustion, Breakout, Rejection
These four scenarios describe market behavior around a selected level. Absorption and exhaustion help explain why a move is slowing. Breakout and rejection describe the outcome of the test: whether price continues trading beyond the level or returns to the previous range. Before entering, follow the full sequence—from the approach to the level through the price response after the test.
Absorption
NQ approaches support. Significant selling volume continues to trade at the bid, yet price makes little further progress lower. This suggests possible absorption: resting buy orders are taking the selling and limiting the decline. For a long entry, wait for price to recover and break a local high formed after the test. Place the stop below the low that held and the target just ahead of the nearest resistance. The Footprint clue is continued selling near support with little additional downside progress.
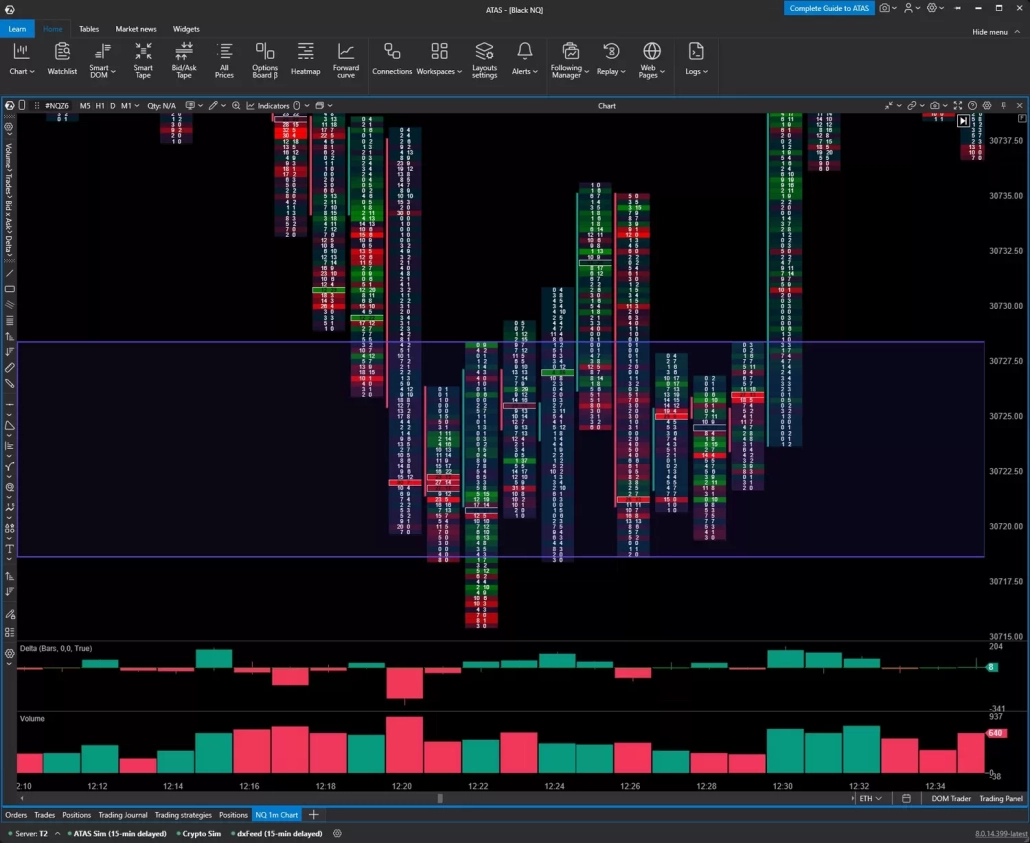
NQ absorption setup on a Footprint chart
Exhaustion
On a return to a previous high, aggressive buying is weaker and the advance slows. Buyers are losing initiative. For a short entry, wait for price to turn lower and break local support. Place the stop above the high and the target near the next demand area. With NQ moving quickly, avoid mistaking a brief pause for exhaustion: reduced buying must be accompanied by a failure to extend the rally.
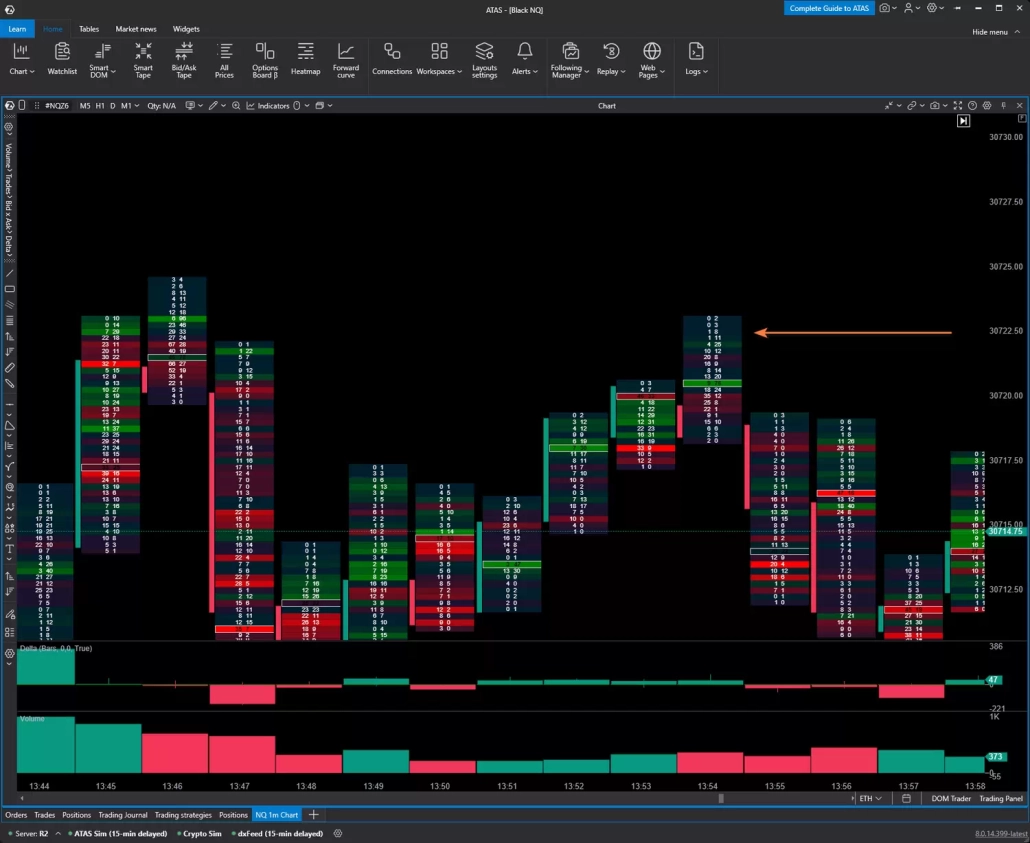
NQ exhaustion setup near a previous high
Breakout
Price breaks through resistance, buying pushes it higher, and the subsequent pullback holds above the broken area. Renewed buying after the pullback provides a reason to consider a long, with a stop below the pullback low and a target ahead of the next resistance. On NQ, watch whether buying imbalances produce follow-through. Highlighted clusters alone do not confirm a breakout if price cannot hold the higher levels.
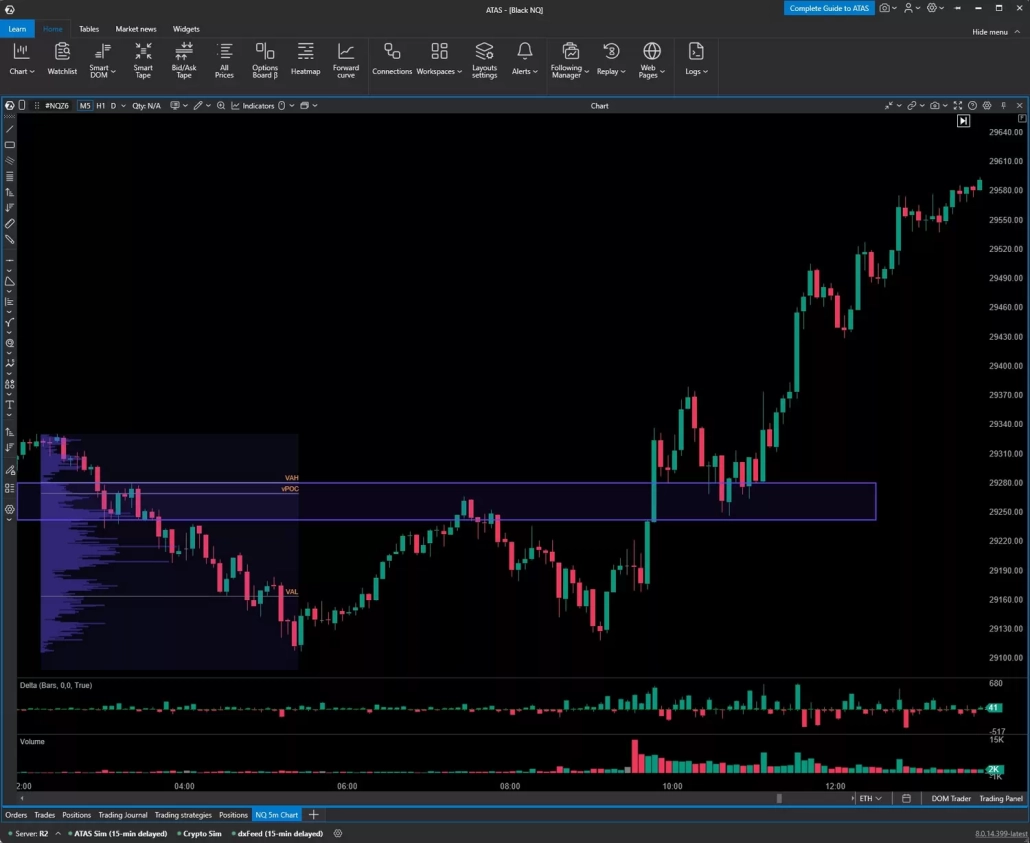
NQ breakout setup holding above broken resistance
Rejection
One example is a failed attempt to hold above a previous high. NQ trades through the level but quickly returns below it. If a retest from below fails and selling resumes, a short becomes worth considering: place the stop above the retest high and the target near support within the previous range. The defining feature is that buying above the prior high fails to sustain the move, and selling brings price back into the range.
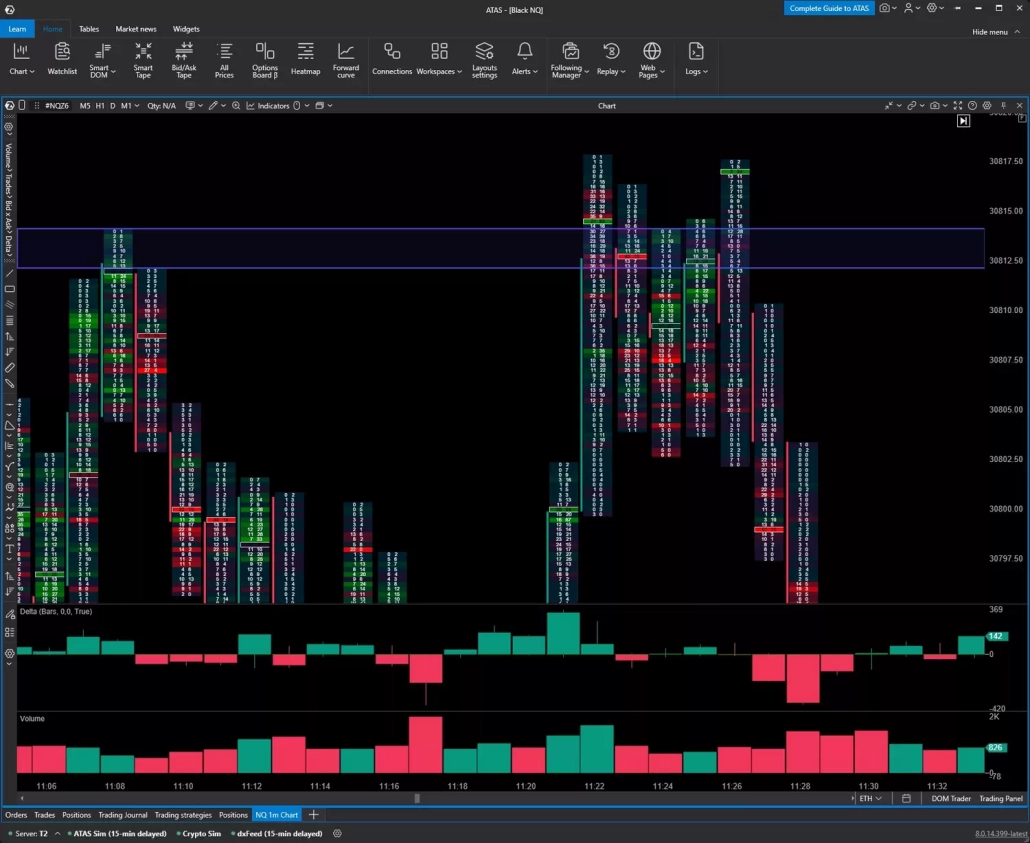
NQ rejection setup after a failed break above a previous high
In all four setups, choose the target using levels visible before entry. If the potential reward is too small relative to the stop distance, skip the trade even when the setup looks clear.
Building an NQ Order Flow Trading Plan (Context, Zones, Volume)
A trading plan connects market conditions, an area of interest, and entry confirmation. Before studying the Footprint, decide where you would consider a trade and what you need to see. This makes NQ’s rapid moves easier to assess: does the activity fit your setup, or are the entry conditions still missing?
Work through five steps when preparing for a trading session:
- Check the day’s events. Note scheduled CPI and employment releases, FOMC decisions, and earnings announcements from major Nasdaq-100 companies. Decide beforehand whether your plan allows opening or holding positions through these events.
- Select areas to watch. Mark the previous day’s highs and lows, the overnight range boundaries, and relevant volume profile areas. Keep only those for which you can describe a potential setup.
- Assess the price action. Buying a pullback in an uptrend and attempting a countertrend short after a new high require different confirmation. Consider price relative to the range and VWAP.
- Wait for confirmation. On a pullback to broken resistance, for example, selling stops pushing price lower, then buying drives it higher again. That sequence gives you observable conditions on which to base a decision.
- Check the trade parameters. Define the entry, a stop beyond the structure supporting your setup, and a target ahead of the nearest opposing area. If price moves without you and the potential reward relative to risk deteriorates, skip the entry.
Write down what would invalidate the setup. For example, a return below the breakout area followed by continued selling undermines the case for that area holding as support.
Practice the plan in ATAS Market Replay. Pause before a potential entry, record your decision, and only then watch what happens next. This helps distinguish evidence available at the time from signals that became apparent only in hindsight.
Risk Management for NQ Order Flow Trading
Size your position using the distance to your stop and your maximum planned loss per trade. First, identify the price move that would invalidate your setup, then convert that distance into dollars. If one NQ contract exceeds your risk limit, consider the Micro E-mini Nasdaq-100 contract (MNQ) or skip the trade. Avoid tightening the stop simply to reduce the dollar amount at risk.
Suppose your account balance is $20,000 and your chosen risk limit is 0.5%, or $100. The setup requires a 12-point stop:
| Calculation | NQ | MNQ |
|---|---|---|
| Value per point | $20 | $2 |
| Risk per contract with a 12-point stop | $240 | $24 |
| Risk for three contracts | $720 | $72 |
One NQ contract already exceeds the limit. With three MNQ contracts, the planned loss at the stop is $72. That leaves $28 for commissions and slippage, but a sharp move could exceed this allowance.
You could require a minimum potential reward of 2R—twice the initial risk—to qualify a trade. With a 12-point stop, the target must be at least 24 points from entry before trading costs. For a long trade, if significant resistance lies closer, do not move the target beyond it just to reach the required ratio.
Evaluate the risk-reward ratio alongside your win rate and trading costs. A 2R target alone does not make a strategy profitable. Set a session loss limit in advance so that repeated entries do not turn into an attempt to win back losses.
NQ vs ES: Which Futures Contract Should You Choose for Order Flow Trading?
Both contracts suit order flow analysis, but their price behavior and dollar value per move differ. NQ generally demands quicker decisions, while ES’s typically deeper order book makes it easier to follow resting liquidity. Choose the instrument that gives you time to assess confirmation and keeps the risk of a technically justified stop within your limit.
| Feature | NQ | ES |
|---|---|---|
| Underlying index | Nasdaq-100 | S&P 500 |
| Minimum price increment | 0.25 points | 0.25 points |
| Tick value | $5 | $12.50 |
| Point value | $20 | $50 |
| Price behavior | Typically sharper swings and wider ranges in index points | Typically smoother movement |
| Order book depth | Generally less resting volume near the market | Generally more resting volume near the market |
These are broad tendencies, not fixed conditions in every session. Liquidity can decline in both markets ahead of news releases. Check the current spread and depth: a tight spread alone does not guarantee that a large order will fill without slippage.
Do not choose NQ solely for its lower tick value. A 20-point stop on NQ represents $400 of risk, while a 5-point stop on ES represents $250 per contract before costs. Compare the same historical periods on both charts: which has clearer responses to levels, how much room does a stop need, and how often does price move away before confirmation?
Common Mistakes in NQ Order Flow Trading
Mistakes start when a single Footprint value becomes a reason to trade, pushing price context and entry conditions into the background. Watch for three habits that can turn your analysis into a search for highlighted clusters:
- Trading every volume spike. NQ’s speed can make an opportunity feel urgent. If you find yourself entering outside your planned areas, pause and state your reason for the trade. “Large buy volume just came through” does not explain why price should keep rising.
- Watching only a short timeframe. A local rally may be a pullback within a broader decline. Before entering, check the higher timeframe and how much room remains before the nearest resistance.
- Treating delta or an imbalance as an entry signal on its own. Positive delta shows that aggressive buying volume exceeds aggressive selling volume, but it does not guarantee a rise in price. If buying continues without a new high, examine why price is stalling before joining the move.
Save a screenshot from the moment you made the decision, along with a brief explanation of the entry, in your trading journal. This helps distinguish a valid trade that lost money from an unplanned trade that happened to win.
FAQ
Order flow covers the submission, modification, cancellation, and execution of buy and sell orders. The order book shows resting limit orders, while the tape and Footprint charts show executed trades. Analyzing them together helps you understand how trading activity relates to price movement.
Yes. Professional traders use order flow to assess liquidity, time executions, and evaluate price responses at key levels. However, not every professional strategy requires it. The tools used depend on the trading objective and time horizon.
NQ orders and trades are concentrated on CME Globex. U.S. stock trading is spread across multiple exchanges and off-exchange venues, so the completeness of the picture depends more heavily on the data source. In either market, understand which trades and orders your platform displays.
You need Level 2 data to analyze order book depth across multiple price levels. Footprint charts and delta use executed trades, requiring tick data with accurate bid and ask volume classification. Before subscribing, check which data is included and how much historical data is available.
You can study order flow from the start, but NQ’s speed makes real-time decisions more demanding. Begin with historical analysis and simulator practice. Before trading live, assess whether the position size and potential losses fit your risk limits. Even the smaller MNQ contract can produce a series of losses.
Conclusion
Order flow analysis helps you test a trading idea by examining what participants do at a selected level and how price responds. With NQ moving quickly, it helps to define the response you want to see beforehand. Changes in the order book and trades inside each candle then give you evidence against which to check your entry conditions.
Start with one setup and review it across several sessions in ATAS. Compare the activity before successful and unsuccessful entries, the signs that recur, and the occasions when confirmation arrives too late. Use those observations to define your own trade criteria and recognize when to pass.
Information in this article cannot be perceived as a call for investing or buying/selling of any asset on the exchange. All situations, discussed in the article, are provided with the purpose of getting acquainted with the functionality and advantages of the ATAS platform.
Subscribe
Get the latest ATAS news delivered conveniently