
An ICT Order Block is a price zone formed around the last opposing candle before a strong directional move. In Smart Money Concept (SMC) trading, traders use Order Blocks to identify areas where significant buying or selling activity may have occurred before price moved away with momentum.
This guide explains what an ICT Order Block is, how bullish and bearish Order Blocks form, how to identify them on a chart, and how traders use retests of these zones as potential entry areas. We will also show how volume, Delta, Volume Profile, and footprint charts can provide additional context when analyzing Order Blocks.
Disclaimer: The ATAS company is not affiliated with Michael Huddleston (Inner Circle Trader) and does not promote or endorse his trading strategies. This article discusses the popular ICT Order Block and Breaker Block patterns and highlights ATAS platform tools that may be helpful for traders exploring the Smart Money Concept.
Start now!
Try ATAS free with no time limit
What Is an Order Block (OB) in Trading?
An Order Block (OB) is a price zone associated with the last opposing candle before a strong directional move. It can be bullish (Bullish Order Block) or bearish (Bearish Order Block) and may appear both at reversal points and within trend continuation.
Although ICT tends to avoid trading cryptocurrencies, his patterns can be applied across any timeframes on forex, stock, and commodity markets.
ICT Order Block Definition
An ICT Order Block is the last opposing candle, or small group of candles, that appears before a strong price move in the opposite direction. In a bullish setup, it is typically the last bearish candle before an impulsive move higher. In a bearish setup, it is usually the last bullish candle before a strong move lower.
The key element is not the candle alone, but what happens after it. Price should move away from the area with clear displacement — a decisive directional move that shows a temporary imbalance between buying and selling pressure. Within the ICT framework, this movement is interpreted as evidence that larger market participants may have been active around the Order Block zone.
The Order Block is then projected forward as a potential support or resistance area. Traders watch for price to return and retest this zone. If a bullish Order Block holds during the retest, traders may look for confirmation of renewed buying pressure. If a bearish Order Block holds, they may look for signs of renewed selling pressure.
In practical terms:
- Bullish Order Block: the last bearish candle before strong bullish displacement; the zone may later act as support.
- Bearish Order Block: the last bullish candle before strong bearish displacement; the zone may later act as resistance.
The retest is important because an Order Block is not treated as a trade signal simply because the candle exists. Traders usually evaluate the subsequent displacement, market structure, liquidity, and reaction when price returns to the zone.
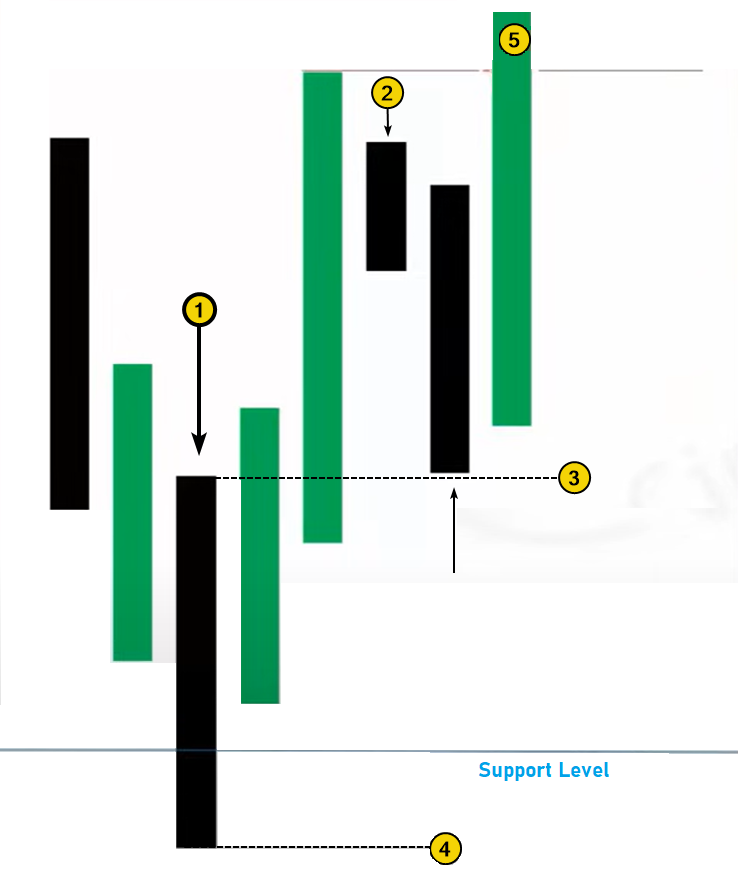
Arrow #1 points to the bearish candle:
- on the left, there is a price decline period;
- then, the price reverses upward from the support level.
An area extending to the right from this candle is called the Order Block.
Types of ICT Order Blocks
The two main types of ICT Order Blocks are Bullish Order Blocks and Bearish Order Blocks. The distinction depends on the direction of the price move that follows the block.
Bullish Order Block
Formed by the last bearish candle before strong bullish displacement. Traders may treat this zone as potential support if price returns to retest it.
Bearish Order Block
Usually the last bullish candle before strong bearish displacement. When price returns to this area, the zone may act as resistance.
Order Blocks can also be classified by the role they play in market structure:
- Reversal Order Blocks form near potential turning points, where the previous directional move loses momentum and price begins moving in the opposite direction. For example, a Bullish Order Block may form near a significant low before a bearish trend reverses upward.
- Continuation Order Blocks appear within an existing trend. Instead of signaling a complete market reversal, they may form during a pullback or consolidation before price resumes moving in the prevailing direction.
This means an Order Block does not always mark the beginning of a new trend. It can appear both at major reversal points and inside an established bullish or bearish trend. For this reason, traders usually evaluate the Order Block together with market structure, displacement, nearby liquidity, and the reaction during a later retest.
How to Trade an ICT Order Block
Trading an ICT Order Block usually involves waiting for the zone to form, confirming that price has moved away from it with clear displacement, and then watching for a retest. The Order Block itself is not an automatic entry signal — traders typically look for additional confirmation that the zone is holding.
A typical trading process includes the following steps:
Step 1. Identify the Order Block. For a bullish setup, look for the last bearish candle before strong bullish displacement. For a bearish setup, look for the last bullish candle before strong bearish displacement.
Step 2. Wait for displacement and confirmation. Price should move decisively away from the Order Block. Traders may also look for confirmation from market structure, liquidity behavior, Delta, Volume Profile, or footprint data.
Step 3. Wait for the retest and entry signal. Instead of entering immediately after the initial move, traders often wait for price to return to the Order Block zone. A long entry may be considered if a Bullish Order Block holds and buying pressure returns. A short entry may be considered if a Bearish Order Block holds and sellers regain control.
Step 4. Place the stop-loss. The stop-loss is usually placed beyond the opposite edge of the Order Block. For a bullish setup, this means below the zone; for a bearish setup, above it.
Step 5. Set the take-profit target. Potential targets may include a recent swing high or low, a liquidity area, or another significant support or resistance level. Traders often prefer setups where the potential reward is greater than the amount at risk.
Step 6. Define invalidation. An Order Block is generally considered invalid if price breaks through the zone decisively and fails to react as expected. A failed Order Block may later develop into a Breaker Block, which is discussed further in this guide.
| Setup | Bullish Order Block | Bearish Order Block |
|---|---|---|
| Order Block candle | Last bearish candle before bullish displacement | Last bullish candle before bearish displacement |
| Expected role | Support | Resistance |
| Entry logic | Retest of the zone + bullish confirmation | Retest of the zone + bearish confirmation |
| Stop-loss | Below the Order Block | Above the Order Block |
| Take-profit | Previous high, liquidity target, or resistance | Previous low, liquidity target, or support |
| Invalidation | Decisive break below the zone | Decisive break above the zone |
The exact entry should depend on market context rather than on the Order Block alone. Market structure, displacement strength, nearby liquidity, and the reaction during the retest can all help distinguish stronger setups from weaker ones.
Example of a Bullish Order Block on a Real Chart
In the screenshot below, from the official Smart Money Concept YouTube channel, Michael Huddleston demonstrates an example of his Order Block pattern on the U.S. Dollar Index futures chart.

The numbers indicate:
(1) a support level from a key low on the left.
(2) a bearish candle, from which the Bullish Order Block zone extends to the right after two black candles. In this case, the upper boundary of the zone is drawn from the candle’s opening price, although some sources allow the upper boundary to be drawn from the candle’s high.
(3) a candle entirely above the Order Block zone, which acts as confirmation.
(4) a long entry signal is generated when the price dips into the Bullish Order Block zone.
For more examples of identifying Order Blocks, check out this video on Smart Money Concept on our channel:
Next, we will explore why Order Blocks work and provide more examples of trading using Order Block signals, with explanations on footprint charts.
Why Do Order Blocks Work?
Let’s say you are a Smart Money trader and are confident that the price of an asset will rise soon for several reasons, such as:
- insider information suggests that upcoming economic news will be bullish;
- analysts believe the asset is currently undervalued.
You decide to open a long position, but there is a problem: you are dealing with large volumes. If you place a large buy order at market price, it will push the price higher, which is not profitable for you.
Therefore, you need a downtrend (liquidity from sellers) that you can “meet” with your limit buy orders (Order Blocks). This increases your chances of opening a large long position near the price low. Buying at lows and selling at highs is the typical strategy used by Smart Money participants.
As Tom Williams, the creator of the VSA strategy, often said: professionals always buy during downtrends and sell during uptrends. You can learn more about this in our series of articles on Volume Spread Analysis, with the first one available here.
How to Identify an Order Block Using Volume Indicators
Although Michael Huddleston (aka ICT) does not use additional indicators in his trading, we will show how tools like the vertical volume indicator (including the delta indicator) and the market profile indicator can provide valuable confirmations when trading Order Blocks.
Example: The screenshot below shows a Bullish Order Block and a Bearish Order Block on a 15-minute chart of the euro futures:
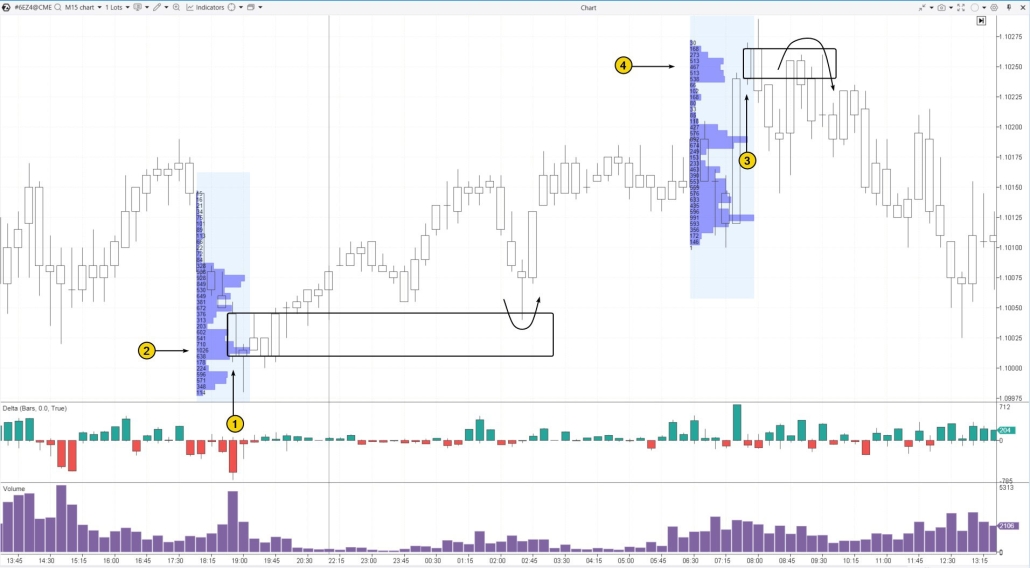
The first Order Block is bullish. It formed as the price dropped to the support level near the psychological level of 1.10000.
Number 1 marks the bearish candle from which the Order Block support zone extends to the right (highlighted by a rectangle). Note the spike in negative delta: it suggests that retail traders were actively placing sell market orders. However, the market profile shows a (2) bulge — what might this indicate? Perhaps the presence of a cluster of Limit-Buy orders holding the price from falling? It is reasonable to assume these were better-informed professionals (Smart Money), building long positions with limit buy orders.
The subsequent price rise confirmed the bullish pattern, and the test of the Order Block zone at the 02:30 candle (shown by the arrow) could have been used to enter long positions.
The following day, a second Order Block emerged, this time a bearish one. It formed from the candle marked as (3). It is important to note that, at this chart scale, the resistance level is not clearly defined. However, we can find confirmation through the following indicators:
- the bulge on the profile (4) indicates executed Sell-Limits placed by Smart Money participants, capitalizing on the price surge during the 07:30 candle;
- the subsequent price decline over the next two candles below the Order Block area.
The arrow highlights the price returning to the Bearish Order Block, which could have been used to open short positions.
How to Trade Order Blocks Using Footprint Charts
Footprint charts (also known as cluster charts) are one of the most informative tools available to traders, allowing for an in-depth analysis of market participants’ actions. In the context of the Smart Money Concept, footprint charts not only help identify Order Blocks but also visually illustrate how events unfold during the formation of these patterns.
Before we delve into examples of trading Order Blocks using footprint charts, let’s summarize the trading rules for this pattern.
Bearish Order Block on the Footprint Chart
The screenshot below demonstrates an example of a Bearish Order Block that formed in early October 2024, using data from the futures market for BNB on Binance Futures.
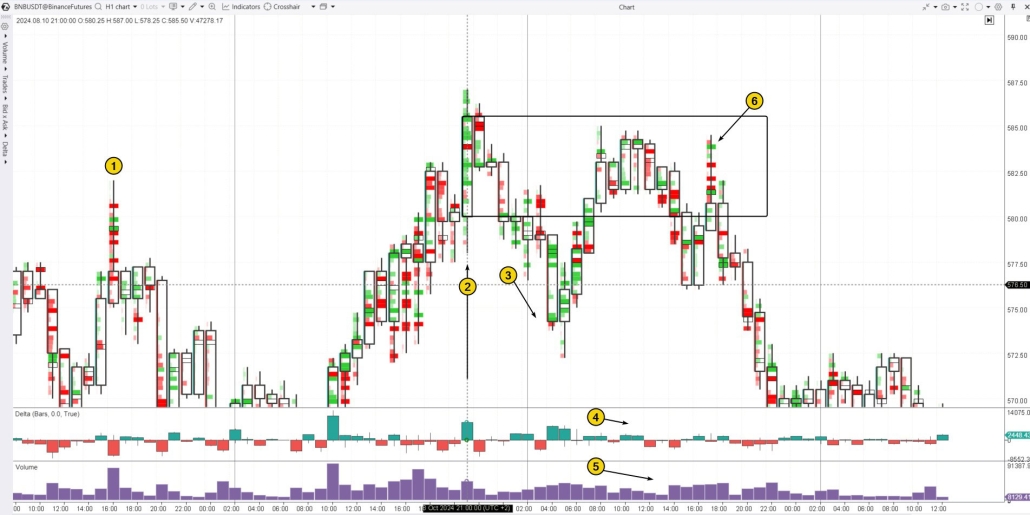
In the chart, the local peak is indicated by (1), which represents the current resistance level. To the left (not visible due to the selected chart scale), there is another peak at approximately the same level.
During the attempt to break above peak (1) on candle (2), we observe a spike in positive delta, signaling buyer activity that interpreted the price action as the start of a new bullish trend. The clusters within the candle are almost entirely green, which could also reflect an “emergency” closing of short positions, either manually or via stop-loss orders.
However, despite this market buying activity, the price subsequently declines (3). Why? The surge in market buys creates the necessary liquidity for Smart Money participants to execute their large-volume limit sell orders. As a result, we have the basis to:
✔ create a Bearish Order Block resistance area to the right of candle (2);
✔ open a short position when the price retraces back to the marked area the following day.
Analyzing vertical volumes provides greater confidence for entering short positions. Market buying activity (4) has diminished, and overall volumes are declining, indicating a lack of participants willing to pay such high prices for BNB.
This scenario represents a classic pattern known as a bull trap, or upthrust in VSA terminology (6), which often signals the beginning of a price decline.
Bearish Order Block on AAPL Stock Price Chart
In the summer of 2024, a sell setup based on the Order Block pattern emerged on the daily chart for Apple (AAPL) stock:
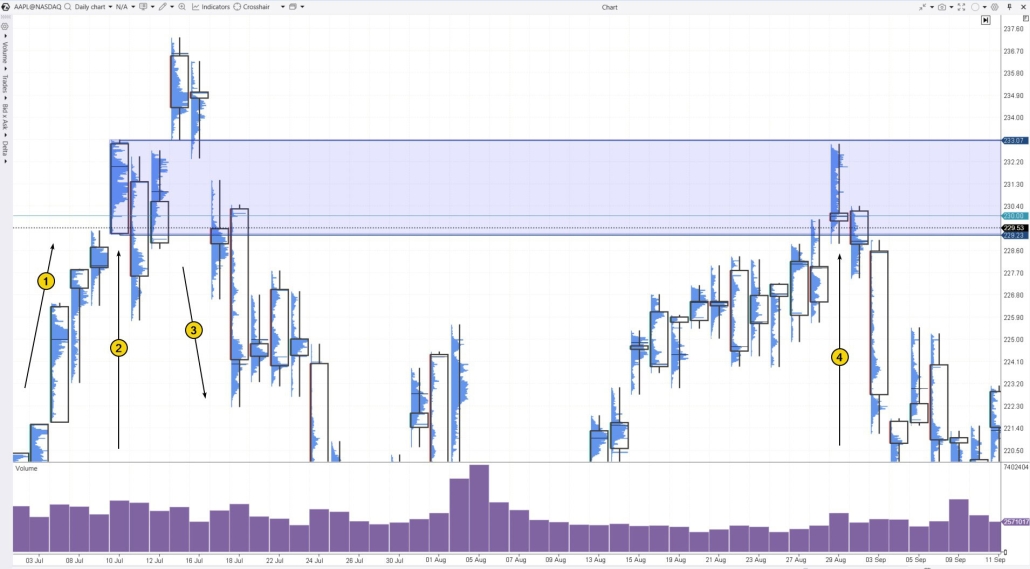
Following the announcement of Apple Intelligence on June 11, sentiment turned extremely bullish: AAPL shares broke through the psychological barrier of $200 and continued to rise (1), reaching new all-time highs until hitting $230.
It is important to note the candle on July 10 and its profile, as well as the significant decline of the July 11 candle, which closed well below the $230 level. This can be seen as a temporary surge in demand on July 10 that quickly faded the following day.
On July 15, the price soared above $235 after Morgan Stanley raised its target price for the stock, and Market Watch reported that the price could potentially reach $300. These positive headlines created a wave of enthusiastic demand, but… who sells at the top when the market is filled with such obvious optimism? Smart Money.
Following ICT rules, the resistance area of the Bearish Order Block can be extended to the right after the price declines (3). The test of this area on August 29 (4) offered a chance to enter a short position. This opportunity was reinforced by the candle’s shape, which resembled an inverted hammer and closed below the trading activity level identified in the profile. It seems that Smart Money still considered $230 to be too high for AAPL.
Example of a Breaker Block
What is a Breaker Block in trading? It is a situation when an Order Block area does not lead to a price reversal and the price breaks through it instead.
According to Smart Money Concept rules, this happens as follows:
- a Bullish Order Block forms on the chart;
- when the price tests this support zone, instead of reversing upwards, it breaks below;
- in this case, the Bullish Order Block turns into a Breaker Block, and it is expected to act as resistance.
This concept is similar to the idea of mirror levels in trading: previous support becomes resistance after a breakout, and former resistance turns into support. In the same way, a Bearish Order Block, when broken to the upside, transforms into a Breaker Block and may later provide support.
An example of a Breaker Block is shown below on the daily chart of QQQ, a financial instrument that tracks the Nasdaq index.
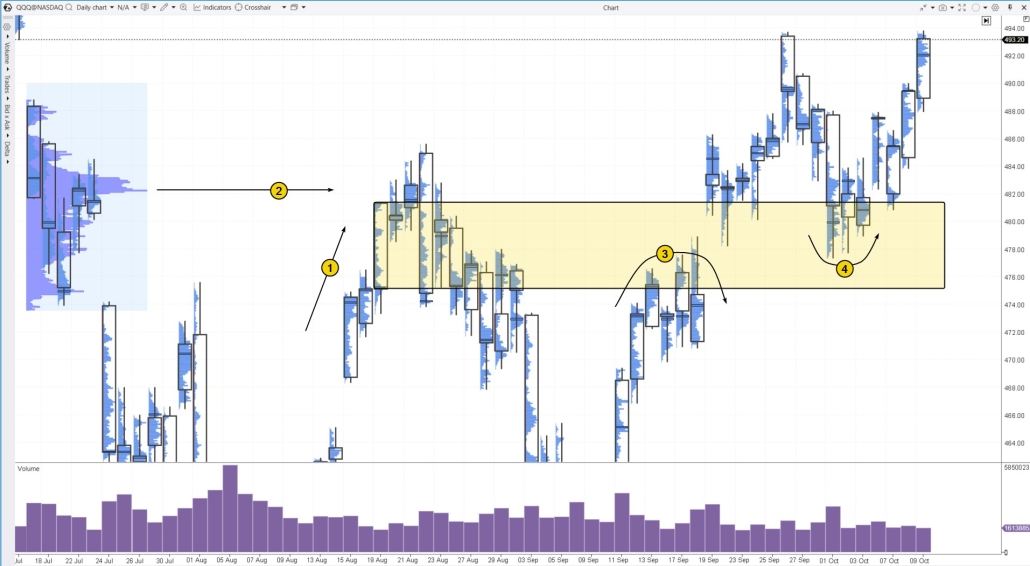
In mid-August (1), the price was approaching a resistance level (2), which could be identified by the bulge on the volume profile. On August 20 and 21, the vertical volumes were low during the price’s upward move (indicating weak buyer activity), but on August 22, a noticeable price drop occurred with increasing volume — a clear sign of sellers stepping in and shifting market sentiment.
As the price moved lower in early September, it created the foundation for a bearish Order Block zone (highlighted in yellow), setting up an expected test.
By mid-September, the price started to show signs of a bearish reversal (3) from this resistance zone, but the attempt failed when the September 19 candle opened above it. This indicated that the yellow zone had turned into a potential Breaker Block. At this point, the next step was to wait for the candles to fully settle above the zone, which happened on September 25. Following the ICT Smart Money Concept rules, the yellow area was now expected to act as support.
This expectation was fulfilled in October when the price made a bullish reversal (4) during the test of the Breaker Block zone.
Common ICT Order Block Mistakes
Identifying an Order Block on a chart may look simple, but not every opposing candle creates a meaningful trading zone. Many weak setups result from analyzing the candle in isolation instead of considering displacement, market structure, liquidity, and the broader trend context.
Here are some common mistakes traders make when working with ICT Order Blocks:
1. Treating Every Opposing Candle as an Order Block
A bearish candle before a price increase is not automatically a Bullish Order Block, just as every bullish candle before a decline is not necessarily a Bearish Order Block.
A stronger setup should be followed by clear directional displacement and fit the surrounding market structure. Without a decisive reaction away from the candle, the zone may simply represent normal price movement rather than a meaningful Order Block.
2. Ignoring the Higher-Timeframe Bias
An Order Block should not be analyzed independently of the broader trend. A bullish setup that appears inside a strong higher-timeframe downtrend may have less significance than one aligned with bullish market structure.
Before using a lower-timeframe Order Block for an entry, traders can check the daily, 4-hour, or other relevant higher timeframe to understand the prevailing direction and important support, resistance, and liquidity areas.
3. Entering Without Clear Displacement
The strong move away from an Order Block is one of the key elements that gives the zone context. If price slowly drifts away or remains in consolidation, there is less evidence that a meaningful imbalance has developed.
Look for clear displacement: decisive candles moving away from the zone, preferably accompanied by a change in market structure or other confirmation of increasing directional pressure.
4. Ignoring FVG and Market Structure Shift
Order Blocks are often analyzed together with other Smart Money Concept elements rather than as isolated signals. A Fair Value Gap (FVG) created during the impulse may help confirm that the move involved a significant imbalance, while a Market Structure Shift (MSS) can indicate that price behavior has changed in the expected direction.
The absence of these signals does not automatically make every Order Block invalid, but combining several forms of confirmation can help filter weaker setups.
5. Drawing the Order Block Zone Too Wide
Extending an Order Block across an unnecessarily large price range makes the setup difficult to use. It can produce imprecise entries, oversized stop-loss distances, and unclear invalidation points.
The zone should be based on the candle or candle range that actually precedes the displacement. Traders should use a consistent method for marking its boundaries rather than expanding the area simply to include later price reactions.
6. Placing the Stop-Loss Too Close to the Zone
Price can briefly move through part of an Order Block during a retest before reacting in the expected direction. A stop placed directly on the zone boundary can therefore be triggered by normal price volatility.
Instead, the stop-loss should reflect the point at which the trading idea is genuinely invalidated. For a Bullish Order Block, this is generally beyond the relevant low; for a Bearish Order Block, beyond the relevant high. The appropriate buffer depends on the instrument, volatility, timeframe, and overall risk-management plan.
The main takeaway is that an ICT Order Block should be treated as an area of interest, not as a standalone buy or sell signal. Higher-timeframe context, displacement, market structure, liquidity, FVGs, and the reaction during the retest can all provide additional evidence before a trade is considered.
FAQ
Order Block (OB) in trading refers to a zone where major market players (institutional investors) place large buy or sell orders, which can either halt or reverse the current trend.
✔ Bullish Order Block is formed from a bearish candle before strong bullish displacement and may later act as support.
✔ Bearish Order Block is formed from a bullish candle before strong bearish displacement and may later act as resistance.
Depending on their position in market structure, Order Blocks may function as reversal or continuation Order Blocks. A Breaker Block is a related setup that can form after an Order Block fails and price breaks through the zone.
In both the cryptocurrency and forex markets, a Bullish Order Block is a zone extending from a bearish candle that closes near its low, followed by an upward price reversal (though this might not happen right away). A Bearish Order Block works the opposite way.
Order Blocks help traders identify key support and resistance areas. Traders use them to open positions when the price tests these zones.
They help traders align in the same direction as Smart Money.
Trading based on Order Blocks can be profitable if these zones are correctly identified and the market context is taken into account. The key to a successful strategy is understanding where institutional players place large orders. Tools like market profile, footprint charts, and other ATAS volume analysis indicators can be helpful in this process.
Both concepts are part of the Smart Money Concept. The difference is that Order Blocks focus on price reversals driven by Smart Money activity, while a FVG (Fair Value Gap) refers to an impulsive price movement caused by an imbalance between buyers and sellers. For more details, check out the article: What Is a Fair Value Gap and How to Trade It?
Not exactly. Support and resistance are broader concepts, and Order Block zones are a more specific example within that framework.
How to Learn Trading with Order Block Patterns
When viewing the Order Block pattern as a candlestick formation, beginners often encounter several challenges in practice:
✔ the zones can be either too narrow or too wide;
✔ Order Blocks may appear infrequently, especially on daily timeframes;
✔ there is the risk of false signals, as candle sequences that resemble the ICT Order Block pattern might form on the chart without indicating actual Smart Money activity.
This highlights the importance of using additional volume analysis tools for confirmation.
To see if you can trade Order Block patterns profitably, try the ATAS Market Replay simulator for traders. This module of the ATAS platform uses historical data to recreate real-time trading conditions. Therefore, you can practice without any financial risk and learn to trade various strategies, such as the ICT Fair Value Gap pattern.
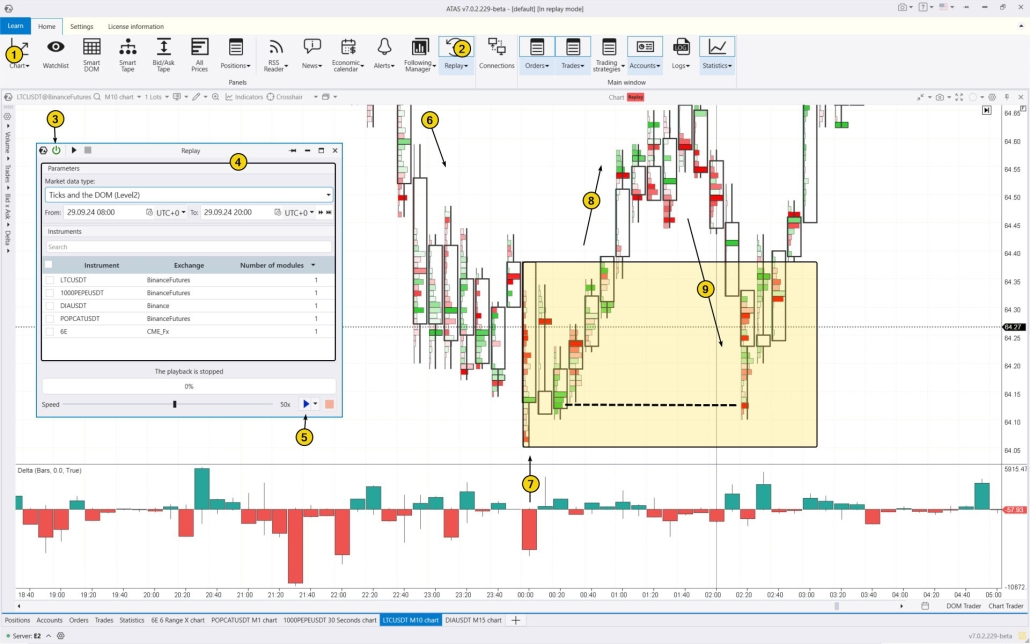
To try the simulator, download the ATAS platform for free, install, and launch it, and then:
- Open a chart of a financial instrument.
- Click on the Market Replay button in the main ATAS menu.
- Activate the Replay mode (the icon should turn green).
- Adjust settings if needed (date and data type).
- Start the playback and monitor when an Order Block appears on the chart to open a position during its test.
In the Litecoin chart example below, the price starts in a downward trend (6), but by 23:00, the bearish momentum begins to slow down. A spike in selling activity is marked by number (7) on the candle, from which the yellow Order Block area is drawn. The subsequent price increase (8) validates this area and sets the stage for a test that occurs and proves successful, as the price surges after a decline (9), remaining above the Order Block area.
There is an interesting detail. At the lowest point of the test on the 02:20 candle, there is a bright red cluster at the same level where there were previously bright green buying clusters (some long positions were probably closed at break-even).
When practicing trading patterns in the Market Replay simulator, you can:
- adjust the playback speed, and pause;
- analyze footprint charts;
- use over 400 indicators, for example, the Market Profile can help you identify an Order Block pattern;
- use Chart Trader and other features to trade on the Replay built-in demo account, and then analyze your performance;
- use drawing objects, for example, mark support and resistance levels;
- use exit strategies;
- do a lot of other things to learn how to effectively use the imbalances between buys and sells.
ATAS enables you to load tick-by-tick data from cryptocurrency, stock, and futures markets, providing a comprehensive basis for analyzing price and volume interactions. This helps identify patterns when studying ICT Smart Money Concept trading strategies.
Conclusions
The Order Block pattern was described and popularized by American trader and analyst Michael Huddleston, who is better known as The Inner Circle Trader (ICT). He runs a popular YouTube channel where he promotes his Smart Money Concept, which includes the Order Block pattern.
What Are the Advantages of an Order Block?
✔ Using Order Blocks helps traders gain a better understanding of market structure and price dynamics, as the strategy focuses on analyzing the intentions of major players (Smart Money).
✔ Order Blocks offer the opportunity to enter a trade before the trend starts.
✔ They naturally complement volume analysis, providing strong confirmations of Smart Money activity.
What Are the Risks Associated with the Order Block Strategy?
✘ The pattern can sometimes be false. A breakout of an Order Block may lead to the formation of a Breaker Block, which can also be a false signal.
✘ Successfully trading Order Blocks requires experience and skill in assessing market context to understand the intentions of Smart Money players, which can be challenging for beginners.
✘ Since candlestick formations are used to identify and trade Order Blocks, nuances related to timeframes and the positioning of OHLC prices can complicate the analysis.
Download ATAS. It is free. Once you install the platform, you will automatically get the free START plan, which includes cryptocurrency trading and basic features. You can use this plan for as long as you like before deciding to upgrade to a more advanced plan for additional ATAS tools. You can also activate the Free Trial at any time, giving you 14 days of full access to all the platform’s features. This trial allows you to explore the benefits of higher-tier plans and make a well-informed purchasing decision.
Information in this article cannot be perceived as a call for investing or buying/selling of any asset on the exchange. All situations, discussed in the article, are provided with the purpose of getting acquainted with the functionality and advantages of the ATAS platform.
Subscribe
Get the latest ATAS news delivered conveniently