Analyze the Market in Real Time

Classic indicators show what has already happened. ATAS indicators show what’s happening right now.

ATAS works with real-time tick data and answers questions that standard technical analysis leaves open:

Why did the price stop at this level? — Depth of Market (DOM) indicators show where a large limit order is genuinely resting, and where a level isn’t backed by real volume.

False breakout or the start of a trend? — Delta and imbalances help you gauge the real strength of buyers or sellers right at the moment of the breakout.

Who holds the initiative right now? — Order flow indicators highlight the imbalance between aggressive buyers and sellers on every tick.

Where do you look for a large player’s footprint? — Cluster Search highlights clusters with abnormal volume, helping you find zones worth deeper analysis faster — instead of acting on assumptions.

What’s real aggression and what’s just noise? — The Big Trades indicator filters out market noise and highlights only large, aggressive trades.
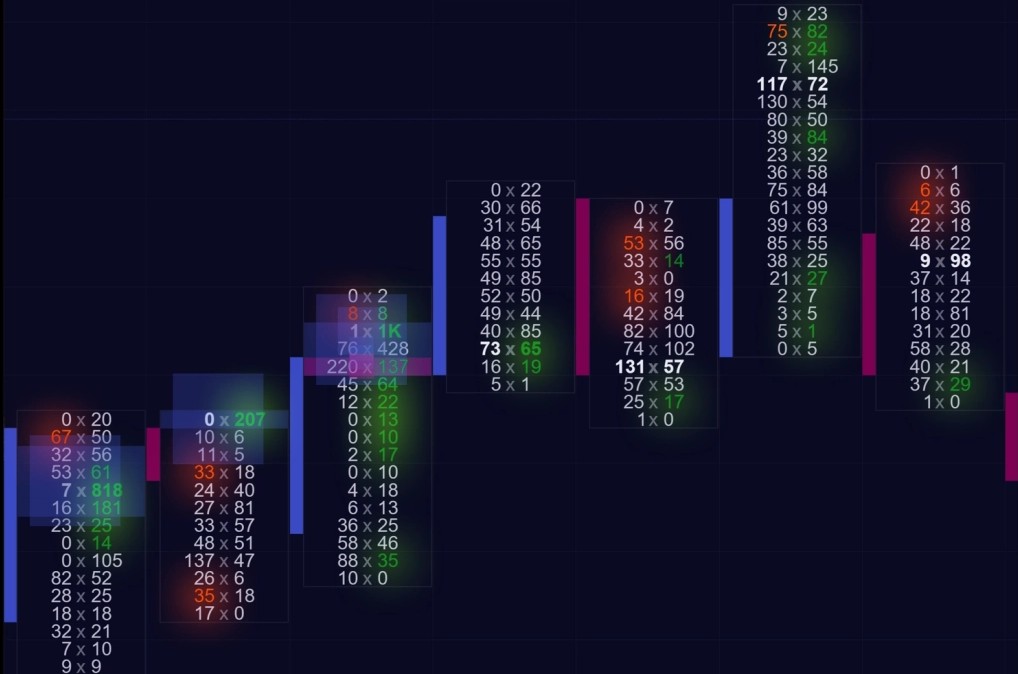
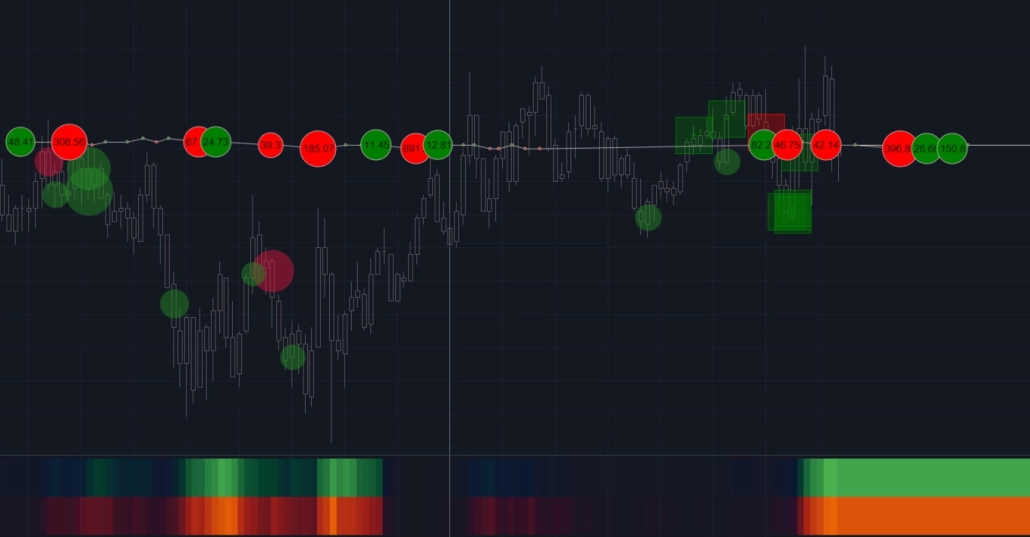
Moving averages, RSI, MACD — these tools are built on a candle's finished parameters: open, close, high, low, and the weighted average. Technical indicators can't “see” what happened inside the candle: who was driving the aggression, where volume actually concentrated, and why the price reversed at that exact point. That means their readings lag — they only form once the move has already happened.
ATAS indicators bring classic technical analysis and advanced volume-analysis tools together in one ecosystem — the market becomes more transparent, and your decisions more grounded in data instead of intuition.

How ATAS Indicators Work

ATAS indicators don’t work with pre-formed OHLC candle parameters — they work with the “live” exchange data feed: the price, volume, and direction of every tick.

Data is processed instantly and recalculated with every new trade, with virtually no delay, lag, or loss of precision on any timeframe.

What this gives you in practice:

  • Real-time reaction. The indicator’s value changes right inside the candle on every new tick, not only after it closes.
  • Accuracy on any chart. Whether you’re on classic time-based charts or non-standard Renko, Range, and Reversal charts, the calculations stay precise on any chart type.
  • Flexible filters. Adjust periods, volumes, and indicator sensitivity to cut out market noise. Adapt the visual display to your strategy.
  • Triple confirmation. Combine volume, order flow, and classic technical analysis on a single chart to see the full picture.

One tick data stream — dozens of indicators calculating their metrics in parallel, in real time.

Volume and Order Flow Indicators

A standard candlestick chart only shows the result of a price move — what has already happened. It’s like trying to understand how a football match played out by looking only at the final score on the board: the outcome is clear, but all the drama, tactics, and effort behind it stay off-screen.

ATAS’s volume and order flow indicators show the actual cause of the price move — the real-time battle between buyers and sellers. Instead of static candles, you see the dynamics: who’s aggressively hitting the market right now, at which levels large players have placed passive defense (limit orders), and the exact moment one side runs out of strength.

Below are the tools that help you read the market from the inside — from pinpoint microstructure analysis to the overall daily volume distribution.

Order Flow Indicator
Indicators Order Flow - indicators for traders in ATAS

The trade tape, right on your chart

An alternative to the print tape (Smart Tape) for those who prefer to take in information visually rather than as a table.

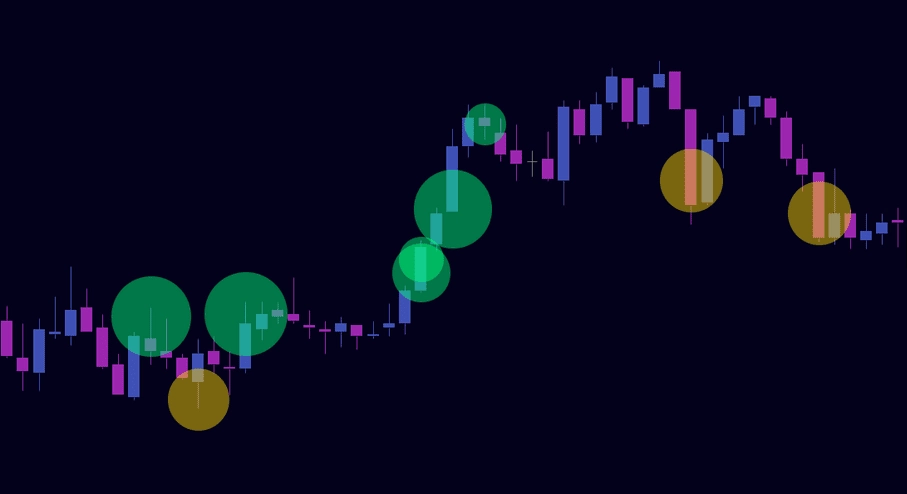
The indicator displays the flow of executed trades right on the chart:

  • Intuitive visualization: every trade is drawn as a colored circle or diamond — the bigger the marker, the bigger the volume;
  • Noise filtering: hide small trades and focus only on the volumes that matter for your strategy;
  • Aggregation: group small trades into a single element so the screen doesn’t get cluttered.

Cluster Search
Cluster Search - indicators for traders in ATAS

Find footprint patterns

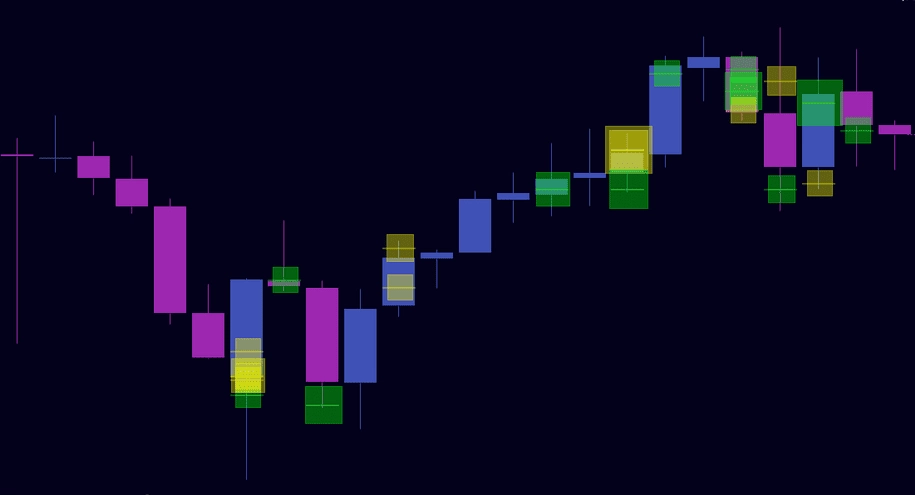
A powerful scanner that searches for volume anomalies across a wide range of user-defined parameters.

  • Search by any criteria: bids, asks, volume, delta, trade count, and time — you decide which clusters to highlight.
  • Market context: search for patterns tied to candle direction or distance from extremes.
  • Time filter: adapt your settings to changing activity within the trading session.

Cluster Statistic
Cluster Statistics ATAS features - Order Flow

Look inside the candle

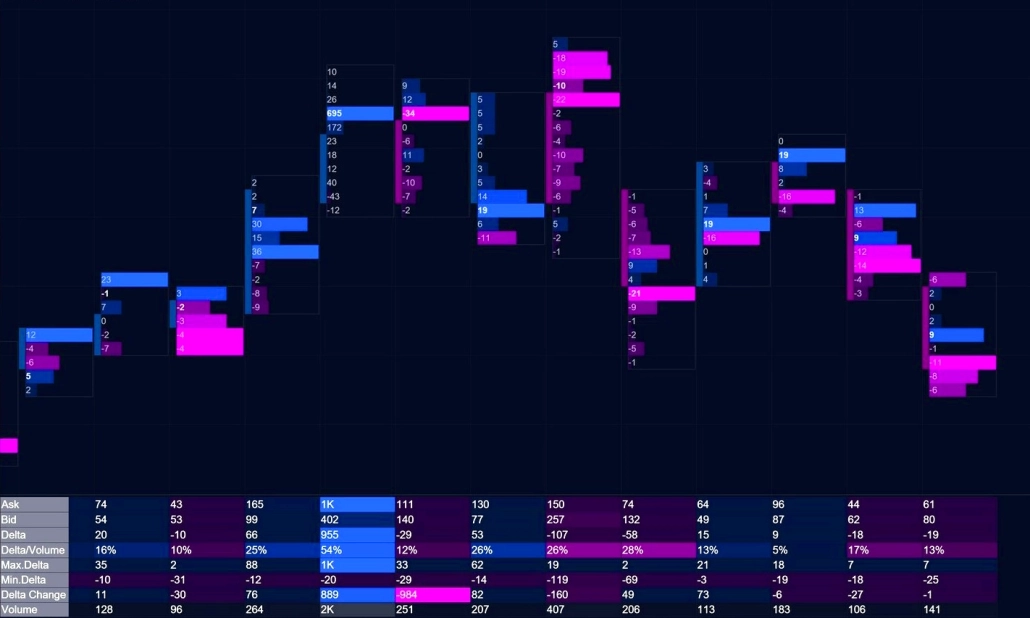
An X-ray of every bar. The indicator gathers comprehensive information into a compact table below the chart. Choose from 16 key metrics, grouped for convenience:

  • Volumes: total candle volume (Volume), cumulative session volume (Session Volume), and trading speed (Volume/sec).
  • Bid/Ask flow: volume traded at Bid and at Ask, and total trade count (Trades).
  • Delta: classic delta (Delta), its extremes (Max/Min Delta), its change (Delta Change), and the running session total (Session Delta).
  • Ratios: delta’s share of candle volume (Delta/Volume) and of the whole session (Session Delta/Volume).
  • Candle parameters: open time (Time), duration in seconds (Duration), and its height in ticks (Height).

Big Trades
Big Trades - indicators for traders in ATAS

Don't miss a single large trade

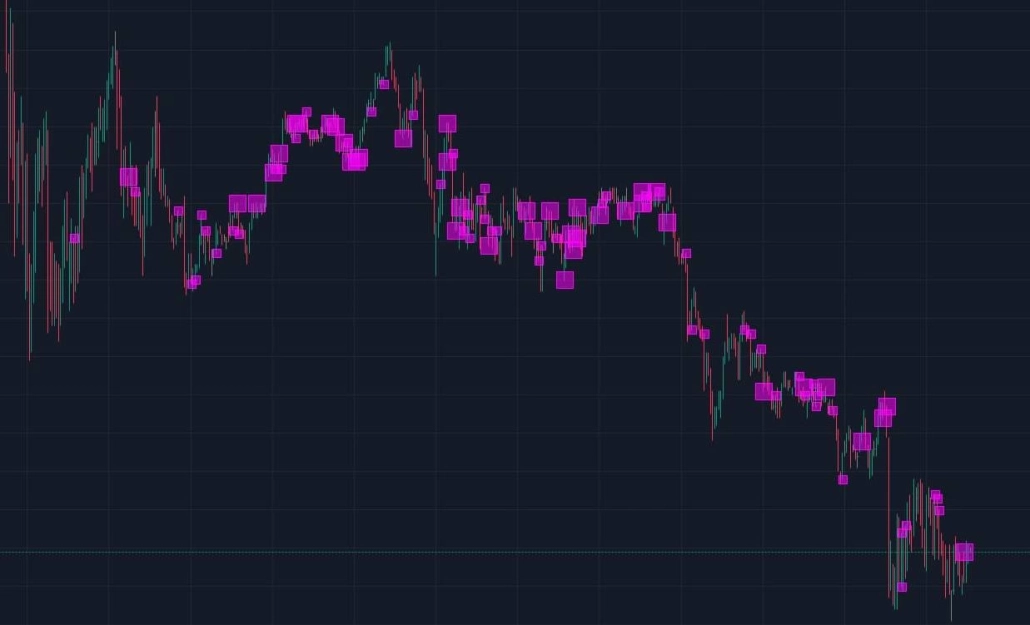
When a large participant enters a position with a big market order, the exchange splits it into dozens of small prints that get lost in the overall flow. Big Trades reassembles these pieces, showing you the real size of the trade instead of its fragments.

  • Hidden-volume detection: merges fragmented prints back into a single large trade.
  • Clear visuals: highlights reconstructed orders directly on the chart with easy-to-spot geometric markers.
  • Automatic adaptation: in Big Trades Adaptive mode, the indicator adjusts its own filters to current market volatility and time of day.
  • Smart auto-filter: calculates the market’s average volume and flags anomalies, with flexible sensitivity settings.
  • Zones mode: draws horizontal support and resistance lines from large trades.

Depth of Market
Depth of market - indicators for traders in ATAS

A clean view of the order book

The indicator brings the classic order book (DOM) directly onto your chart workspace.

  • Liquidity map: visualizes large limit levels of likely support and resistance.
  • A scalping reference: helps you find entry points with a stop-loss placed beyond a zone of real liquidity density.
  • Customization: flexible settings for cumulative market depth, scale, and color scheme.

Volume
Depth of market - indicators for traders in ATAS

The real balance of power in the market

A vertical volume histogram that shows participants’ real interest at current prices.

  • Two modes: Volume mode shows the exact number of contracts traded per unit of time; Tick mode shows the number of trades of one or more contracts.
  • Intuitive and low-noise: customize colors, line types, and scaling, and display volume directly on the chart to save screen space.

Delta/CVD/CVD Pro
Delta Cvd - indicators for traders in ATAS

See who holds the initiative

Tools for assessing the balance of market forces and spotting divergences between price and delta.

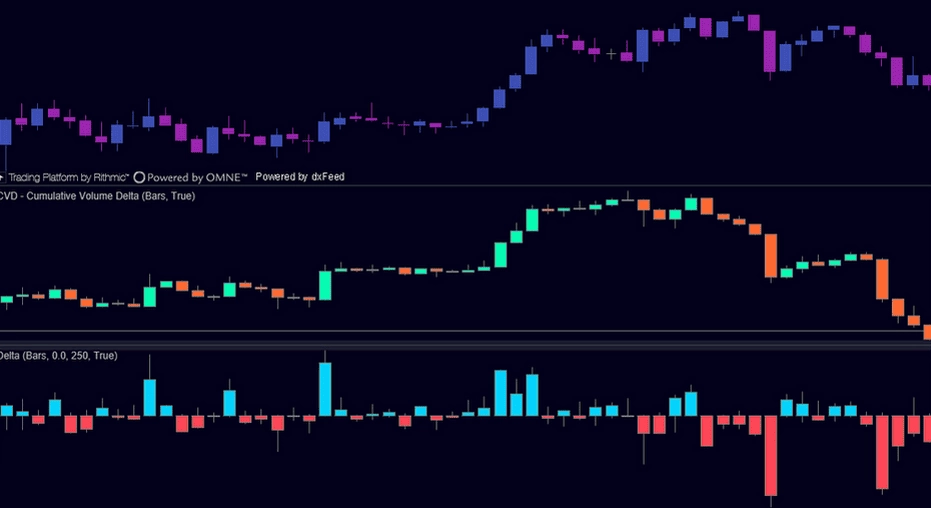
  • Delta: the net difference between market buys and sells. Shows who’s more aggressive at any given moment — buyers or sellers.
  • CVD (Cumulative Volume Delta): delta accumulated since the start of the session. Shows which side had the advantage over the selected period.
  • CVD Pro: lets you filter cumulative delta by trade size, so you can track large participants and retail traders separately.

Tape Patterns
Tape Patterns - indicators for traders in ATAS

Track the intensity and speed of volume

The indicator analyzes the speed and structure of the print tape and finds repeating patterns.

  • Algorithm detection: highlights repetitions and anomalies in participant behavior, and moments where hidden accumulation or distribution begins or ends.
  • Speed anomalies: flags sharp tape acceleration, a pattern that often precedes strong impulsive moves.
  • Historical analysis: works both in real time and on historical data, for testing and reviewing past trades.

Premium MBO Bundle Indicators

A standard order book (Level 2) only shows the total size of orders at each price level. It’s like looking at a crowd from a distance: you see a dense mass of people but can’t make out individual faces.

MBO (Market-by-Order) is ultra-high-resolution exchange data. It lets you ‘break down’ the overall mass of limit orders into individual orders. You see the ID of every single order, its size, its exact place in the queue, and any actions taken on it in real time. This is the data that MBO Bundle indicators process — they visualize the actions of individual large orders that are invisible in a standard order book.

⚠️ Important: MBO data is currently only available for the Rithmic connector. dxFeed support is in development.

Iceberg Tracker

Limit orders with hidden volume

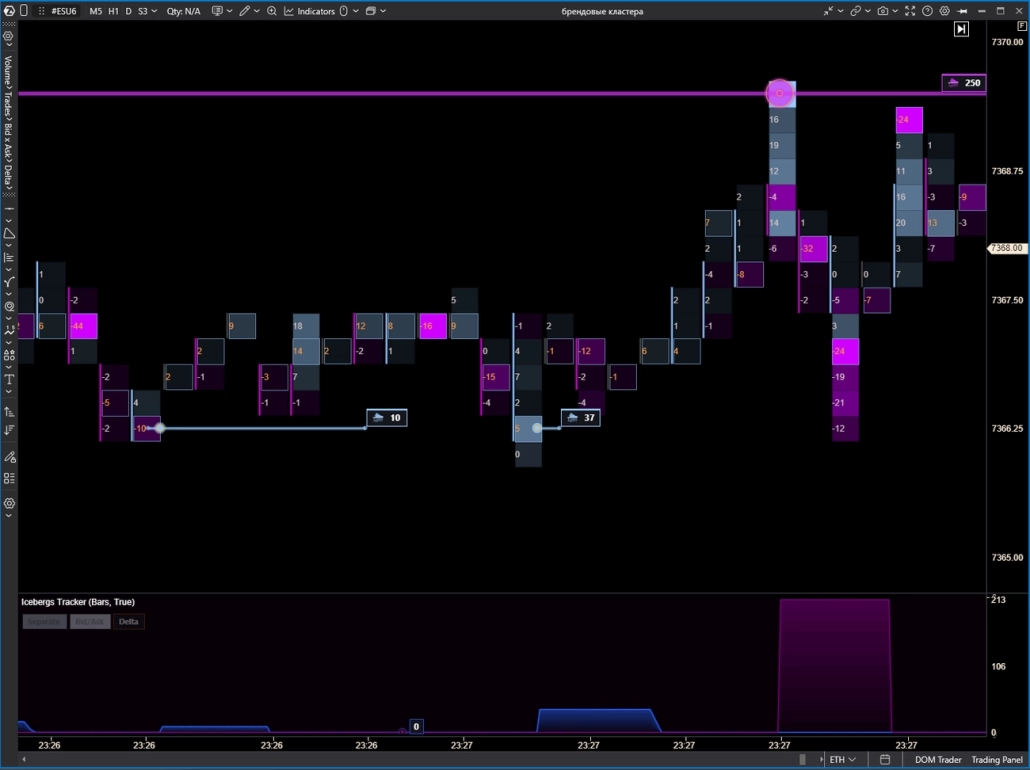
To avoid spooking the market, large participants often use “icebergs” — limit orders where only a small part of the volume is visible. As soon as the visible part is filled, the exchange automatically loads a new one from the hidden pool (refill). Each refill causes the order to lose its time priority and move to the back of the queue.

  • Iceberg Tracker matches order IDs and post-execution volume to show every one of these refills on the chart.
  • True volume: you see the iceberg’s real total volume and how many trades it took to reveal it.
  • Tick-level detail: in Show Individual Trades mode, you can break a large iceberg down into individual tick prints right on the chart.
  • Interactive history: hover over an order to see the iceberg’s full timeline.
Iceberg Tracker Advanced Trading Indicator

Stop Runs Tracker

Where other traders' stop-losses were triggered

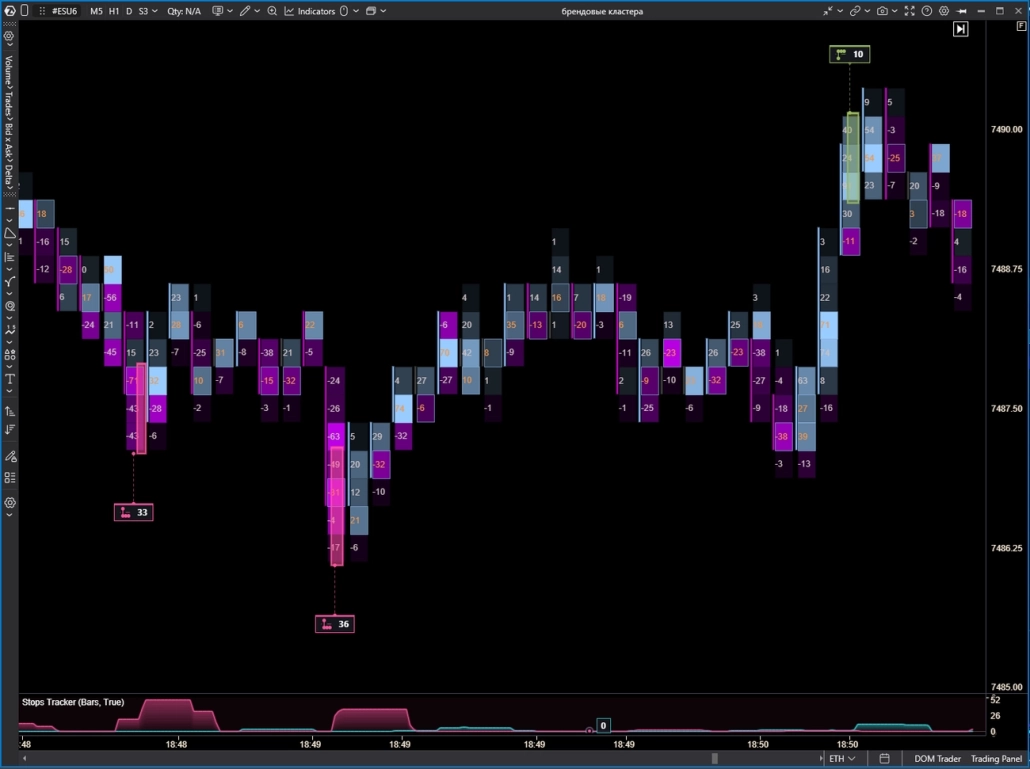
Stop orders (SL) sit on the exchange server and stay invisible in the order book until the price touches them. Once triggered, they cascade into regular market orders. Market lore holds that large players sometimes push price into zones where stops cluster, to close or open their own large positions there.

  • Cascade detection: the indicator tracks stop orders converting into market orders and groups these events into a single cascade.
  • Panic volume: shows the exact number of contracts force-executed within a cascade.
  • Speed and density: intensity markers help you visually tell ordinary market trades apart from forced position closures.
  • Interactive analysis: hover tooltips show the exact volume, time, and number of orders triggered within a cascade.
Stop Runs Tracker Advanced Trading Indicator

Sweeps Tracker

Aggressive liquidity absorption

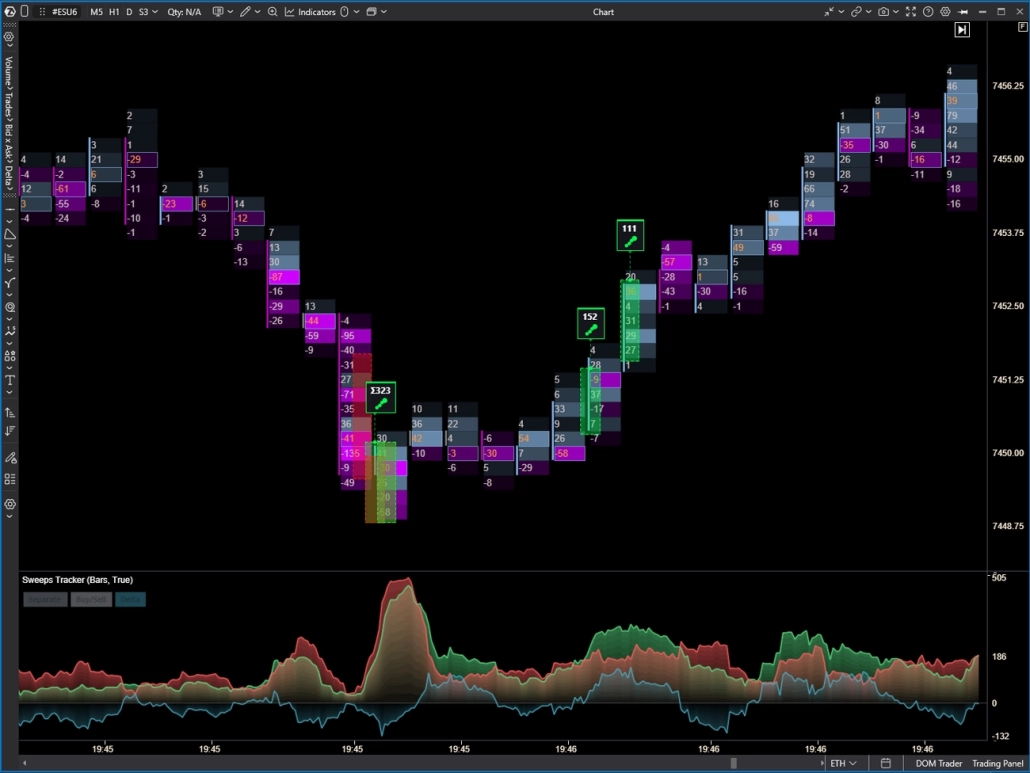
When a large player needs to enter the market fast, they send a huge market order that instantly “vacuums” the order book, sweeping up limit orders across several price levels in a row. This is called a sweep. On a standard tape, this impulse gets fragmented into dozens of small prints and lost in the noise.

  • ID-based reassembly: Sweeps Tracker analyzes the unique Aggressor ID, finds all the trades the exchange fragmented, and instantly reassembles them into the original order.
  • “Smart money” vector: highlights the pinpoint aggression of large players who are ready to buy or sell at any price, right now.
  • Leading levels: zones of large sweeps often become the strongest support and resistance levels the next time price returns there.
Sweeps Tracker Advanced Trading Indicator

Support and Resistance Level Indicators

Beginner traders often draw levels on the chart “by eye,” or simply mark old highs and lows. But the market doesn’t care about lines on a screen — price reacts to the balance of supply and demand, and to real trading volume.

ATAS indicators surface real levels, not imagined ones. They show you the zones where large limit orders are actually resting right now, and where the biggest market-trade volumes are passing through. You see a strong price barrier before the price even gets there.

Below are the tools that help you see these zones — invisible to classic technical analysis:

Volume Profile & TPO
Volume Profile & TPO Advanced Trading Indicators

Find fair-value zones

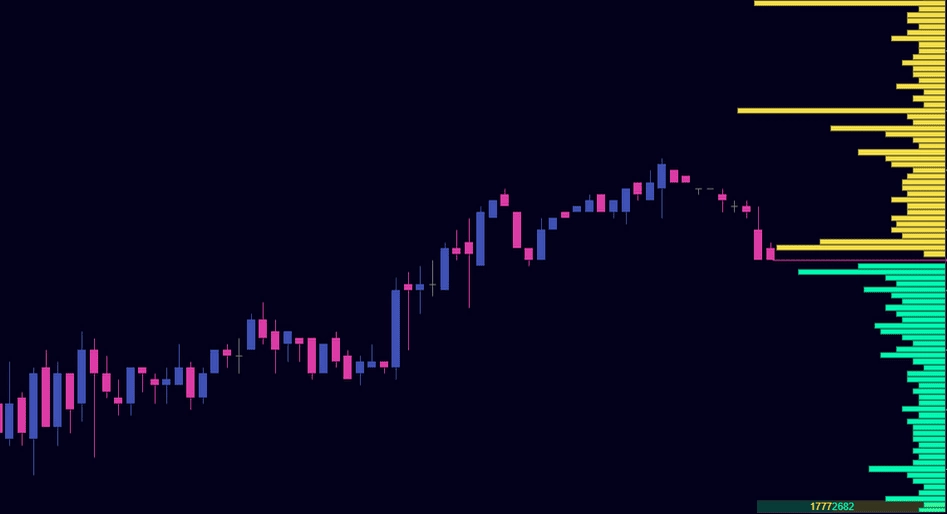
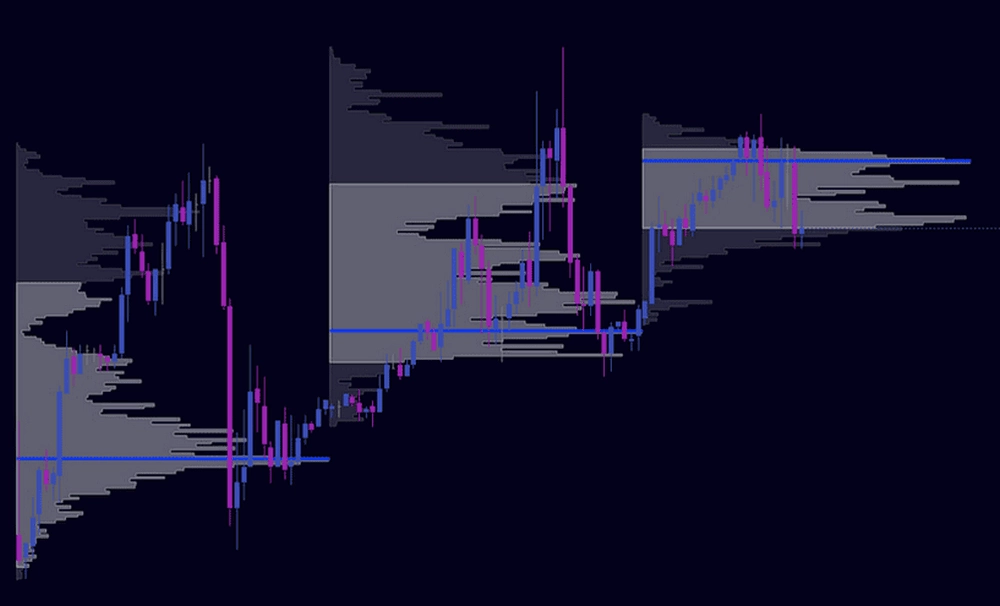
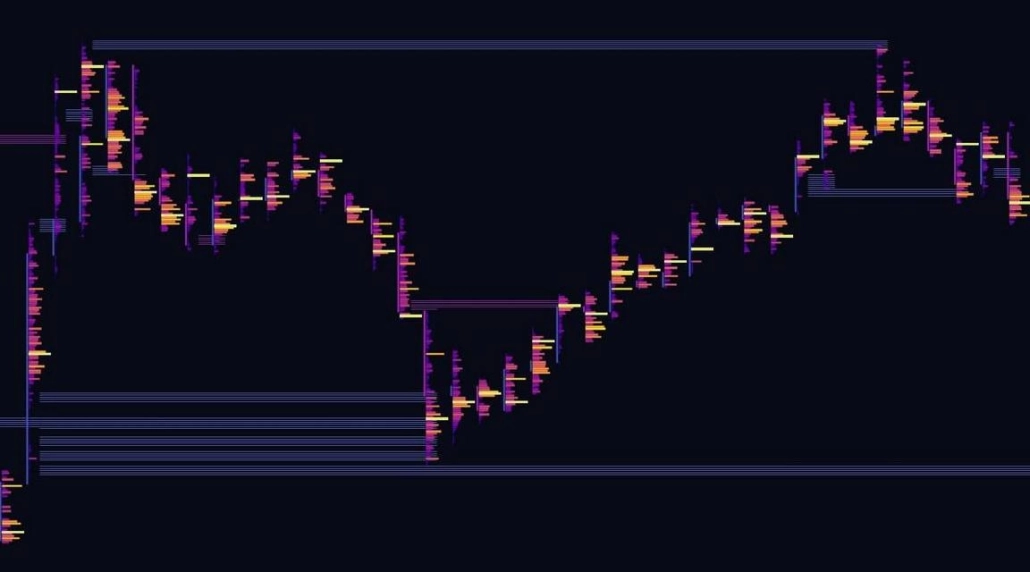
The indicator visualizes the structure of the market auction: at which levels and for how long the instrument traded, revealing strong balance and imbalance zones.

  • Intuitive histograms: the indicator plots the price-presence profile by time (TPO) and by actual traded volume.
  • Key reference points: automatically builds POC (point of maximum volume), VAH, and VAL levels (the boundaries of the fair-value zone).
  • TPO customization: choose your preferred TPO display format — classic triangles, highlighted blocks, or both at once.
  • Adjustable proportions: manually fine-tune the width of the profile, markers, and labels with the convenient Width (% of area) slider.
  • Flexible settings: adapts to any trading session, timeframe, or instrument.

Stacked Imbalance
Stacked Imbalance Advanced Trading Indicators

Gauge which side is winning

Find levels where buyers’ market orders overwhelm sellers’ limit orders several ticks in a row — or vice versa.

  • Anatomy of a breakout: the indicator highlights zones where buyer or seller initiative was overwhelming.
  • Automatic levels: builds support and resistance zones based on the imbalance of forces right inside the candle body.
  • Flexible filter: the Imbalance Ratio and adjacent-level-count settings let you adapt the indicator to a specific instrument’s volatility.

VWAP
VWAP Advanced Trading Indicators

Volume-weighted average price

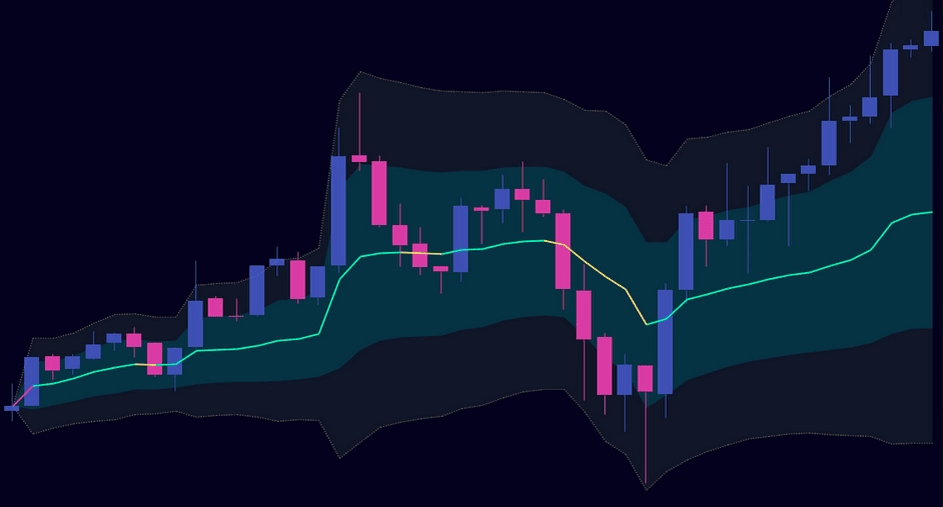
One of the benchmarks used by large funds. VWAP shows how the current price relates to price trends over the day, week, month, or even year. The indicator’s line doesn’t change shape when you switch timeframes — the calculation stays the same on minute charts and on Renko alike.

  • Trend detection: helps you identify trends, ranges, and reversals.
  • Dynamic levels: VWAP’s standard-deviation bands often act as support and resistance levels.
  • Multi-period comparison: compares current values with yesterday’s, last week’s, or last month’s.

DOM Levels

Where real liquidity sits

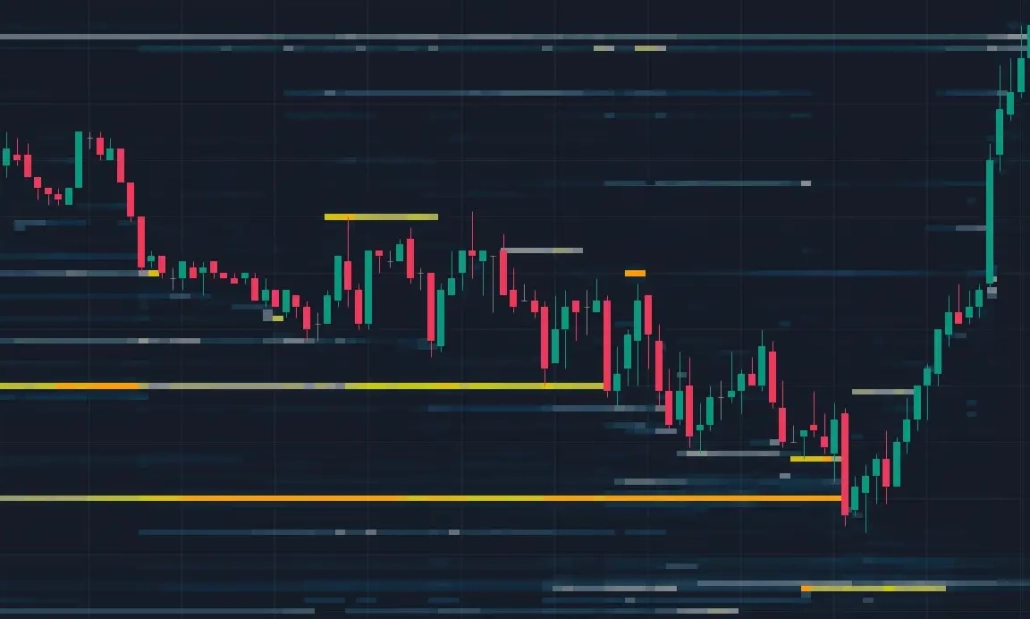
Displays a liquidity heatmap right on the chart — the brighter the zone, the larger the volume of passive orders sitting at that level.

  • Large-player orders: track large limit orders in real time, before the price even reaches that level.
  • Hold dynamics: watch whether limit orders stay in place or quickly disappear from the order book — this helps you judge whether a level is genuinely backed by liquidity, rather than just “drawn” on the chart.
  • Mirror zones: clearly shows how, after a breakout, a limit resistance level can flip into support — based on actual orders in the book.

Fair Value Gaps
Fair Value Gaps Advanced Trading Indicators

Catch impulsive price gaps

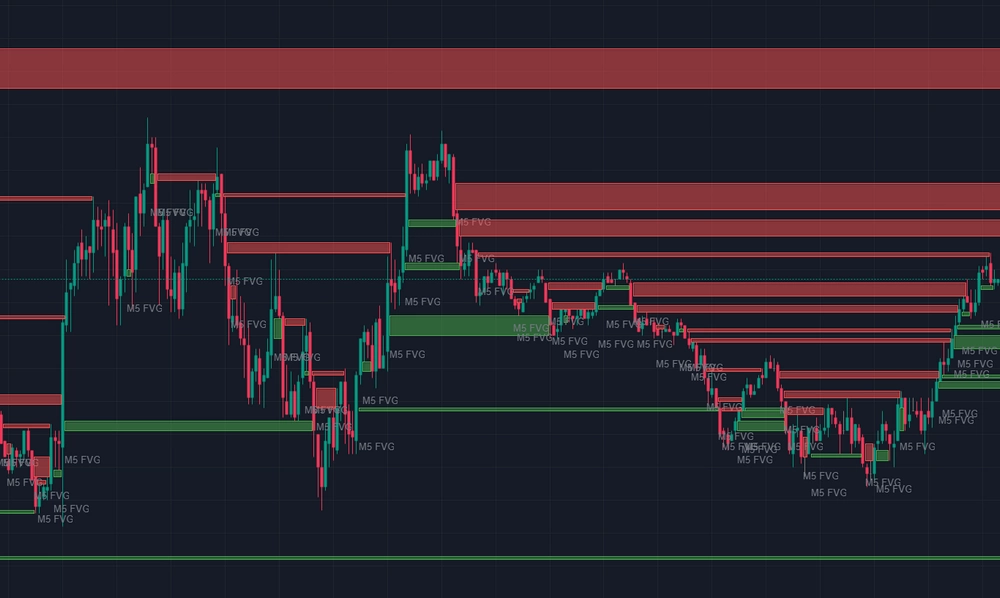
Automatically finds impulsive gaps — zones where demand or supply so sharply outweighed the other side that price passed through the level with almost no resistance.

  • Multi-timeframe: highlights bullish and bearish FVGs on the current timeframe and on higher ones at the same time, with no need to switch charts.
  • Midpoint test: the indicator plots the gap’s midline — a level traders often use as a reference point when price corrects.
  • Clean chart: filled zones that have already played out are hidden automatically, keeping the screen uncluttered.

Margin Zones
Margin Zones Advanced Trading Indicators

Forced position-closure levels

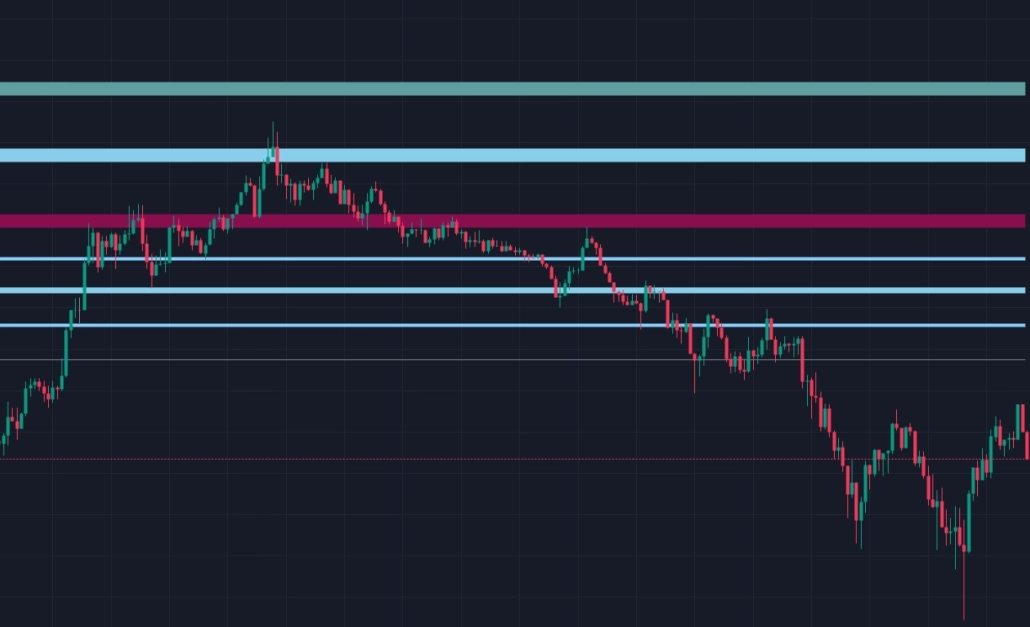
The indicator calculates and plots margin zones based on the exchange’s official specifications. These are the levels where margin requirements force leveraged participants to close losing positions en masse.

  • No manual math: automatically divides the margin requirement by tick value and builds precise target zones.
  • Level grid: displays zones as percentages (25%, 50%, 100%, 200%) to gauge the potential depth of a margin call.
  • Liquidity concentration map: calculates the levels where, under the exchange’s official rules, forced closures of leveraged positions kick in — zones that can potentially become points of increased liquidity.
  • Universal: configurable for any specific futures contract — just enter the margin requirements from the contract specification on the exchange’s website.

Maximum Levels / Dynamic Levels
Dynamic Levels Advanced Trading Indicators

Static and dynamic volume peaks

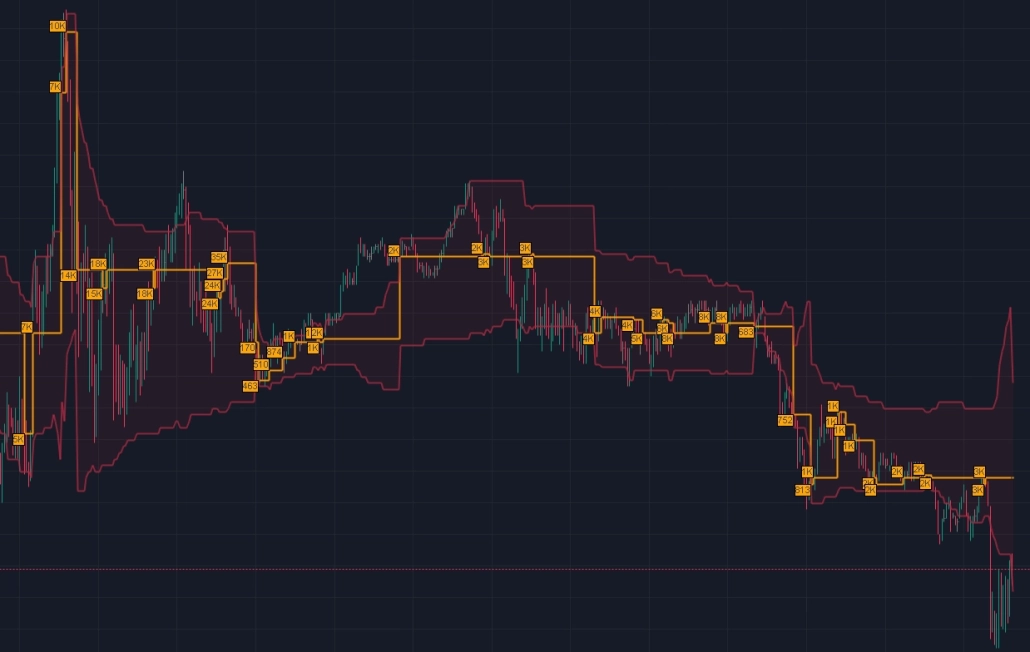
Two tools that work together to track zones of maximum interest (POC).

  • Maximum Levels (Static): plots the levels of maximum volume, delta, or trade count for the selected period (day, week, contract) on the chart.
  • Dynamic Levels (Dynamic): shows exactly how key levels (POC, VAH, VAL) shifted as trading progressed.
  • Smart alerts: the system notifies you when a dynamic level is tested or shifts to a new price point.

API and Custom Indicators

You also have access to indicators built by ATAS partners and community members. These analytical tools are grounded in hands-on experience with volume, market structure, and participant behavior.

If the standard toolkit isn’t enough, you can always extend the analytics platform’s capabilities to fit your needs.

  • Ready-made community solutions: use indicators built by third-party developers and ATAS partners, drawing on their hands-on trading experience.
  • Build with the ATAS API: create your own tools in C#. ATAS gives you access to raw tick data, delta, volume, and the order book. You can manage other users’ access and monetize what you build.
  • Professional help: if you don’t code yourself, you can bring in third-party developers through our marketplace to build out your idea.

FAQ

  • Most classic indicators — RSI, MACD, moving averages — work purely off a bar’s closing price. They don’t see what happened inside the candle: who was more aggressive, where volume was concentrated, how orders were split between buyers and sellers.

    ATAS indicators are built on the exchange’s raw tick data. For example, Big Trades shows you real large trades as they happen, Stacked Imbalance highlights the bid/ask imbalance within a single candle, and Volume Profile shows exactly where the market spent the most time over the selected period.

    Classic technical indicators are also available in ATAS and work alongside the volume tools on the same chart.

  • For intraday traders, the key criterion for choosing an indicator is response speed and how closely it’s tied to real market activity, rather than to calculated values from past periods. In ATAS, traders most often use Delta and CVD to see the current balance of initiative between buyers and sellers, DOM Levels to understand where real liquidity sits in the order book, and VWAP as a dynamic fair-value reference for the session.

    Tape Patterns and Speed of Tape also help you track how intense the trade flow is — abnormal speed or repeating tape patterns that traders often watch as a possible sign of an accelerating move. All of this is available in real time, recalculated on every tick.

  • Yes. ATAS connects to tick data streams from crypto exchanges, including Binance Futures, Bybit, OKX, and others. Volume and Order Flow indicators work on any market where real trade data is available. That means you can analyze stocks, index futures, commodities, and cryptocurrencies.

    The only requirement is that the instrument has sufficient liquidity and provides a tick stream broken down by bid/ask. On illiquid pairs with a low trade count, volume-indicator readings lose reliability, regardless of the analytics platform.

  • Yes, and that’s one of ATAS’s key features. You can add several indicators to a chart at once, layered over the price chart — from 3 on the free Start plan up to an unlimited number on Ultra. For example, you could add Volume Profile to gauge the fair-value zone, Stacked Imbalance to spot imbalances, and Delta for an instant read on whether buyers or sellers have the upper hand.

  • Yes. You can use all of ATAS’s core indicators for free, with no time limit, on the Start plan. No credit card required.

    Once you’re ready to try the advanced features, activate a 14-day free trial of the plan you’re interested in by linking a card or PayPal. When the trial ends, your subscription automatically continues at the paid rate for that plan — you can cancel anytime from your account.

    The trial period or a paid plan lets you analyze more assets at once, layer more indicators on a chart, and unlocks professional market-analysis features, including Replay: it replays a historical trading session tick by tick in real time, letting you practice on real past data without financial risk.

Try every indicator for free

Activate the Start plan — free, with no time limit and no card required.

Try for free