Imagine Bitcoin drops 8% in a single evening. Most investors watch the value of their portfolios shrink. Meanwhile, a trader holding a short futures position locks in a profit.
That’s what makes crypto futures different. You don’t need to own a single satoshi to benefit from both powerful bull runs and sharp market sell-offs. Instead, you’re trading price movements rather than the underlying cryptocurrency itself. But that flexibility comes at a cost: futures trading requires a much deeper understanding of how the market works than simply buying crypto on the spot market.
In this guide, we’ll break down how crypto futures contracts work, explore five practical trading strategies used by experienced market participants, and show you how ATAS tools can help reveal the activity of large market players hidden behind the price action.
Start now!
Try ATAS free with no time limit
Trading cryptocurrency futures and other derivative financial instruments involves a substantial risk of capital loss. Past performance does not guarantee future results. ATAS provides analytical and data visualization tools only. All trading decisions are made solely by the trader at their own discretion and risk.
What Are Crypto Futures Contracts?
Forget about blockchains for a moment. The easiest way to think about a crypto futures contract is as an agreement between two market participants based on where they believe an asset’s price is heading.
In spot trading, you buy the actual cryptocurrency. Purchase 1 BTC, and it’s yours—you can transfer it to your own wallet, hold it for years, or spend it however you like.
Crypto futures work differently. Instead of buying Bitcoin itself, you open a contract whose value rises or falls with the underlying asset. Since you never take ownership of the coins, there’s no need to worry about wallets, transfers, or custody. You’re trading price movement – and nothing else.
Perpetual vs. Fixed-Date (Quarterly) Futures: What’s the Real Difference?
Traditional futures markets are built around contracts with a fixed expiration date. Crypto introduced a different model: perpetual futures contracts, which have no expiration at all.
The idea proved so successful that perpetual contracts now account for more than 90% of global crypto derivatives trading volume.
Perpetual Futures
Perpetual futures never expire, allowing traders to hold positions for hours, weeks, or even months.
They’ve become the dominant contract type for several reasons:
✓ No need to roll positions into a new contract before expiration.
✓ Deep liquidity across most major cryptocurrency markets.
✓ Greater flexibility for both short-term traders and longer-term positions.
To keep perpetual futures prices closely aligned with the spot market, exchanges use a mechanism called the Funding Rate – periodic payments exchanged between long and short traders. We’ll explain how it works and how traders use it later in this guide.
Fixed-Date (Quarterly) Futures
Quarterly futures contracts have a predefined expiration date. Once that date arrives, the contract is settled at its final settlement price.
These contracts are commonly used by:
- Miners and large holders, who hedge against adverse price movements.
- Long-term investors, who prefer not to pay recurring funding fees.
- Arbitrage traders, who profit from the price difference (known as the basis) between the spot market and quarterly futures.
Unlike perpetual contracts, quarterly futures don’t use a Funding Rate. Instead, they often trade at either a premium or a discount to the spot market until expiration.
Key Contract Specifications
Before opening a position, it’s important to understand the key specifications of the contract you’re trading.
How Crypto Futures Trading Works
Crypto futures trading revolves around three core concepts: market direction, leverage, and risk management. Unlike spot trading, futures let you profit from both rising and falling markets while controlling positions that are much larger than your account balance.
- Long Position: You buy a futures contract expecting the asset’s price to rise, then close the position at a higher price.
- Short Position: You sell a futures contract expecting the price to fall, then buy it back at a lower price. The ability to sell without owning the underlying asset is one of the defining features of futures trading.
- 24/7 Market: Unlike traditional futures markets, crypto futures trade around the clock. Some of the biggest price swings happen while your local market is asleep.
Leverage and Margin Requirements: How Borrowed Capital Works
Leverage allows you to control a larger position than your account balance would normally allow. The difference is effectively financed by the exchange, while your own funds serve as margin.
- Initial Margin: The minimum amount of capital required to open a position. For example, opening a $10,000 position with 10x leverage requires $1,000 in initial margin.
- Maintenance Margin: The minimum amount of equity required to keep the position open. If your account balance falls below this threshold, the exchange will automatically liquidate your position to prevent further losses.
For experienced traders, the key question isn’t “How much can I make with 20x leverage?” It’s “How close is my liquidation price?”
Funding Rate Explained: Who Pays Whom?
Because perpetual futures never expire, their price can drift away from the underlying spot market. To keep both markets aligned, exchanges apply a Funding Rate at regular intervals – typically every 4 or 8 hours.
- Positive Funding Rate: Perpetual futures are trading above the spot price, suggesting that long positions dominate the market. In this case, long traders pay funding to short traders.
- Negative Funding Rate: Perpetual futures are trading below the spot price, indicating stronger bearish sentiment. Here, short traders pay funding to long traders.
A simple rule of thumb: when you’re trading with the crowd, you usually pay funding. When you’re positioned against it, you may receive funding instead.
Crypto Futures vs. Spot Trading
If you believe Bitcoin is about to rise, buying it on the spot market is often the simplest option. But what if you expect the price to fall? That’s where crypto futures trading offers a clear advantage.
While futures offer greater flexibility, they also carry significantly higher risk. If you’re new to crypto futures trading, it’s worth practicing first on a demo account or in ATAS Replay before risking real capital.
Popular Crypto Futures Markets
Although hundreds of cryptocurrencies have futures markets, most trading volume is concentrated in just a handful of assets.
- Bitcoin (BTC): The most liquid crypto futures market, offering deep order books and relatively low slippage. It’s often the first choice for both beginners and professional traders.
- Ethereum (ETH): The second-largest futures market by trading volume. Ethereum tends to be more volatile than Bitcoin, creating more trading opportunities – but also exposing traders to greater risk.
- Large-Cap Altcoins: Markets such as SOL, XRP, and BNB generally offer lower liquidity than BTC or ETH. As a result, price swings can be sharper and large orders have a greater impact on the market. Higher volatility may create additional opportunities, but it also increases trading risk.
If you’re just getting started with crypto futures, Bitcoin is usually the best place to begin. Its deep liquidity and more stable market structure make price action easier to read while reducing the impact of sudden, low-liquidity moves.
Crypto Futures Trading Strategies
Most beginners spend their time looking for familiar chart patterns – head and shoulders, triangles, or double tops. The problem is that these patterns reveal very little about who’s actually driving the market. Professional traders pay much closer attention to trading volume, delta, open interest, and order flow. The strategies below are built around those signals rather than traditional chart patterns.
No single strategy works in every market environment. Some perform best during strong trends, while others are designed for range-bound conditions. That’s why experienced traders analyze the market first and only then look for a trading opportunity.
Trend-Following with Volume Profile
One of the most expensive mistakes beginners make is trying to catch a market reversal. After a strong rally, it often feels like the price has to pull back. In reality, powerful trends tend to last much longer than most traders expect.
Rather than calling tops or bottoms, experienced traders prefer to wait until a trend is clearly confirmed before joining it.
Common confirmation signals include:
- A breakout above a recent high or below a recent low.
- Rising trading volume.
- Increasing Open Interest.
- Buy or sell imbalances visible in the Order Flow.
Imagine Bitcoin has been trading in a narrow range for several hours. It finally breaks above resistance, while both trading volume and Open Interest continue to rise. That combination may suggest new buyers are entering the market rather than short sellers simply closing their positions.
Instead of chasing the breakout, many traders wait for a pullback toward a key Point of Control (POC) or Value Area identified by the Volume Profile. These are price levels where significant trading activity has already taken place and where larger market participants often defend their positions. If the price retests the POC after the breakout and buyers continue to step in, it can be a sign that the trend still has room to continue.
In ATAS, these levels are easy to identify using the Volume Profile & TPO indicator. You can also configure alerts to notify you when price reaches the POC or approaches it, making it easier to monitor potential pullback entries without constantly watching the chart.
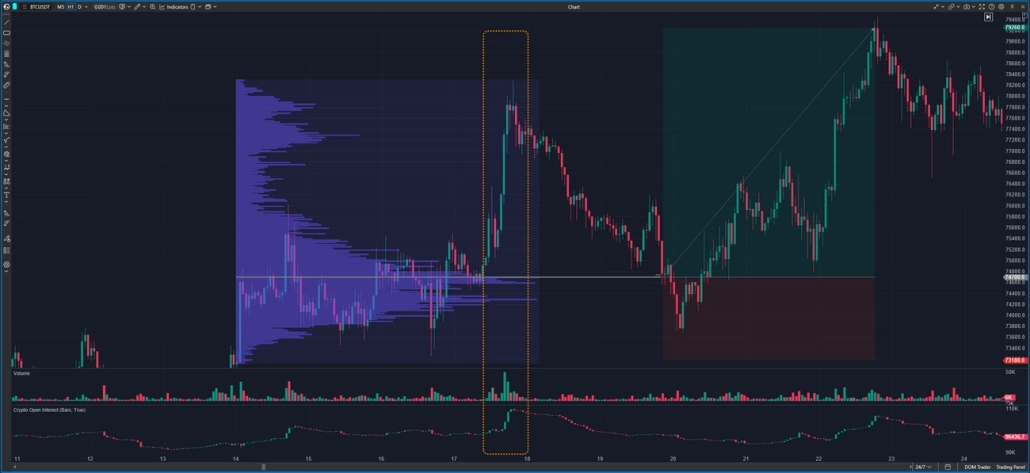
The screenshot shows a resistance breakout accompanied by rising trading volume and increasing Open Interest. An entry can be considered after a retest of the POC. The stop-loss is typically placed below the local low. This approach helps manage risk: with a risk-to-reward ratio of at least 1:3, the strategy can remain statistically profitable even with a relatively low win rate—the exact percentage depends on the individual trader’s performance statistics.
Range & Mean-Reversion Strategies
Not every trading session produces a strong trend. Much of the time, the market moves sideways, oscillating between support and resistance levels.
In these conditions, many traders turn to mean-reversion strategies, which are based on the assumption that price is likely to return toward the middle of an established trading range.
The basic idea is simple:
- Buy near the lower boundary of the range.
- Sell near the upper boundary.
- Take profits around the midpoint of the range or near the opposite boundary.
Of course, price touching support or resistance alone isn’t enough to justify a trade.
Traders often look for additional confirmation, such as:
- declining volume during a breakout attempt;
- absorption of aggressive market orders;
- high-volume clusters;
- signs that buyers or sellers are losing momentum.
A standard candlestick chart rarely reveals this kind of market interaction. A Footprint chart, however, makes it much easier to see where significant buying or selling activity is actually taking place.
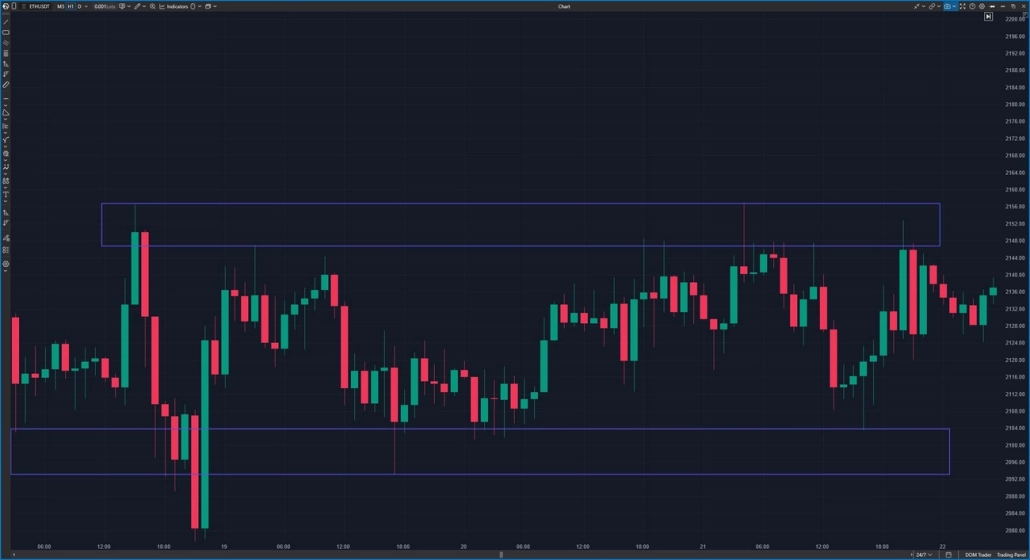
The screenshot above shows a sideways trading range (flat) that has formed—this represents a balance between supply and demand.
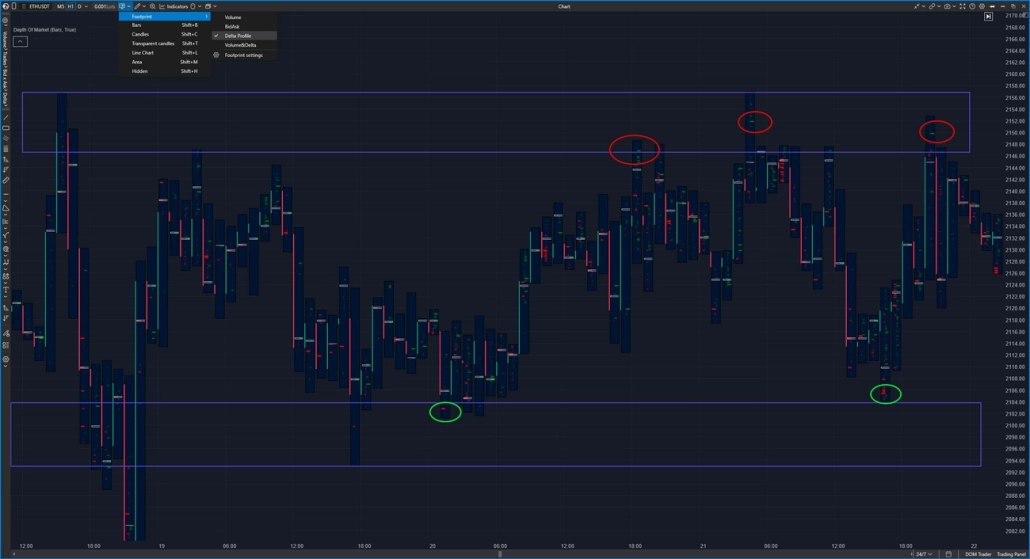
This is the same trading range shown in a Footprint chart, where significantly more information becomes visible as the price of Ethereum briefly breaks above the upper boundary of the range.
Some traders look to trade the breakout, but take a closer look at the top of the candle:
✔️ a volume spike appears in the upper wick;
✔️ Delta is strongly positive (highlighted with red ovals);
✔️ the price closes back inside the range.
This is a sign that buyers were absorbed by a large limit seller. Such a scenario may provide an opportunity to look for a short position, targeting profit-taking near the middle or the lower boundary of the range.
You can open a Footprint chart in ATAS in several ways:
✓ press Shift + K;
✓ select Mode → Footprint from the menu in the upper-left corner;
✓ zoom in using the mouse wheel.
Futures are widely used not only for speculation but also for risk management.
Suppose you’ve been holding Bitcoin for several months and have no intention of selling it. Tomorrow, however, the U.S. inflation report is due, and the market has been looking increasingly nervous. You want to stay invested for the long term, but you also want to protect yourself against a potential short-term sell-off.
Instead of selling your coins, you can open a short futures position.
If Bitcoin falls:
- the value of your spot holdings declines;
- gains from the short futures position can partially or fully offset those losses.
Once the uncertainty passes, the hedge can be closed while the long-term investment remains intact.
Funding Rate / Basis Arbitrage
Unlike directional trading, arbitrage strategies do not rely on predicting where the market will move. Instead, they aim to profit from temporary pricing inefficiencies.
One common example involves the Funding Rate.
When the Funding Rate becomes unusually high, a trader can:
- buy the asset on the spot market;
- open a short position in the perpetual futures contract.
Because the long spot position and the short futures position largely offset each other, the trader remains close to market-neutral while collecting periodic funding payments.
Another approach uses quarterly futures.
If a quarterly contract is trading at a significant premium to the spot market, traders can exploit the price difference – known as the basis. As the contract approaches expiration, this premium typically narrows, creating an opportunity to profit from the convergence.
These strategies may appear low-risk, but they still require careful consideration of trading fees, funding costs, and execution quality.
Scalping & Intraday Strategies Using Order Flow Data
Scalping is one of the most active trading styles. Positions are typically held for anywhere from a few seconds to a few minutes, with decisions based on real-time buying and selling activity. This is where Order Flow tools like those available in ATAS become particularly valuable.
Intraday traders typically focus on
✓Footprint Chart
✓Smart DOM
✓Volume Profile
✓Delta
✓Open Interest
For example price approaching a major resistance level. On a standard candlestick chart, it may look like another bullish breakout attempt. A Footprint chart, however, can reveal a very different story. Despite heavy market buying, the price barely moves higher. This often indicates that a large passive seller is absorbing the incoming buying pressure.
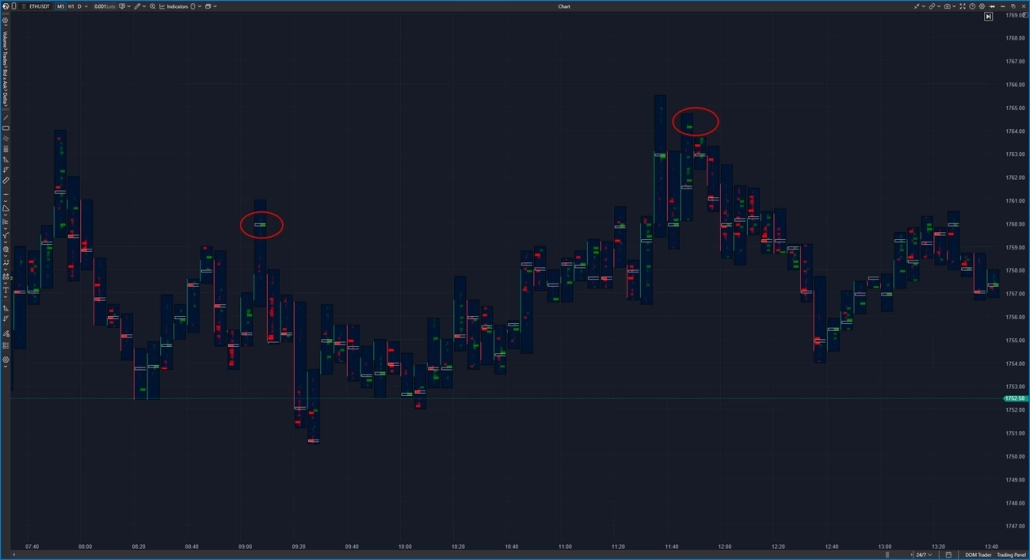
A setup like this often precedes a local reversal or a deeper pullback.
A Footprint chart does not generate buy or sell signals on its own. Instead, it reveals how buyers and sellers interact at each price level, helping traders assess which scenario is becoming more likely.
Reading the Market: Insights & Analysis Tools
A candlestick chart shows the outcome: price went up, down, or nowhere. Order Flow and volume analysis go one step further by revealing what happened beneath the surface – who was driving the move and how it unfolded.
This is where ATAS becomes particularly useful. Instead of forcing traders to interpret thousands of individual trades, the platform transforms raw market data into visual tools such as Footprint, Volume Profile, and other advanced market visualizations that make order flow much easier to analyze.
Imagine Bitcoin rallying sharply. At first glance, it looks as though buyers are firmly in control. But price alone cannot tell you whether fresh capital is entering the market or whether the rally is simply being fueled by short sellers closing their positions.
This is where Open Interest becomes especially valuable.
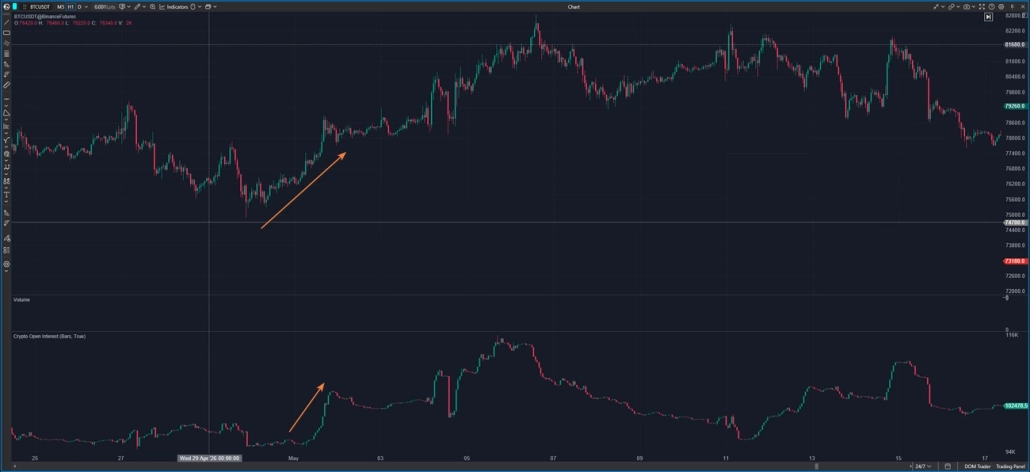
An increase in Open Interest alongside a rising price may indicate that new capital is entering the market, confirming the strength of the current move.
This is where Crypto Open Interest can be especially useful. It is a cross-market crypto analysis tool that aggregates data on the total number of active (open) futures contracts from the world’s largest exchanges into a single interface. Rising OI indicates an inflow of new capital and is traditionally viewed as confirmation of a sustainable trend, helping traders distinguish genuine price momentum from false moves.
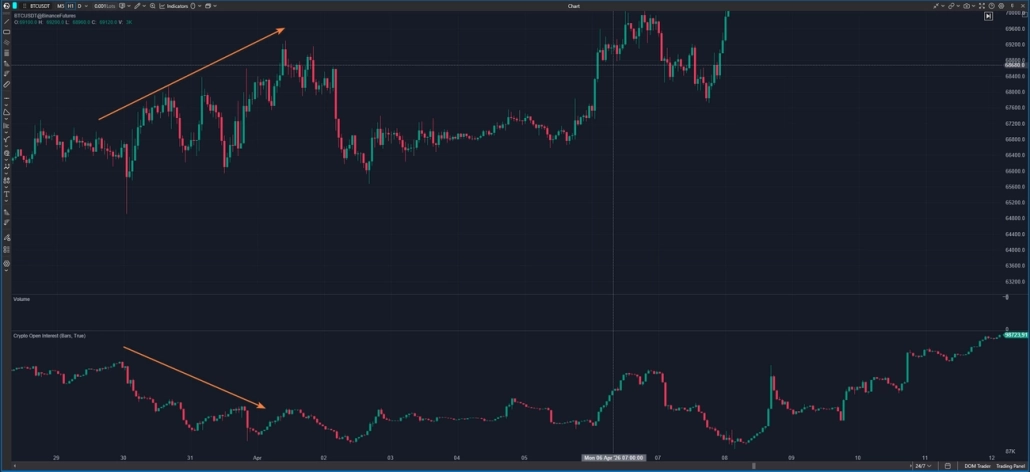
If the price continues to rise while Open Interest declines, the move may be driven by short sellers closing their positions rather than by new buyers entering the market.
To build a more complete picture of market activity, traders typically analyze volume from three different perspectives.
Take a standard bullish candle. On a regular chart, it simply looks like a strong upward move. A Footprint chart may tell a different story. Most of the trading volume is concentrated near the top of the candle, where a large passive seller steadily absorbs aggressive buying pressure. From the outside, price appears to be rising – but beneath the surface, buyers and sellers are already engaged in a fierce battle.
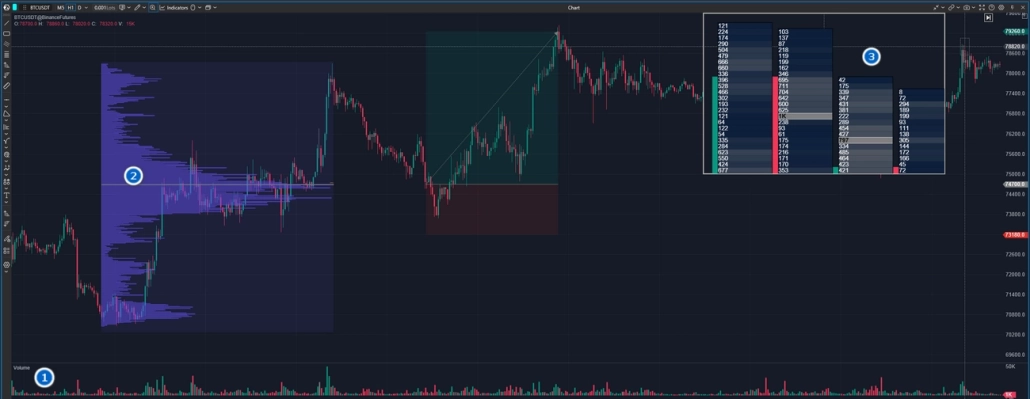
Additional insight into market sentiment can be gained from metrics such as the Funding Rate.
Extremely positive funding rates may signal excessive bullish optimism, while negative readings often accompany periods of panic selling.
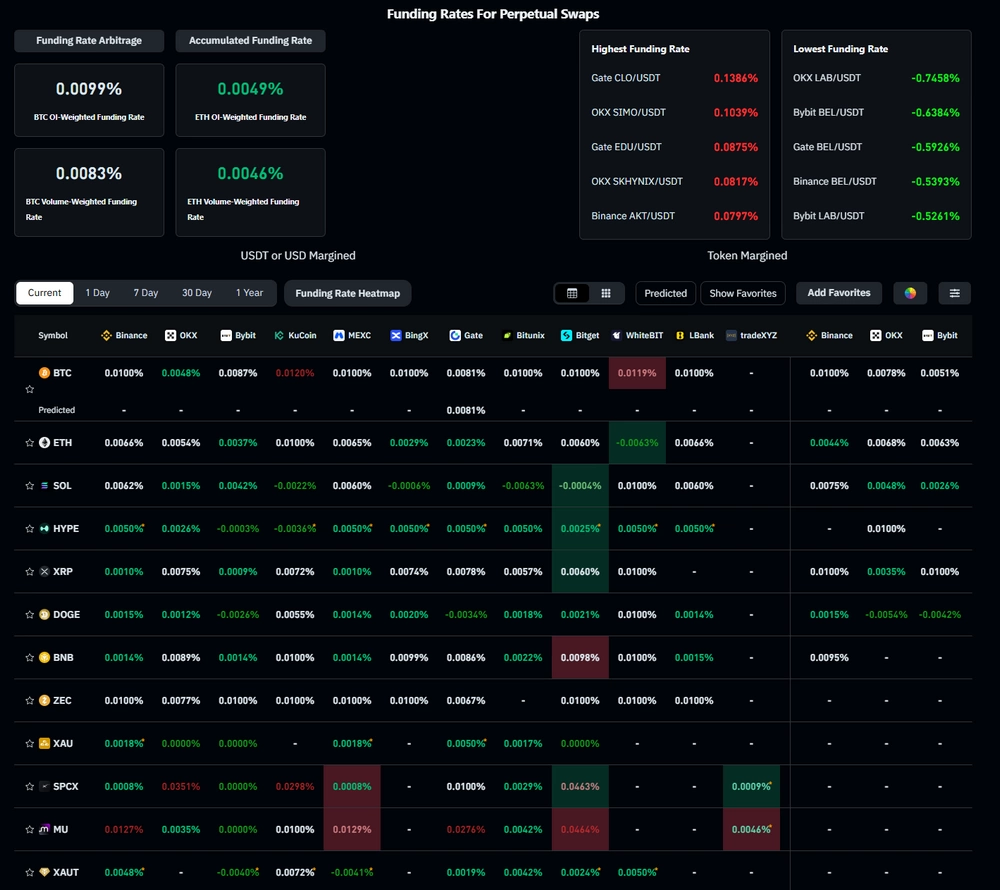
None of these tools can tell you where the market is headed. What they can do is reveal what’s happening beneath the surface of the current move. That’s why professional traders rarely rely on candlestick charts alone when making trading decisions.
Risk Management in Crypto Futures Trading: 5 Rules
Most beginners lose money not because they misread the market, but because they take oversized positions, trade without a stop-loss, or refuse to accept a losing trade. In crypto futures, risk management matters more than finding the “perfect” strategy.
Define your risk before entering a trade
Before opening a position, answer three questions:
- Where is your stop-loss?
- How much are you willing to lose if you’re wrong?
- Does the potential reward justify the risk?
If you don’t answer these questions before entering a trade, the market will force you to answer them emotionally afterward.
Size your position properly
Many beginners choose their position size based on the maximum leverage available. A better approach is to define your acceptable risk first and calculate your position size afterward. For example, with a 5,000 USDT account and a 1% risk limit, your maximum loss should not exceed 50 USDT.
Use leverage responsibly
Leverage doesn’t make a strategy more profitable—it simply amplifies gains and losses. Many experienced traders prefer moderate leverage, giving positions enough room to withstand normal market volatility without risking premature liquidation.
Don’t ignore stop-losses
A stop-loss is a risk management tool, not a sign of failure. Almost every trader has been tempted to move a stop “just a little farther” in the hope that the market will reverse. More often than not, that decision becomes an expensive mistake.
Manage your overall exposure
Holding several highly correlated positions can increase your real risk far beyond what you intended. For example, being long BTC, ETH, and SOL is often a single bullish bet on the broader crypto market rather than three independent trades.
Risks & Challenges of Crypto Futures Trading
Crypto futures offer significant profit potential, but they also come with higher risks. The more leverage you use, the less room the market has to move against you.
High Volatility
Cryptocurrencies can gain or lose several percent within minutes. Rapid price swings create opportunities for substantial profits, but they can just as quickly lead to significant losses.
Liquidation Risk
Liquidation
occurs when an exchange forcibly closes your position to prevent your account balance from falling below the required margin. Because you’re trading with borrowed capital, the exchange protects itself by automatically closing losing positions.
Leverage matters
11x leverage: the asset would have to lose nearly 100% of its value before liquidation.
210x leverage: a 10% move against your position can trigger liquidation.
350x leverage: a price move of just around 2% may be enough to wipe out the position.
Funding Costs
If you hold perpetual futures for an extended period, Funding Rate payments become part of your trading costs. During periods of elevated market activity, funding can increase significantly and reduce overall returns.
Cascading Liquidations
Sometimes the market moves several percent within minutes without any obvious news catalyst. One common reason is a liquidation cascade. As leveraged positions are forced to close, they push the price even further, triggering additional liquidations and amplifying the move. These chain reactions are a major source of sharp intraday volatility.
To avoid missing this domino effect, traders use the Aggregated Liquidation indicator. By aggregating data on forced liquidations from all major exchanges into a single metric, it clearly visualizes the amount of market “fuel” driving sharp intraday price movements.
Exchange Risk
Even the largest crypto exchanges aren’t immune to technical outages, temporary downtime, or order execution issues. Professional traders factor these infrastructure risks into their overall risk management plan.
How to Start Trading Crypto Futures
Getting started with crypto futures doesn’t have to be complicated. The best approach is to learn gradually, focusing not only on placing trades but also on setting up an efficient trading workspace.
Here’s what the process looks like in ATAS.
Step 1. Connect a Market Data Source
Generate API keys. Log in to your exchange account, navigate to the API Management section, and create a new API key. Enable Futures Trading permissions and, for security reasons, make sure withdrawal access remains disabled.
Connect your exchange to ATAS. In the main ATAS window, open Connections → Add, select your exchange from the list of crypto data providers, then enter your API Key and Secret Key. Click Connect. Once the connection is established, the status indicator should turn green and display Connected.
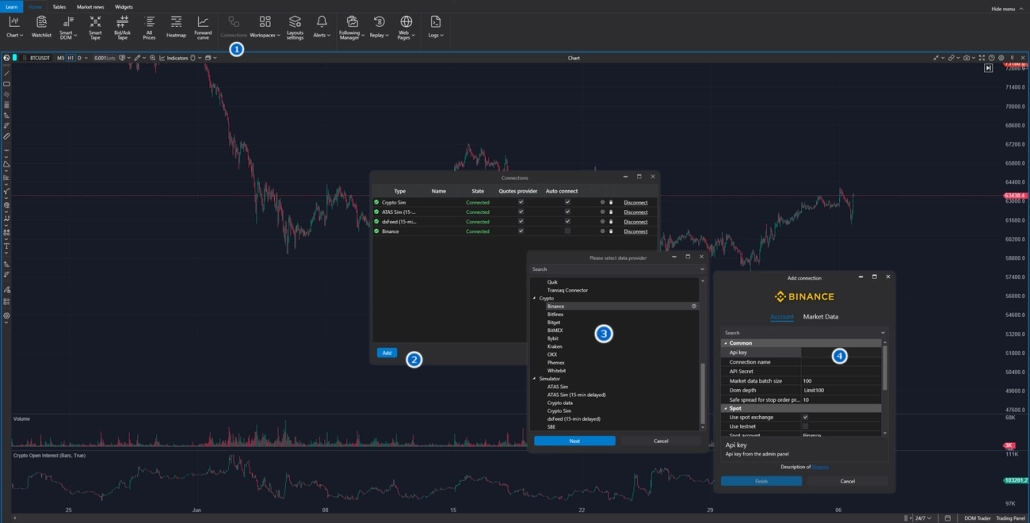
Select a contract.
Open a new Chart window and search for the ticker of the perpetual futures contract you want to trade – for example, BTCUSDT for Bitcoin futures or ETHUSDT for Ethereum futures. For deeper market analysis, switch the chart to Footprint mode to visualize order flow and traded volume at each price level.
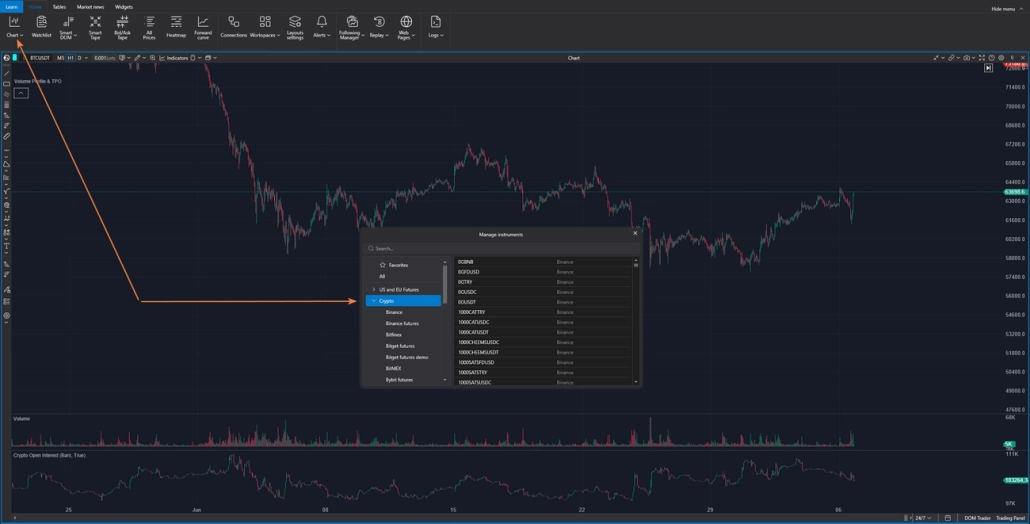
Step 2. Set Up Your Chart
Add the core analysis tools:
- Volume Profile
- Delta
- Open Interest
Together, these tools provide far more market context than a standard candlestick chart.
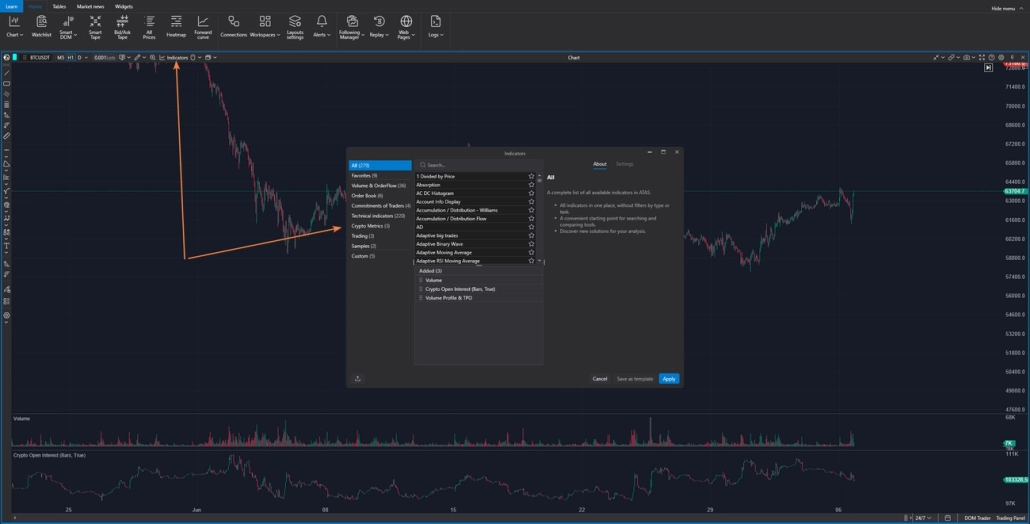
Together, these tools provide far more insight into market activity than a standard candlestick chart alone.
Step 3. Define Your Risk Parameters
Before placing your first trade, decide on:
- your maximum risk per trade;
- your stop-loss level;
- your maximum daily loss limit.
Setting these rules in advance helps prevent impulsive decisions once you’re in a live position.
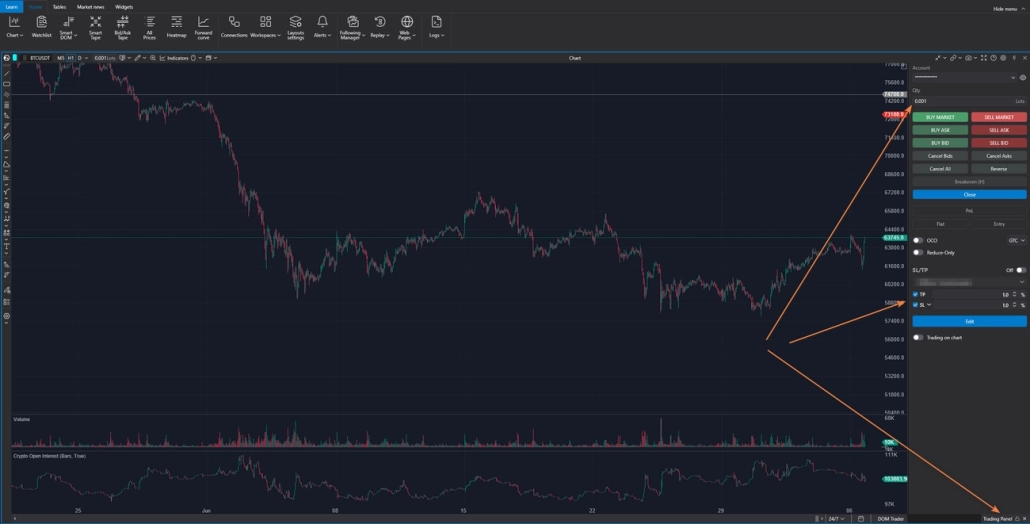
Step 4. Wait for a Trade Setup
Avoid opening a position simply because the market is moving. Wait until a predefined setup that matches your trading strategy appears before entering a trade.
Step 5. Review Your Trade
After closing a position, save a screenshot of the chart and briefly note why you entered and exited the trade. Reviewing your trades regularly helps identify recurring mistakes and improve decision-making over time.
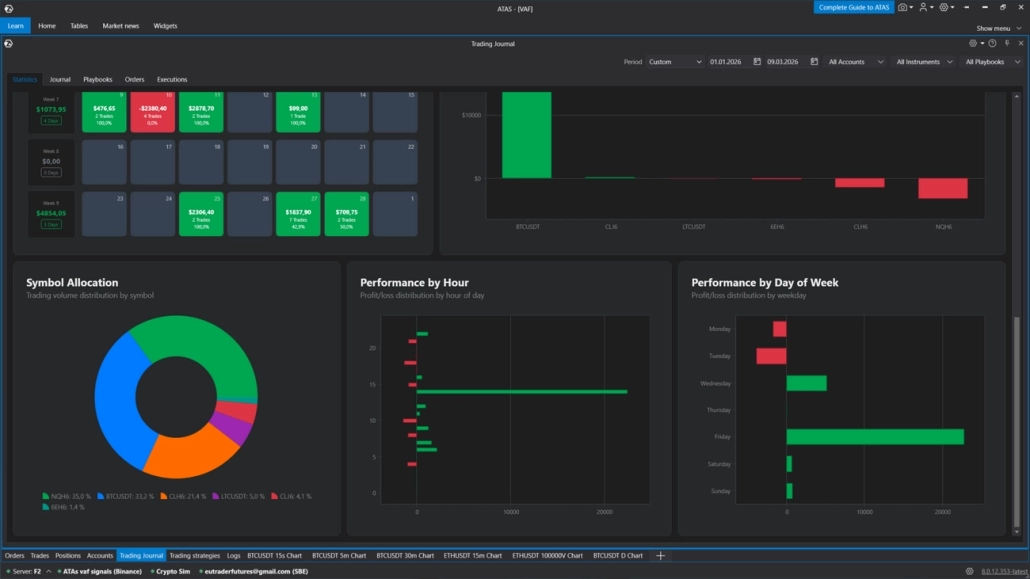
You can find all the information you need to further analyze your trading activity in the Trading Journal module.
FAQ
Crypto futures contracts are derivative instruments that let you trade cryptocurrency price movements without owning the underlying asset. Instead of buying Bitcoin or Ethereum, you’re trading a contract whose value tracks the market price.
You speculate on the direction of the market. If you expect the price to rise, you open a long position. If you expect it to fall, you open a short position. Futures trading uses margin and optional leverage, allowing you to control a larger position with a smaller amount of capital.
The key difference is ownership. In spot trading, you buy and own the cryptocurrency, which you can transfer to your own wallet. In crypto futures trading, you trade price movements through contracts without owning the underlying asset, while also gaining access to leverage and short selling.
The funding rate is a periodic payment exchanged between long and short traders in perpetual futures markets. Its purpose is to keep perpetual futures prices closely aligned with the spot market. When funding is positive, long traders pay shorts. When it’s negative, short traders pay longs.
Futures offer a wide range of trading opportunities; however, results depend on strategy, discipline, the quality of market analysis, and risk management. There is no guarantee of profit, and there is always a risk of losing capital. Past performance is not a guarantee of future results.
Crypto futures are considerably riskier than spot trading because they involve leverage, high market volatility, and the possibility of liquidation if the market moves against your position.
There is no universal answer. Beginners are generally better off using modest leverage (1x–3x, or up to 5x) while focusing on position sizing and risk management rather than maximizing potential returns.
On most major crypto exchanges, losses are typically limited to your margin because positions are automatically liquidated before your account balance turns negative. However, liquidation rules and risk controls vary between exchanges, especially during periods of extreme market volatility.
There is no single strategy that works in every market. Many professional traders combine Volume Profile, Open Interest, and Footprint charts to better understand market structure, liquidity, and order flow before making trading decisions.
Many exchanges allow you to start with as little as $10–20, thanks to fractional contracts and leverage. However, it’s generally wiser to begin with an amount you can afford to lose while still following proper risk management rules.
Key Takeaways
- Crypto futures let traders profit in both rising and falling markets.
- Leverage improves capital efficiency but also increases liquidation risk.
- The best trading strategy depends on current market conditions—there is no universal approach.
- Volume Profile, Footprint, and Open Interest provide insights that traditional candlestick charts cannot.
- Long-term success in futures trading depends more on risk management and discipline than on using high leverage.
- Reviewing and analyzing your trades regularly is one of the most effective ways to improve your trading performance.
Information in this article cannot be perceived as a call for investing or buying/selling of any asset on the exchange. All situations, discussed in the article, are provided with the purpose of getting acquainted with the functionality and advantages of the ATAS platform.
Subscribe
Get the latest ATAS news delivered conveniently