Cumulative Volume Delta (CVD) tracks the running difference between aggressive buy and sell volume, helping traders see whether buyers or sellers are applying more market-order pressure over time. This guide explains how CVD is calculated, how to read divergence and confirmation signals, how to configure ATAS CVD Pro, and how to analyze practical examples across futures and crypto markets.
During one of the updates in the ATAS platform in 2023, the Market Power indicator was renamed to CVD Pro. The full name of the indicator is Cumulative Volume Delta. It is widely used by traders when analyzing volumes.
What is Cumulative Volume Delta (CVD)?
Cumulative Volume Delta (CVD) is a running total of volume delta—the difference between trades executed by aggressive buyers and aggressive sellers. Instead of showing only the imbalance inside one bar, CVD accumulates that imbalance over time, making it easier to compare price movement with the underlying pressure from market orders.
When CVD rises, aggressive buying volume is dominating the calculation; when it falls, aggressive selling volume is dominating. The cumulative volume delta indicator is especially useful when its direction is compared with price, because agreement can support trend confirmation while disagreement can point to divergence or weakening order-flow pressure.
Cumulative Volume Delta Formula
Volume delta is calculated from trades executed at the ask and bid. Aggressive market buys execute against resting sell orders at the ask, while aggressive market sells execute against resting buy orders at the bid. CVD then adds each new delta value to the previous cumulative total.
Volume Delta = Ask Volume − Bid Volume
CVDn = CVDn−1 + Volume Deltan
For example, if a bar contains 1,200 contracts traded at the ask and 900 at the bid, its delta is +300. If the next bar has a delta of −500, CVD moves from +300 to −200. This is the key difference between volume delta and CVD: delta describes the imbalance for a selected bar or period, while CVD keeps a running total.
The Core Aspects of Delta and Cumulative Delta
For any trade to take place, the buyer and the seller must meet.
There is always a limit order in the trade (it is waiting for its execution in the order book) and a market order (it is executed immediately).
- If the initiative comes from buyers, Market-Buy is matched with Limit-Sell → in this case, the delta is positive and equal to the volume of the trade.
- If the initiative comes from sellers, Market-Sell is matched with Limit-Buy → in this case, the delta is also equal to the volume of the trade, but with a minus sign.
In bid/ask terms, trades initiated by market buyers contribute to Ask Volume, while trades initiated by market sellers contribute to Bid Volume. If 1,500 contracts trade at the ask and 1,100 at the bid during a bar, the volume delta for that bar is +400. CVD then adds this +400 to its previous value rather than starting from zero on every bar.
This distinction matters when reading the chart: volume delta shows the local balance of aggressive buying and selling, while CVD shows how that balance develops cumulatively. Price and CVD moving in the same direction can support trend confirmation; a growing mismatch between them may require closer analysis.
Delta represents effort or pressure. The higher the positive delta, the stronger buyers’ pressure. A negative delta represents sellers’ pressure. Examining the delta dynamics is a method to observe the battle between buyers and sellers on the exchange over time.
Read more about the mechanics of exchange trading and matching orders in the articles:
Start now!
Try ATAS free with no time limit
Comparison of Three Indicators
To understand the similarities and differences between Delta, Cumulative Volume Delta Pro and Cumulative Volume Delta Pro (Multi), let’s have a look at a screenshot of a minute chart from the cryptocurrency market (the main principle is the same for all markets).
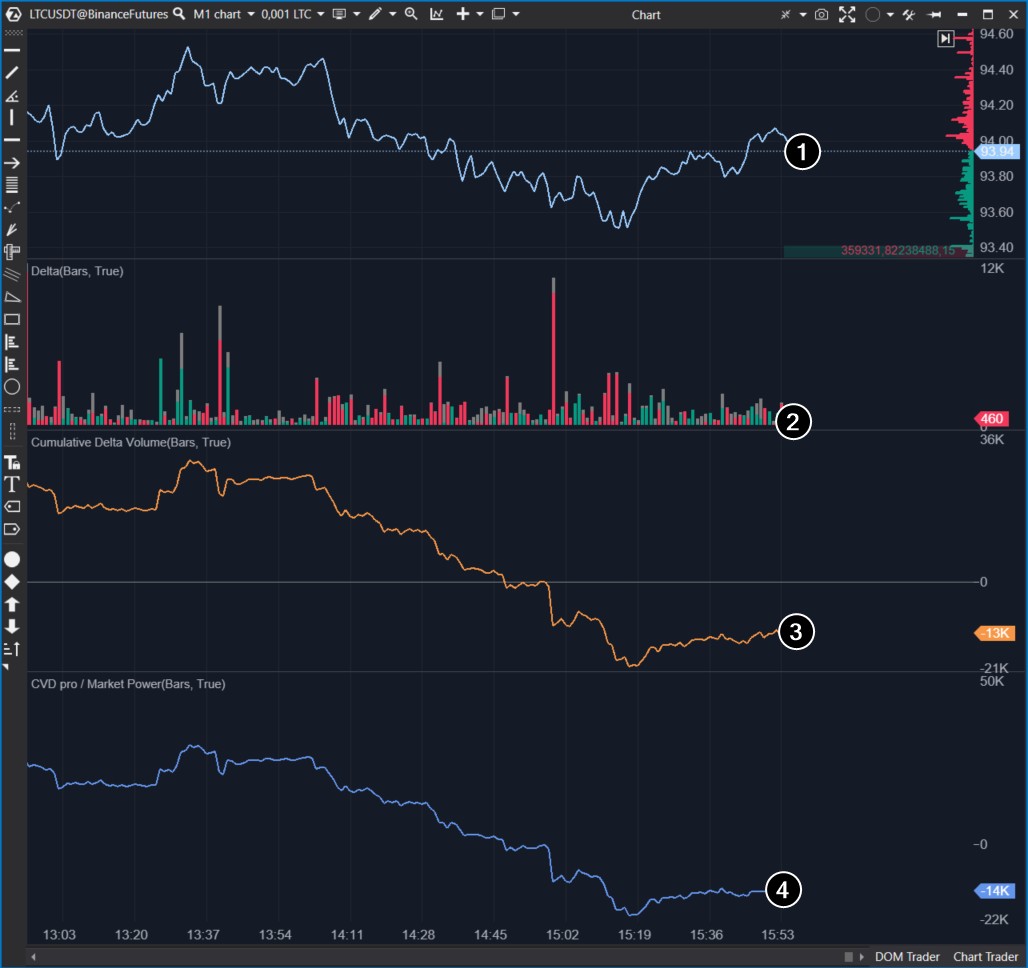
Numbers indicate:
- Linear price chart.
- Delta indicator.
- Cumulative Delta indicator. Each new value is added to the sum of the previous ones, which is why it is called “cumulative“. If you see a high red bar on the regular delta indicator, then on the cumulative delta indicator, there will be a corresponding decline (drop).
- Cumulative Volume Delta Pro indicator with default values. CVD Pro fully replicates the trajectory of the cumulative delta indicator. What is the difference?
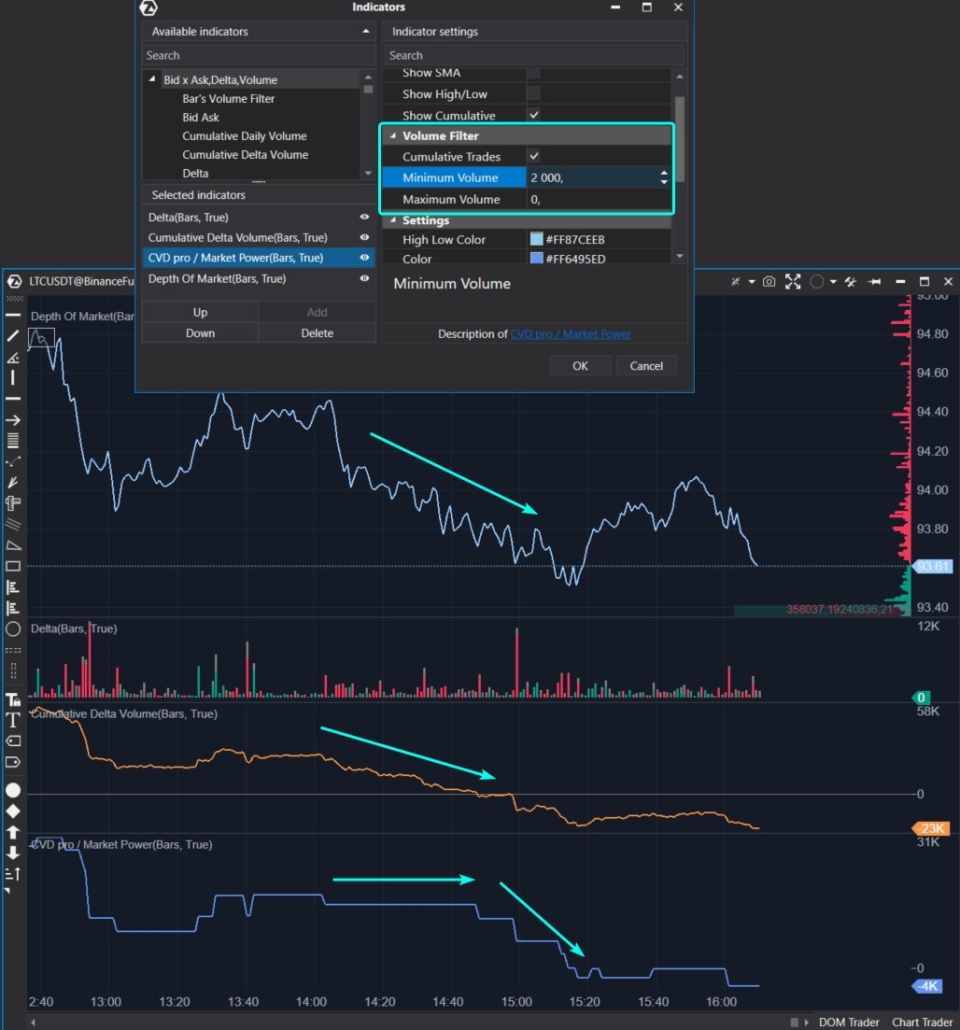
In the CVD Pro settings, there is an additional filter where you can set the minimum and/or maximum value of trade volumes that will be considered for calculating CVD Pro (see the example below).
For example, let’s set the Minimum Volume to 2000 and Maximum Volume to 0 (a zero value means that there is no upper threshold for the filter). With such settings, the indicator will display cumulative delta only for trades whose volumes exceed 2000 contracts (in this case, for futures from the LTCUSDT market).
We can make an interesting observation:
- the orange line of the cumulative delta gradually decreases as the price moves downward;
- the blue CVD line does not change at the beginning of the downward movement, but at the end of the movement it begins to fall — this is a sign of the culmination of the trend.
Thanks to the built-in volume filter, you can focus on changes in cumulative delta:
- only on large volumes (as shown in the chart above);
- only on small volumes;
- on volumes specified by “from and to” values in the filter.
Since each market is unique, the volume filter should be reconfigured when the market changes.
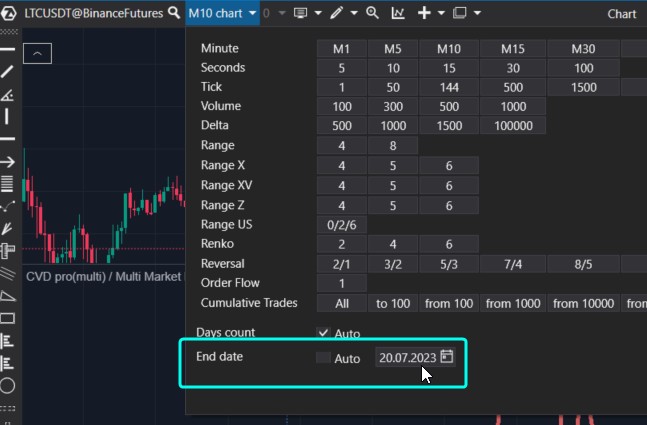
Another more technical feature is that to save resources, the indicator calculates only one day. If you need to study the dynamics of the CVD indicator on history, change the End Date setting in the timeframe settings menu, as shown below.
How CVD Pro (Multi) Works
If one CVD filter is not enough, you can:
- add multiple instances of the indicator to one window with different filter settings and different colors. To do this, specify the same value for the Panel parameter in each instance of the indicator;
- use CVD Pro (Multi), which has 5 built-in filters.
The screenshot below shows how the CVD Pro (Multi) indicator works. The filters are configured as follows:
- filter 1: trades with volume from 0 to 10;
- filter 2: trades with volume from 10 to 100;
- filter 3: trades with volume from 100 to 500;
- filter 4: trades with volume from 500 to 1000;
- filter 5: trades with volume from 1000 and higher.
The idea is simple — the larger the volume, the thicker the line.
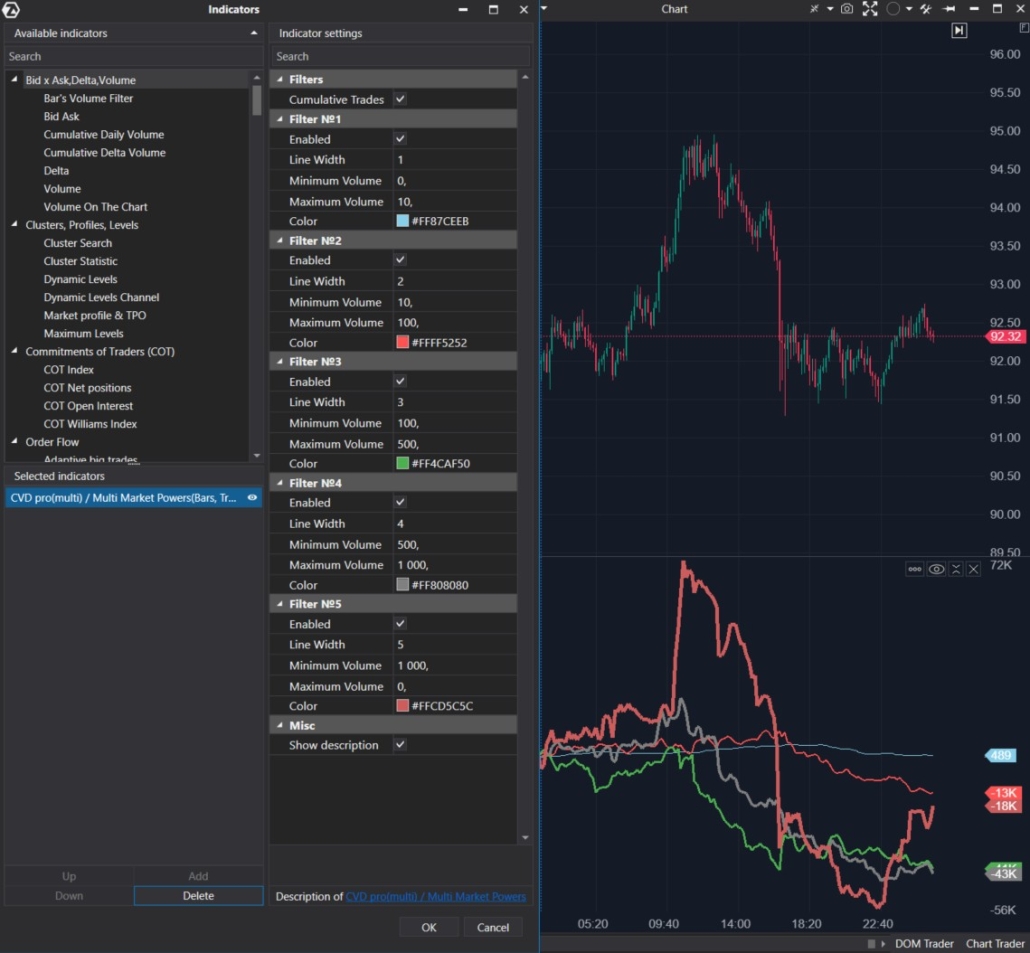
- The thinnest line likely indicates the activity of numerous small traders—it was moving upwards before a sharp price drop (small traders were buying near the peak). Due to the small volumes for calculating this line, its dynamics may not be visible enough. You can uncheck the “Enabled” box for the other lines to focus specifically on the line created based on the first filter.
- The spikes of the thickest line indicate a pause in the current movement: the thick line sharply went up at the price peak and sharply dropped at the day’s minimum. What is it? Are big players trading at a loss? But then they would not have big capital. Maybe a market maker is aggregating small one-sided trades to make them appear as trades from a large player? Who knows…
In any case, using filters to separate cumulative delta into components can provide valuable information for tracking the activity of trader groups with different capitalizations.
More entertaining examples will be provided later.
CVD Patterns: Divergence, Absorption, and Exhaustion
In an ideal scenario, price increase should be accompanied by a rise in the cumulative delta line, which would indicate buyers’ initiative.
In theory, when the market is in an uptrend, higher price peaks and troughs should correspond to higher highs on the cumulative delta indicator line. In fact, this is not always the case.
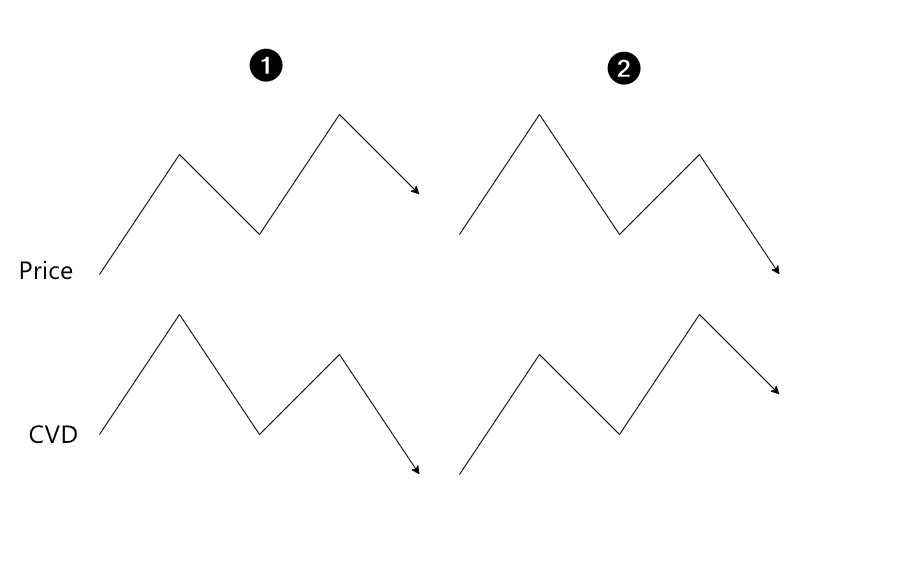
When analyzing a bull market, it is common to assume that:
- if the price forms higher peaks but CVD does not, it indicates exhaustion of the uptrend;
- if the price fails to form higher peaks but they are observed on the CVD line, it suggests absorption of the uptrend by limit sellers. You can easily observe this using the DOM Levels indicator, which visualizes the dynamics of large orders from the order book directly on the chart.
The opposite is true for a downtrend period.
Bullish CVD Divergence
A bullish CVD divergence appears when price makes a lower low while CVD does not confirm that low and forms a higher low or begins to rise. This can indicate that aggressive selling pressure is weakening or being absorbed. It may be an early sign of seller exhaustion, but it is not a standalone reversal signal.
Bearish CVD Divergence
A bearish CVD divergence occurs when price reaches a higher high while CVD fails to make a corresponding high. In this situation, the price advance is not confirmed by the cumulative balance of aggressive buying. The mismatch can point to buyer exhaustion or absorption by limit sellers and deserves confirmation from price behavior.
Hidden CVD Divergence
Hidden divergence is generally used as a trend-continuation clue rather than a reversal clue. For example, price may hold a higher low while CVD forms a lower low, or price may hold a lower high while CVD forms a higher high. Such differences can show that aggressive order flow is being absorbed without breaking the prevailing price structure.
Why CVD Divergence Needs Confirmation
CVD divergence shows a mismatch between price and aggressive order flow, not a guaranteed entry. A divergence can persist while price continues in the same direction. For that reason, traders can look for confirmation from market structure, the reaction at a key level, footprint-chart behavior, or signs that aggressive order flow is being absorbed or losing momentum before acting on a CVD divergence.
However, the market is more complicated in reality. Moreover, CVD lines created with different filters may sometimes demonstrate opposite dynamics, which provides valuable information for analysis.
Let’s go through a few practical examples to make it easier for you to start using Cumulative Volume Delta with filters if you have not done so yet. We will show an interesting trick for advanced users of ATAS: how to create an oscillator based on CVD.
Examples of Using CVD Pro
Examples of the CVD Indicator from the NQ Market
Let’s look at the behavior of the CVD indicator in the NQ futures market. We use the Range chart to smooth out the uneven trading activity within the day.
The CVD Multi indicator is configured as follows:
- the blue thin line is built based on the smallest volumes — 1 or 2 contracts;
- the red line of medium thickness is built based on relatively average volumes — from 3 to 15 contracts;
- the thick green line is built based on volumes from 16 contracts and above.
We observe a distinct stratification on the day when the technology stocks index was declining.
On July 20, 2023, the bearish price dynamics were driven by the negative Q2 report released by Tesla.
As seen from the blue line, small-cap traders did not believe that prices would continue to fall and showed initiative by buying futures.
Large-cap traders (green line) traded strictly in the direction of the intraday trend. This can also be interpreted as large orders influencing the market’s direction.
It is obvious that retail traders suffered a loss at the end of the day, in contrast to the “smart money”.
Another example with the same settings a couple of sessions earlier:
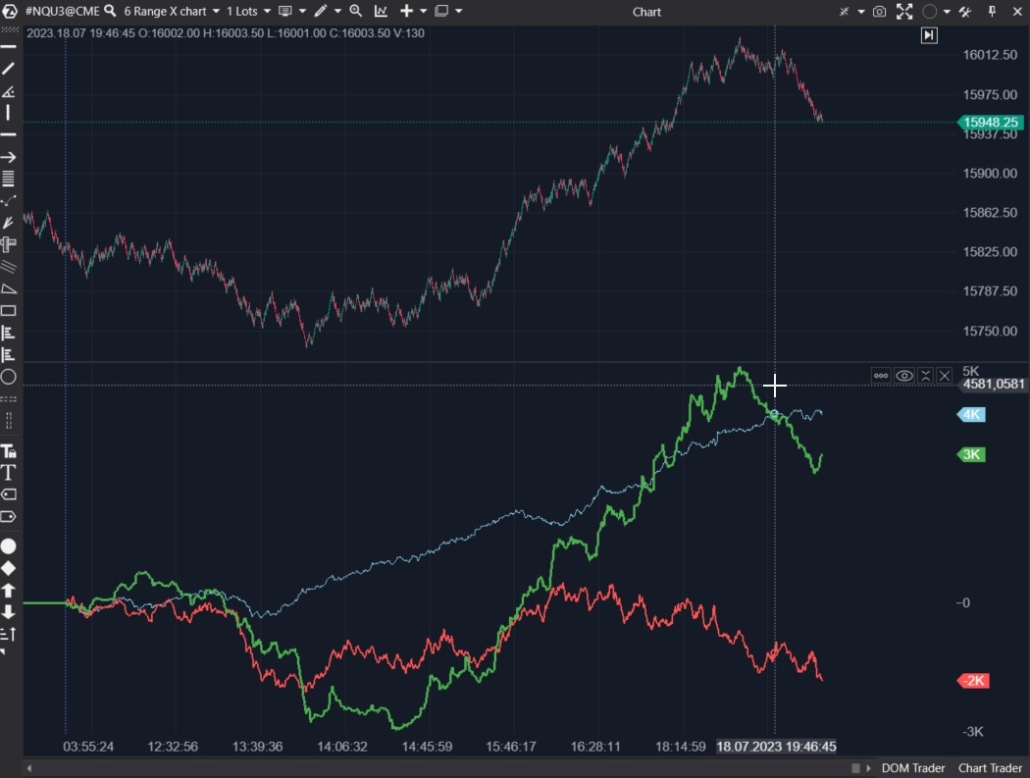
This time, large-cap traders also followed the trend:
- at the low point of the day, we observe a sharp drop in the green CVD line;
- the highest price of the day aligns with a peak on the green CVD line.
Traders who were trading 1-2 contracts missed the downward reversal towards the end of the day.
The red line shows the activity of traders who started to take the initiative to sell too early.
An Example of the CVD Indicator from the GC Market
Without changing the settings, let’s switch to the gold futures chart.
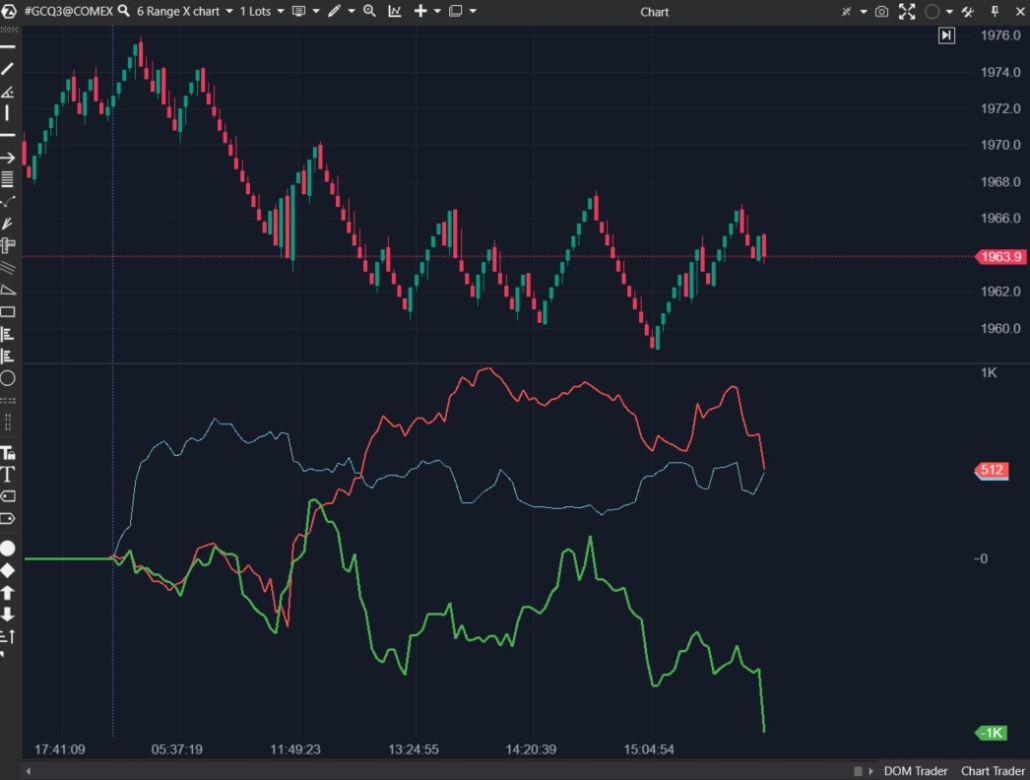
Traders with small capitalization were bullish from the very beginning of the day, which turned out to be a wrong decision.
Traders with medium volumes (the red line) attempted to catch the upward reversal at the beginning of the European session, but did they make a profit? Exiting without losses could have been a decent option.
Notice the sharp drop at the day’s price minimum. It occurred on the CVD line, which was constructed based on large volumes.
An Example of the CVD Indicator from the ETH Market
This is a five-minute chart of Ethereum futures from the Bybit exchange.
As seen from the candlestick dynamics, the day was bearish.
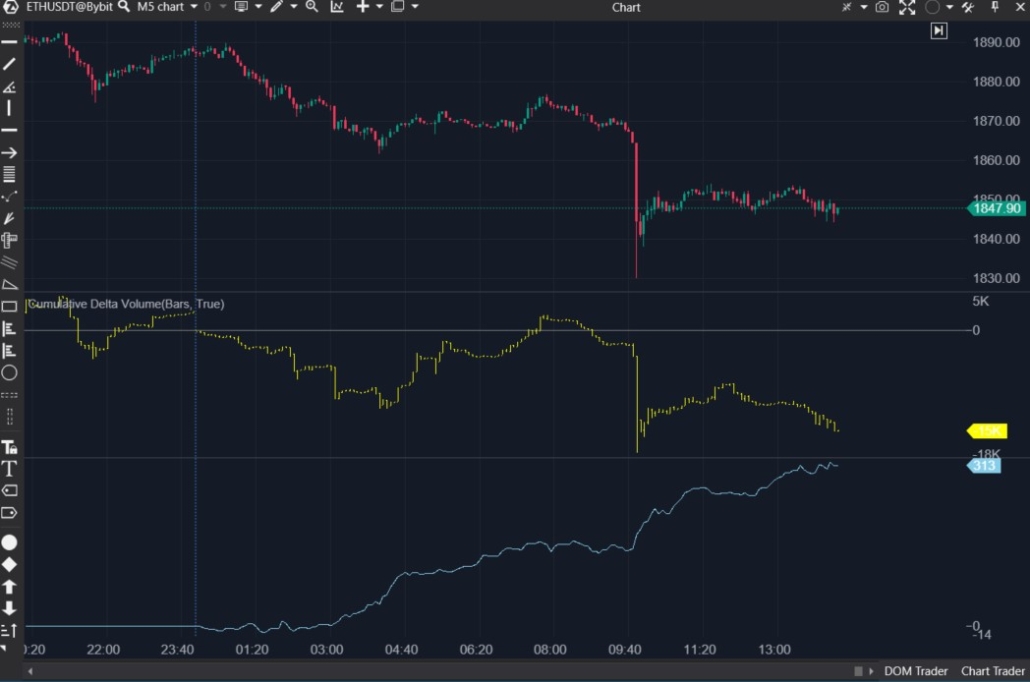
Yellow candles show the dynamics of the usual cumulative delta.
The blue line shows filtered CVD dynamics, excluding all trades with a volume below 1 ETH.
Comparing the dynamics of the yellow and blue lines, you can notice that:
- the yellow line most accurately reflects the price trend movements, possibly because it is predominantly influenced by market orders of large volume;
- the blue line reflects the sentiments of small traders who preferred buying against the trend at market prices.
An Example of the CVD Indicator from the DOGE Market
And here is another interesting example of how those who trade with small volumes make unfortunate decisions — below is the price chart of the meme token DOGE.
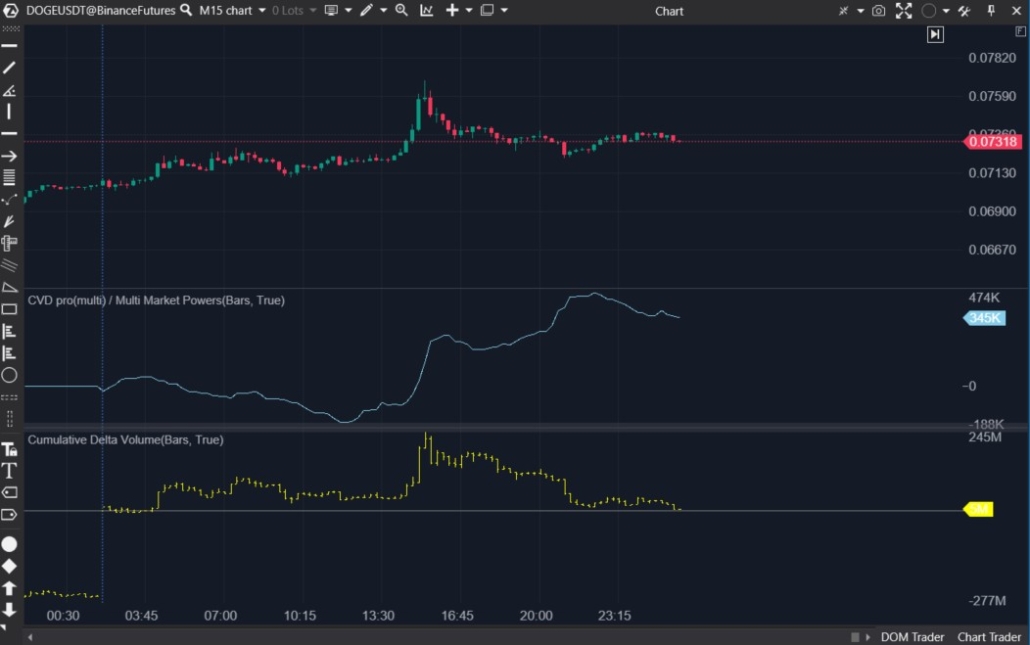
There was a price pump in the middle of the day. It may have had to do with Twitter and Musk. When the market “cooled down”, and the price dropped closer to its “moon launch” levels, the enthusiasm of small traders did not subside, and they continued buying. Big capital acted differently – the blue line (small traders) runs counter to the yellow one.
Conclusion: When CVD Helps and When It Needs Confirmation
CVD is most useful when it is read together with price. It can help show whether aggressive order flow confirms a trend, diverges from it, or suggests a possible shift in order-flow pressure. The cumulative volume delta indicator adds context to price movement, but it should not be treated as a standalone buy or sell signal.
CVD can also mislead when a divergence appears too early, when market conditions change, or when the selected filter does not fit the instrument being analyzed. A CVD divergence may continue for some time before price reacts, so confirmation from price structure, levels, and other order-flow tools remains important.
ATAS CVD Pro can make this analysis more specific by filtering trades by volume. This allows you to compare how groups trading different sizes behave instead of looking only at the aggregate cumulative delta. CVD Pro (Multi) extends the same idea by showing several volume filters in one indicator.
The practical value is not in assuming that one participant group is always right, but in observing whether different groups confirm or contradict the current price move. Used this way, CVD can support trend confirmation and help identify situations that deserve deeper analysis before a trading decision.
We should also mention the Market Replay simulator of the ATAS platform, which allows you to save time on trading education without risking your capital. For instance, you can develop and test your own trading strategy based on CVD in an environment that closely simulates real-market conditions.
Download Free Trial ATAS. It is free. During the trial period, you will get full access to the platform’s tools to experiment with the CVD Pro indicator and others. Moreover, you can continue using the program for free even after the 14-day trial period is over, whether it is for cryptocurrency trading or volume analysis.
That ATAS platform:
- enables you to download tick history from the futures, stocks, and crypto markets so that you can get a detailed picture of the market;
- provides many benefits for traders who want to combine bounce trading with user-friendly cluster charts and useful indicators.
FAQ
Cumulative Volume Delta shows the running balance between aggressive buy volume and aggressive sell volume. A rising CVD means buy-side market orders are dominating the cumulative calculation, while a falling CVD means sell-side market orders are dominating. Traders usually compare this behavior with price rather than interpret CVD in isolation.
Delta measures the difference between aggressive buy and sell volume for a selected bar or period. Cumulative delta keeps adding each new delta value to the previous total. Delta therefore shows a local imbalance, while CVD shows how that imbalance develops over time.
CVD divergence is a mismatch between the direction or swing structure of price and Cumulative Volume Delta. For example, price may make a higher high while CVD fails to confirm it. Divergence can point to changing pressure or a loss of confirmation, but it needs confirmation because the mismatch can persist.
CVD can be useful for scalping when a trader needs to compare very short-term price movement with aggressive order flow. It is more informative when used with context such as market structure, key levels, footprint charts, and appropriate volume filters rather than as a standalone trigger.
There is no single best timeframe for CVD. The useful setting depends on the instrument, trading style, and the behavior a trader wants to study. Intraday traders may focus on shorter periods, while broader analysis may require more history. In ATAS, CVD settings and volume filters should be adjusted when the market changes.
CVD can be applied to crypto and other markets when the data feed provides executed trades that can be classified by aggressive buying and selling. For crypto, the result reflects the exchange or data source being analyzed. In decentralized spot forex, there is no single consolidated exchange tape, so CVD reflects only the available provider or venue data.
Information in this article cannot be perceived as a call for investing or buying/selling of any asset on the exchange. All situations, discussed in the article, are provided with the purpose of getting acquainted with the functionality and advantages of the ATAS platform.
Subscribe
Get the latest ATAS news delivered conveniently