The order book is exchange-provided Level 2 data that shows the total amount of active limit buy (bid) and sell (ask) orders at each available price level.
Its value lies in reflecting the real-time balance of supply and demand. Combined with order flow data, the order book can help traders evaluate liquidity, identify important price levels, and build short-term trading hypotheses. However, using it effectively comes with certain challenges. In this article, we will discuss how to overcome them and outline key strategies to help you trade more efficiently.
Start now!
Try ATAS free with no time limit
What Are Order Book Trading Strategies?
Order book trading strategies are approaches that use resting bid and ask liquidity to assess where buyers and sellers may become active. Common order book analysis techniques focus on large limit orders, changes in order book depth, bid-ask imbalance, breakouts of liquidity levels, false breakouts, and rapid shifts in displayed liquidity. Because resting orders can be changed or canceled, traders usually combine this information with executed order flow and price action rather than treating the order book as a standalone signal.
How the Order Book Works
An exchange matches buyers and sellers, while the order book organizes active limit orders by side, price, and queue priority. This process works similarly across futures, cryptocurrencies, and stocks.
Exchange algorithms continuously receive new orders, update or remove existing ones, and execute trades when compatible buy and sell orders meet. As a result, the order book changes in real time and shows where resting liquidity is currently concentrated.
Learn more about how buyers and sellers are matched on an exchange:
Where to Find the Order Book?
It depends on the exchange and the application interface. Order book data is commonly provided as Level 2 or market depth data and displayed through a Depth of Market (DOM) interface. The available order book depth determines how many bid and ask price levels you can see above and below the current price. For instance, on the classic BinanceFutures, the order book is displayed on the right side of the screenshot (1):
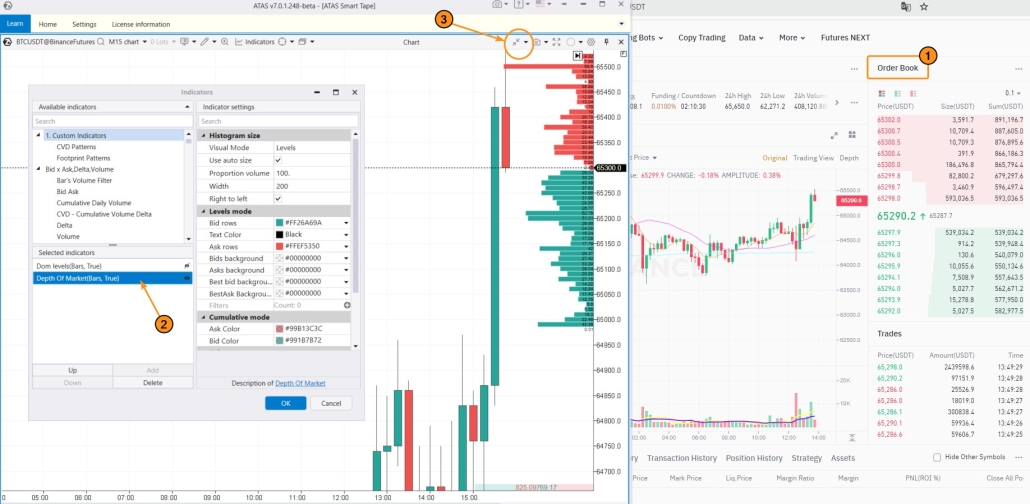
On the left side of the screenshot, you can see how the order book is displayed on the ATAS platform.
To access this interface: download, install, and launch ATAS > open a chart by selecting an instrument. By default, the Depth of Market (2) indicator is applied to the chart, which directly displays Level 2 order book data. The visualization is clear: the larger the bar (red or green), the greater the volume of orders at that level.
If needed, you can customize the indicator by opening the indicator manager (Ctrl+I) > selecting Depth of Market and adjusting the settings, such as colors, cumulative values, and other parameters. You can also merge several levels into one using the Scale function from the menu (3).
Learn more on the topic:
Distinguishing features of the order book:
The order book is characterized by extremely dynamic updates as traders’ orders are placed in large volumes every second:
- to access real-time data from the order book, you need an active online connection to a live exchange;
- the characteristics of the order book can vary significantly depending on the market due to factors like liquidity, volatility, market-making bots, and more.
How to Track Order Book Changes Over Time
For a more effective analysis of how prices interact with major levels in the order book, it is recommended to use the DOM Levels indicator, which records order book changes over time on the chart. For additional context, a heatmap can also make it easier to track how liquidity builds, shifts, or disappears over time.
Simply put, you can view the order book’s history.
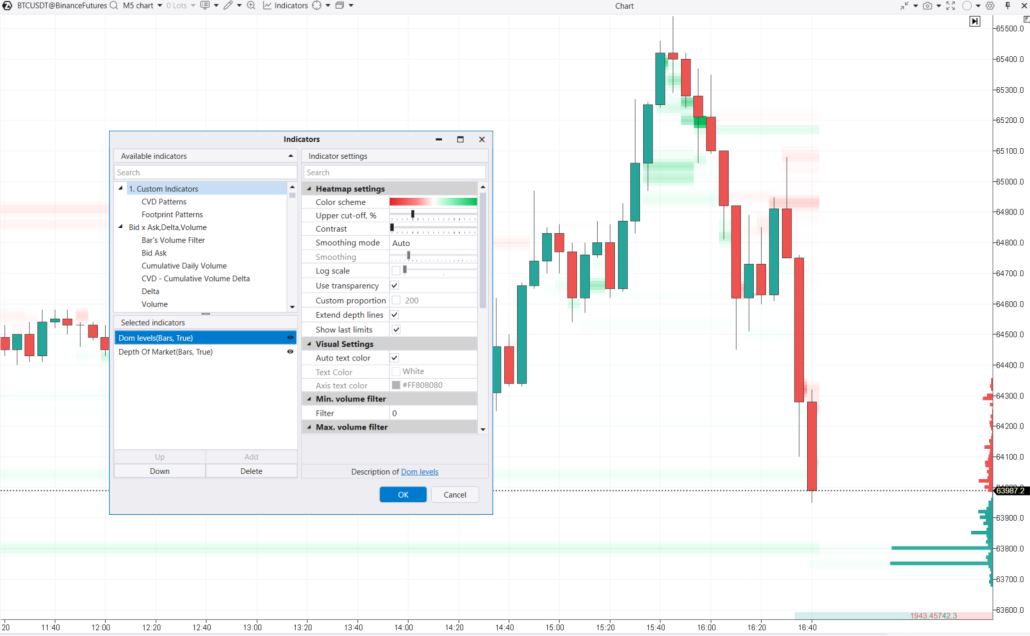
The screenshot above shows how you can use DOM Levels to track the movement of significant levels over time. For instance, around the 63,800 mark, the order book displays two levels (green lines below the price) with large bid volumes, but only the upper level (precisely at 63,800) remains constant for several hours.
Note. The DOM Levels indicator loads order book history data from ATAS servers. Due to the large volume, this data is not available for all markets. For more details about the indicator, refer to the Knowledge Base.
How to Read Order Book
In theory, if there are a lot of sell orders at a certain level, it will be harder for the price to push through that resistance. The opposite is true for the support.
In practice, though, the way the price interacts with major levels in the order book can be more complex. A visible bid-ask imbalance can highlight where resting liquidity is concentrated, but it should be interpreted together with actual executions and price reaction.
Example. Let’s have a look at the Bitcoin price chart (data from the BinanceFutures exchange) with the DOM Levels indicator added. The Delta indicator helps you interpret the order book; for instance, when demand absorbs large sell orders, you will see a high green bar on the Delta. The chart also includes the standard Volume indicator.
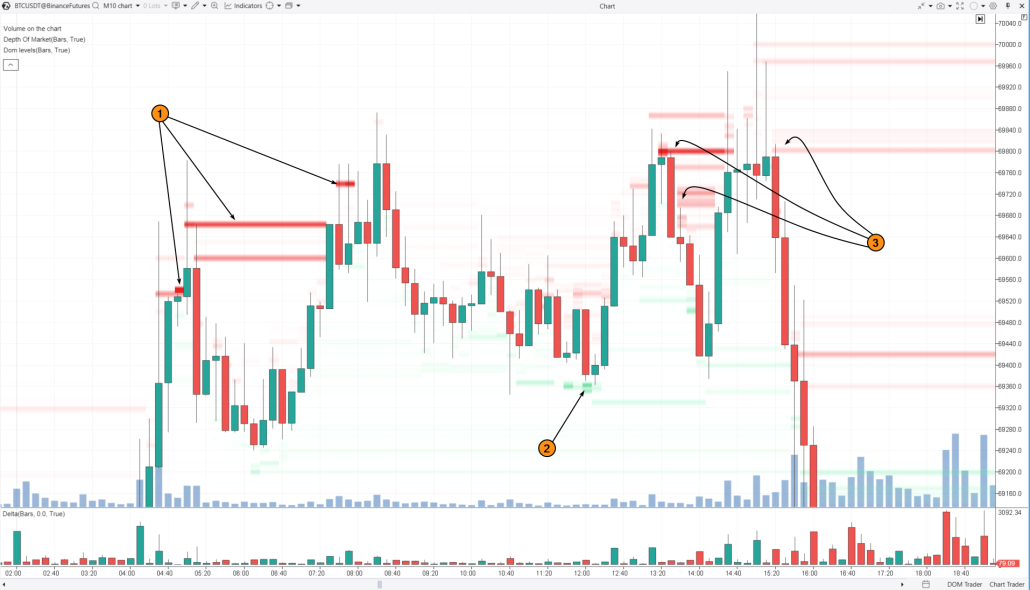
Bright red levels (1) on the left indicate prices where large sell orders were placed in the order book. This indicates that sellers are active as the price nears the psychological level of $69k, but it does not guarantee that the price will not break through from below. This pattern might suggest that a major player has bearish intentions — using current market demand to gradually close their long positions and/or open shorts ones.
As a result, the price pulls back to point (2). Around the 69,360 level, buy orders start appearing in the order book. These act as support, keeping the price from falling further. The major player might be preventing the price from dropping below this level because they have not fully finished closing their long positions or opening shorts.
In the following hours:
- large sell orders increasingly impact the price as a bearish factor, causing it to drop away from these levels (3);
- the price makes a false breakout of the $70k psychological level — this helps to find liquidity from buyers and completes the distribution phase before the price begins to decline.
Trading Strategies Using the Order Book
It is important to remember that price patterns and key levels from the order book can vary across different markets. Interpreting large volume levels and the intentions of so-called “smart money” is more like forming hypotheses — they can be accurate or completely wrong. No one can guarantee future price movements.
Trading with a Major Player Strategy
This strategy involves buying just before significant buy limit orders. The opposite approach is used for selling.
Example. 3-minute chart of BNBUSDT, BinanceFutures data:
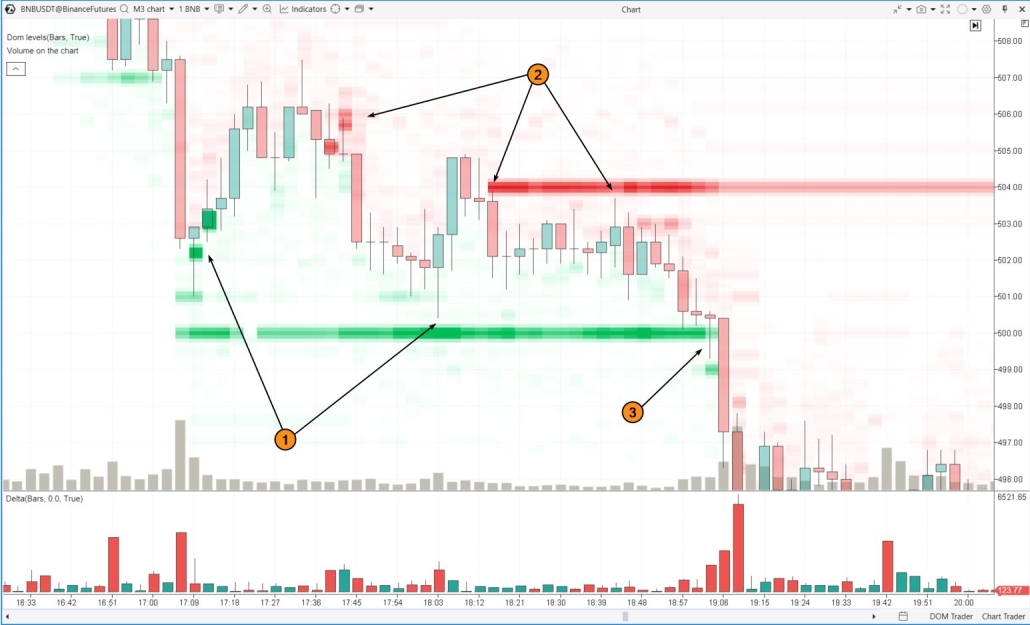
This example demonstrates how to use large orders from the order book to identify support and resistance levels for entering long or short positions.
(1) the bright green DOM Levels highlight large orders that have been supporting the price and boosting demand. According to this strategy, you could open long positions near these bright green levels, set a stop-loss just below them, and aim to profit from the upward momentum, which is often short-lived.
(2) the opposite applies for short positions.
Number (3) indicates a long entry signal that did not work out. It became a signal for a breakout trade.
Breakout Strategy
This strategy involves buying when momentum breaks through significant resistance (large sell limit orders at a key level in the order book). The opposite approach is used for selling.
Note that in the previous chart, it is also a support breakout around the $507 level in the upper left corner. After the breakout, this support level became resistance.
Another example. 3-minute Bitcoin price chart with the same set of indicators.
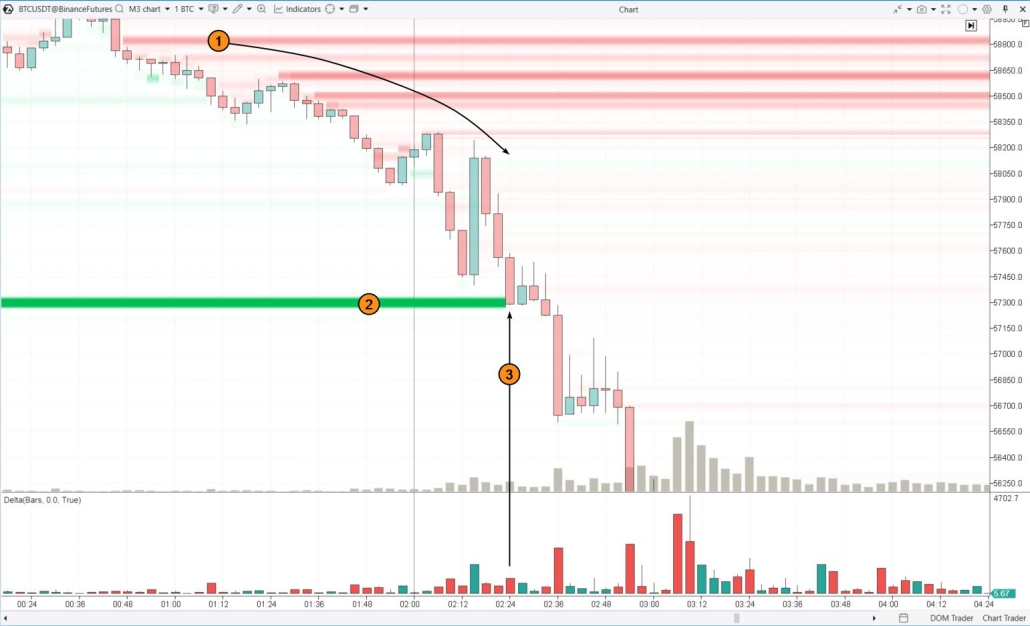
(1) Large sell orders in the order book are exerting pressure on Bitcoin’s price. As time goes on, new sell orders emerge at lower levels, causing a cascading downward movement.
(2) The bright green line indicates a large buy order. It acted as a temporary barrier against the strengthening downtrend.
(3) On this candle, the green line breaks — either the buy orders were absorbed by sellers, or they were canceled under pressure. As a result, the price formed two candles that closed far from the highs (indicating weak bounces) and accelerated its decline.
When the price breaks to new lows under pressure, breakout traders can capitalize on these moments by joining the downward momentum, while protecting their short positions with tight stop-losses.
Alternatively, one might wait for the price to retrace to the breakout level (where the large buy order was in the order book) and enter on what is known as a “breakout test.”
Here is an example (this is an NQ futures chart) that clearly illustrates the concept:
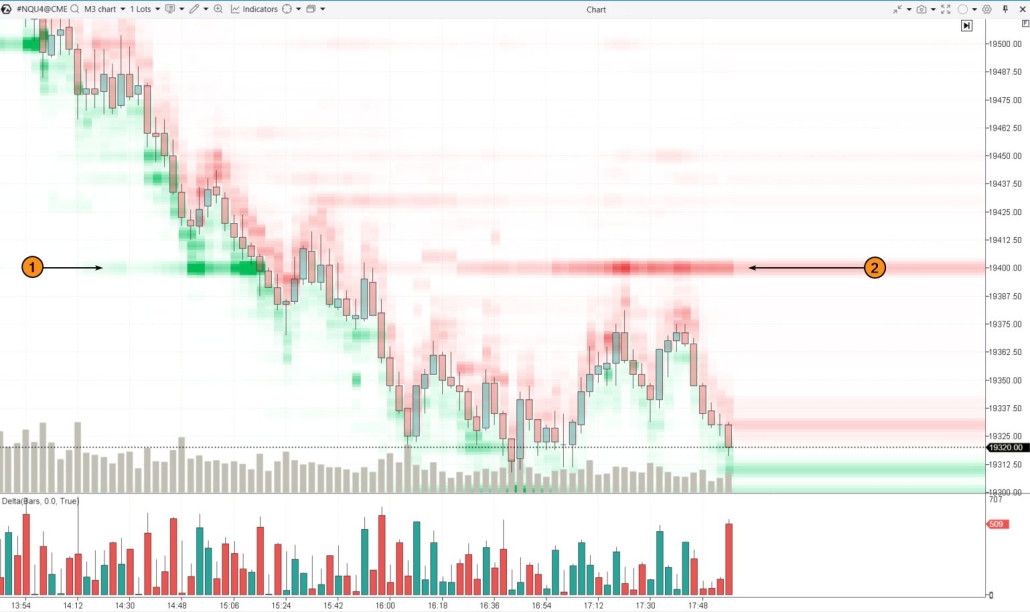
Initially, the 19400 level acted as support (1), as large buy limit orders were placed there in the order book. However, after the breakout, the situation changed — now sell orders are being placed at this level (2), and buyers are hesitant to approach it.
False Breakout Trading Strategy
This strategy involves entering a long position after the price breaks through a significant level with large buy orders (a bearish sign), but then recovers and stays above that level (indicating a false breakout).
For selling, the approach is reversed. Let’s look at how this works with the example below.
Example. 3-minute chart of Nasdaq futures.
(1) This is the same 19400 level from the earlier chart. It was broken at the start of the American session (UTC time in the chart). The breakout turned out to be false. Wide price swings are common at the start of a major session, especially if the previous day was volatile. Then buyers renewed their efforts, and the price moved above the 19400 level, which then acted as support.
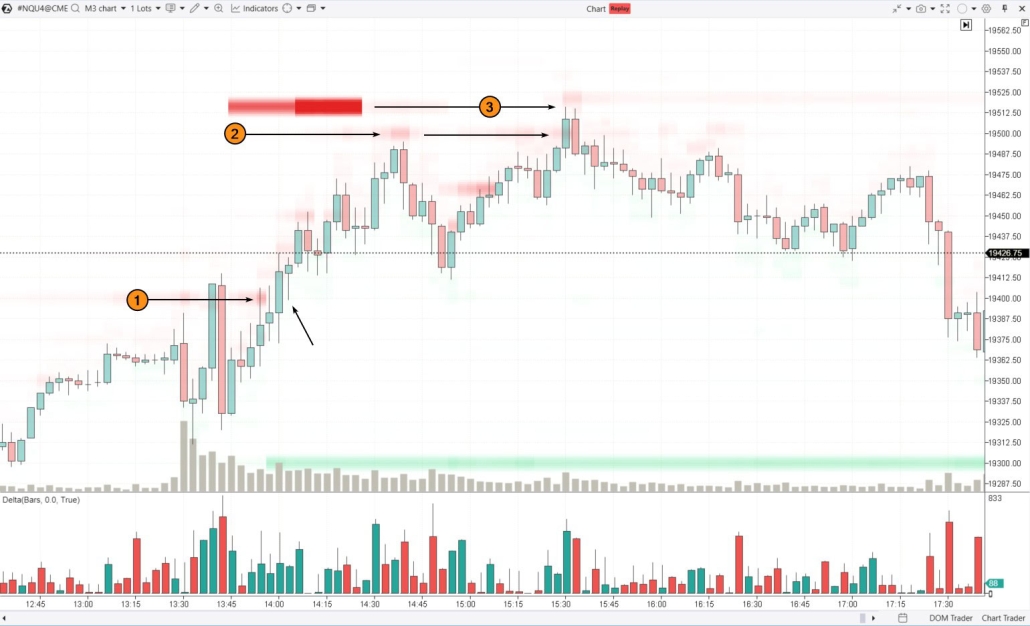
(2) The price continued to rise to the 19500 level, where sell orders were observed around 14:40. By 15:30, buyers had broken through this level (notice the spike in positive delta).
The price then rose to 19520, where sell orders had previously been spotted in the order book. It was not attacked by the bulls, the price reversed at this resistance and closed on the next candle below 19500 with a negative delta. This resulted in a bearish engulfing candlestick pattern, confirmed by the change in color on the delta indicator and the false breakout of resistance at 19500. This turned out to be the day’s high. Selling on this false bullish breakout at 19500 could have been a very accurate trade, making it a solid example to highlight on social media.
Manipulation Trading Strategy
The core idea is that market participants often react to the appearance of large orders in the order book. However, displayed liquidity is not always a reliable signal because orders can be modified or canceled before execution.
Spoofing is a form of manipulation in which large visible orders may be placed to create the impression of strong demand or supply and then canceled before they are filled. This can create fake liquidity and influence other traders’ decisions. Repeated large-order cancellations, orders that move away as price approaches them, and abrupt shifts between the bid and ask sides can be warning signs, although a cancellation by itself does not prove manipulation.
Traders should also distinguish spoofing from hidden orders and iceberg orders. An iceberg order intentionally displays only part of its total size and may repeatedly replenish as trades execute against it. Such behavior can reveal genuine hidden liquidity rather than manipulation, so confirmation from executed order flow, Delta, footprint data, and price reaction is important.
For example. When large buy orders appear near the current price in the order book, market participants might react by opening long positions. The opposite is true for short positions.
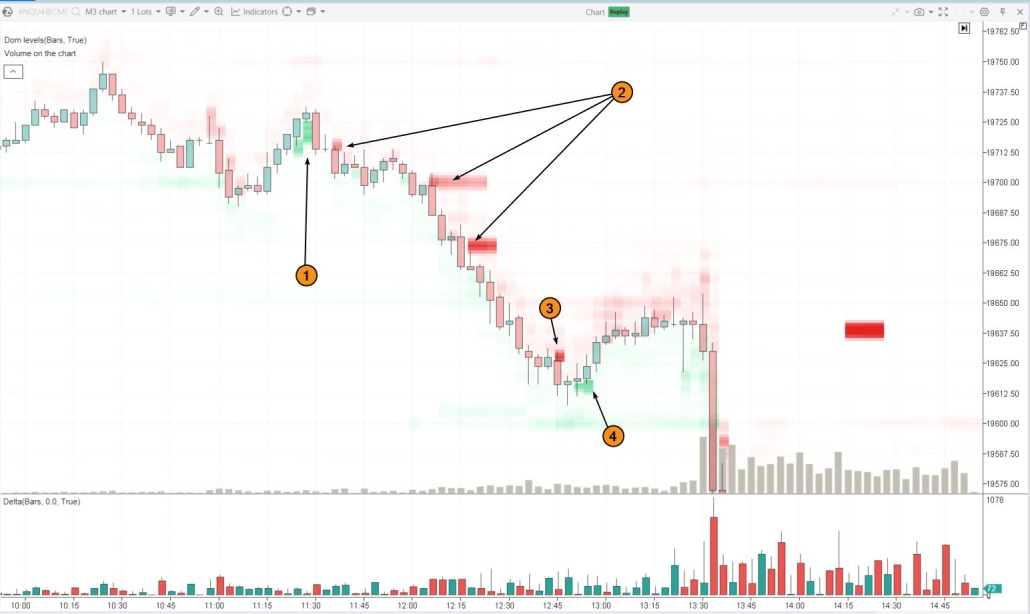
Number (1) on the chart illustrates this scenario. Limit buy orders just below the current price encouraged traders to go long. However, this might have been a trap set by smart money to find liquidity from buyers and establish short positions.
Soon after, the situation changed: the large buy orders turned red (indicated by arrows 2). These orders put significant pressure on the price, pushing it lower over time until another manipulation occurred.
Number (3) shows sell orders in the book, which prompted traders to sell more (increasing panic). The price did drop, but smart money might have used this as an opportunity to buy back contracts and close (possibly partially) their short positions.
Number (4) indicates genuine signs that buyers became active. However, this did not last long, and with the start of the main session, the downward movement resumed.
When trading based on market manipulation, a trader should monitor situations where sentiment shifts rapidly within a narrow range, large orders are repeatedly canceled or replaced, and visible liquidity changes faster than executed order flow confirms it. These patterns can indicate spoofing or an attempt to trap market participants, but they should not be treated as proof on their own.
Learn more about order book manipulations! Read the article: “What Is Spoofing?“
To wrap up the discussion on order book trading strategies, it is important to note that large volumes in the order book often act as support and resistance levels. This gives traders opportunities to use strategies based on price reversals from these levels, breakouts, or false breakouts. However, it is important to keep a few key factors in mind:
- be mindful of potential manipulations within the order book;
- manage your risk by setting protective stop orders to minimize potential losses;
- analyze the context to understand what those large volumes in the order book truly represent.
Pros and Cons of Order Book Trading
Pros
|
Cons
|
FAQ
In simple terms, it is a compiled list of all active buy and sell orders, organized by price levels.
The order book helps day traders assess supply and demand, spot potential support and resistance levels, and monitor for possible market manipulation.
It can be used to find entry points, develop new trading strategies, and improve the effectiveness of existing approaches. The order book is especially valuable for scalpers and intraday traders.
In most cryptocurrency exchange interfaces, the order information is displayed by default and is labeled as the Order Book. If it is disabled, follow the instructions to enable order display in the settings.
This term refers to the number of levels above and below the current price for which order information is available. In demo versions, providers may limit the depth of data being transmitted.
It is the cumulative information of all buy and sell orders.
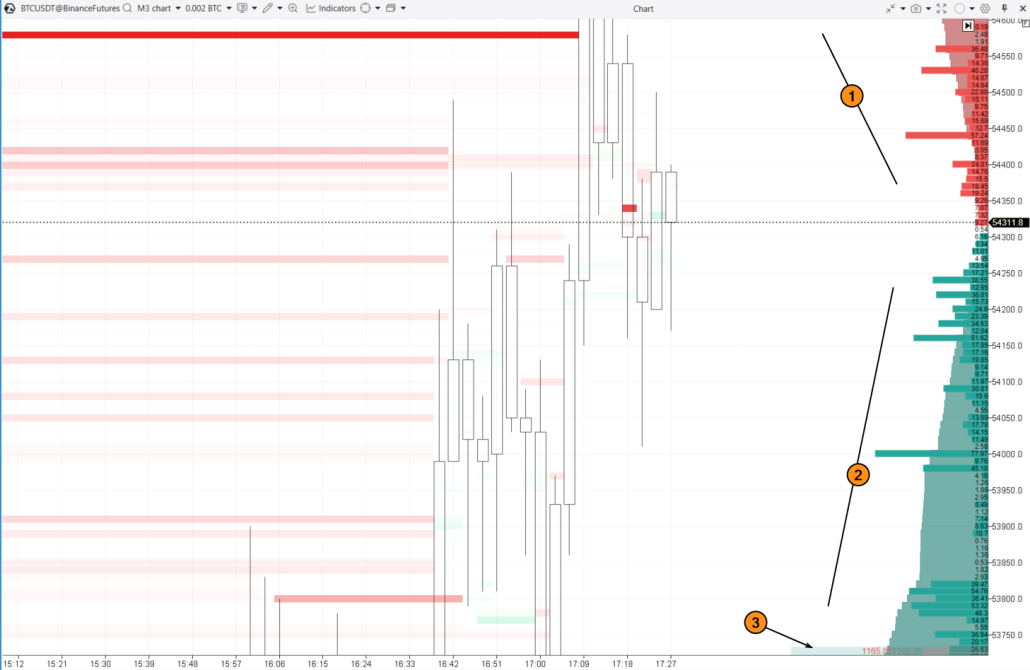
On the ATAS platform, this is visualized as a red area (1) extending upward and a green area (2) extending downward, with the total displayed as numbers at the bottom of the indicator. All parameters are customizable.
There is no single best strategy for every market condition. Traders may use large liquidity levels for reversals, trade breakouts or false breakouts, or monitor rapid changes in displayed orders. The key is to confirm the setup with price action and executed order flow and to define risk before entering a trade.
Potential fake orders may appear as unusually large orders that repeatedly show up and disappear before price reaches them, move away as price approaches, or are canceled without corresponding executions. These patterns can be associated with spoofing, but no single cancellation proves that an order was fake.
Order book imbalance is a difference between the amount of resting buy and sell liquidity at selected price levels. A strong bid-ask imbalance can suggest that one side of the book is more heavily represented, but the signal can change quickly as orders are added, executed, or canceled.
It can be. Level 2 data and order book depth can help scalpers see nearby liquidity, short-term support and resistance, and rapid shifts in supply and demand. Because these signals can change within seconds, scalping setups are usually combined with executed order flow, a predefined stop-loss, and a realistic take-profit target.
How to Learn Trading Using Order Book Signals
Trading with the order book is all about developing the skills to interpret and respond to the movements of large volumes in the order book.
To assess how effective your order book trading can be, try the ATAS Market Replay simulator. This module within the ATAS platform utilizes historical data to replicate real-time trading conditions.
Traders can hone their skills in completely real conditions, avoiding any financial risks. It is an excellent way to practice and boost your trading effectiveness.
To try the simulator, download the ATAS platform for free, install, and launch it, and then:
- Open a chart of a financial instrument.
- Click on the Market Replay button in the main ATAS menu.
- Activate the Replay mode (the icon should turn green).
- Adjust the settings. To ensure the order book data is displayed during playback, select a data type that supports DOM Level II.
- Start the playback and monitor the interaction between price and volumes from the order book using DOM Levels or DOM Trader. Look for confirmations on the footprint chart or using indicators (below are examples of patterns using order book volume levels).
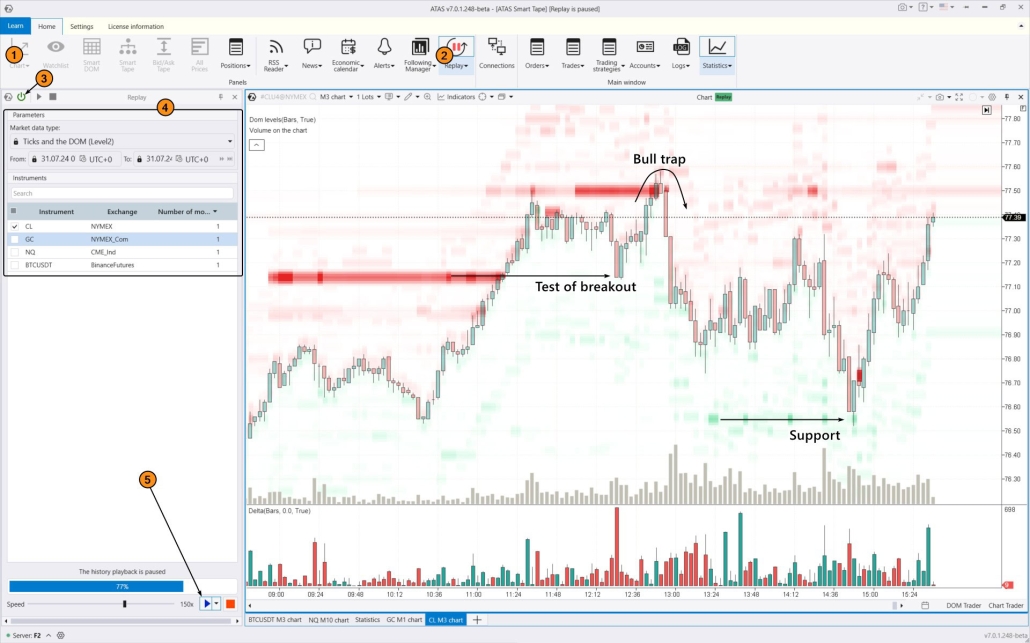
When practicing trading patterns in the Market Replay simulator, you can:
- use Chart Trader and other features to trade on the built-in demo Replay account and then analyze your performance;
- adjust the playback speed, and pause;
- analyze footprint charts;
- use more than 400 indicators;
- use drawing objects, for example, mark support and resistance levels;
- use various chart types (e.g., non-standard Range XV);
- use exit strategies;
- do many other things to learn how to use order book data for making trading decisions when others are guessing or falling into traps.
ATAS enables you to access tick data from cryptocurrency, stock, and futures markets. This gives you a comprehensive dataset to spot patterns in how price and volume interact, which can help improve your trading strategy.
Conclusions
Order book trading is based on reading how resting bid and ask liquidity interacts with price. Large liquidity levels can act as temporary support or resistance, while breakouts, false breakouts, bid-ask imbalance, and rapid changes in displayed orders can form the basis of short-term trading strategies.
No order book signal should be interpreted in isolation. Level 2 data can change quickly because orders may be added, canceled, hidden, or partially displayed. For stronger confirmation, combine order book analysis with executed order flow, Delta, footprint charts, volume, DOM Levels, heatmap visualizations, and the actual price response around the level.
Risk management remains essential. Before entering a trade, define where the setup becomes invalid, place a protective stop-loss accordingly, and plan a realistic take-profit or exit method. This is especially important for scalping and other intraday strategies, where both the opportunity and the risk can develop very quickly.
ATAS provides tools for analyzing order book depth, historical liquidity, executed volume, and order flow in one workspace, which can help traders test these ideas and evaluate them in context before applying them in live trading.
Download ATAS. It is free. Once you install the platform, you will automatically get the free START plan, which includes cryptocurrency trading and basic features. You can use this plan for as long as you like before deciding to upgrade to a more advanced plan for additional ATAS tools. You can also activate the Free Trial at any time, giving you 14 days of full access to all the platform’s features. This trial allows you to explore the benefits of higher-tier plans and make a well-informed decision about purchasing.
Information in this article cannot be perceived as a call for investing or buying/selling of any asset on the exchange. All situations, discussed in the article, are provided with the purpose of getting acquainted with the functionality and advantages of the ATAS platform.
Subscribe
Get the latest ATAS news delivered conveniently