Many traders genuinely love using a break even approach. The scenario seems perfect: the price moves slightly in your favor, you move your stop to break even (right to your entry level), and you continue to analyze the market with a sense of total security. Unfortunately, statistics quickly destroy this illusion.
Backtests conducted by the research team at Quantified Strategies show that the habit of moving your stop to zero at the first opportunity heavily cuts into long-term profitability. This is especially noticeable in trend-following strategies, where the market needs room to breathe.
Van Tharp, a renowned expert in trading psychology and risk management, also emphasized that in these moments, we are driven by fear rather than cold logic. We are simply afraid to lose the small, unrealized profit the market has just shown us. As a result, we protect pennies but miss out on truly powerful market movements.
In this article, we will break down both sides of the coin. You will see how a premature stop adjustment ruins the mathematical expectation of a trading strategy. More importantly, we will cover four specific tactics that will help you make decisions based on volume analysis and order flow, rather than raw emotions.
Start now!
Try ATAS free with no time limit
⚠️ Disclaimer: All calculations, formulas, and risk management tactics presented in this article are for informational and educational purposes only. They do not constitute, contain, or intend to serve as financial, investment, or trading advice. Past performance of analytical models does not guarantee future market results. ATAS provides sophisticated analytical software for market research, but all trading decisions and real capital risk parameters are solely the responsibility of the individual user.
What Is Breakeven in Trading? Definition and Key Distinctions
Before diving into the numbers, it is crucial to clarify a common point of confusion. In traditional business economics, the break-even point refers to the production or sales volume where total revenues exactly equal total expenses. In the financial markets, however, the break even meaning shifts from operational volume to a specific price level on a chart.
In trading, what a breakeven point configurations look like is a state where an active position shows a net financial result of exactly zero. When market participants talk about “moving a stop to break even,” they mean adjusting the protective stop-loss level directly to the entry price to eliminate further downside risk on that specific setup.
Breakeven / Break Even Point
A state where an active position shows a net financial result of exactly zero. To “move a stop to break even” means adjusting the protective stop-loss level directly to the entry price, eliminating formal downside risk on that specific position.
Understanding what does break even mean in a live market environment helps you evaluate structural risk. If the price returns to this baseline, the simulated position closes with no financial loss but no profit either.
However, the theoretical entry price and the actual execution level often differ. To find a true market baseline, any functional analysis must incorporate operational frictional costs like spreads, execution slippage, and overnight swaps.
How Break Even Works: a Real Example of Position Sizing Trading
To understand the difference between an analytical approach and emotional bias, let’s examine a specific chart study. Below is a 3-minute gold futures cluster chart analyzed in ATAS.
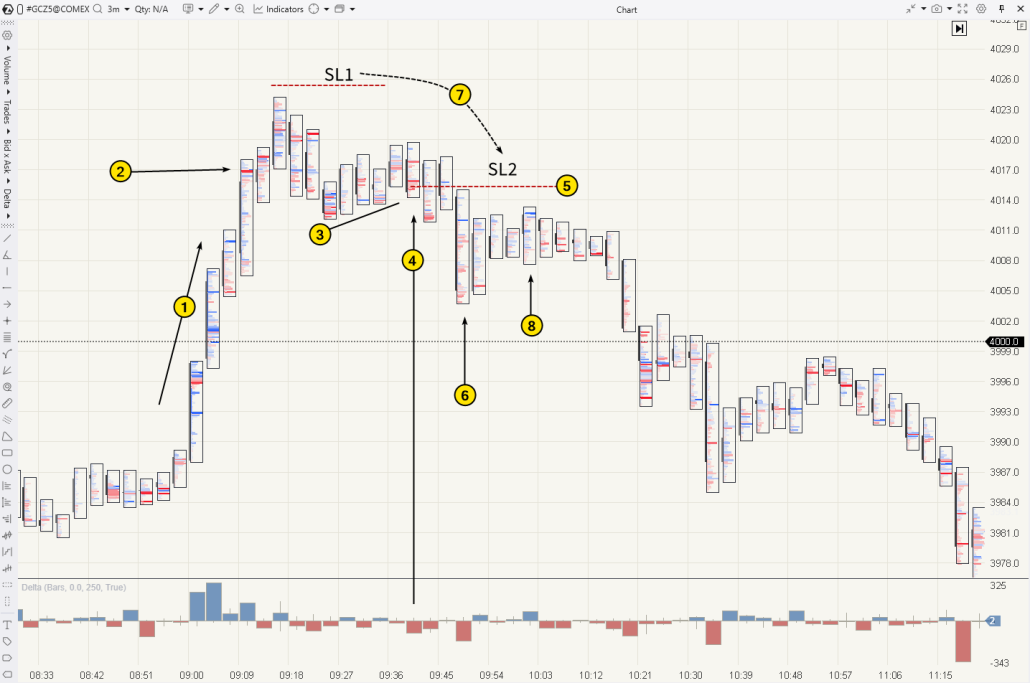
Suppose you are evaluating the market and observe the following sequence:
1 — At the European session open, the price rises above the psychological level of $4,000 on a positive delta, signaling strong buyer activity.
2 — Sellers emerge at this key level, and the upward momentum stalls.
3 — A subsequent attempt to resume the uptrend appears weak. Although the candles form higher highs and higher lows, upside progress is minimal, and buying volume has completely dried up.
The order flow suggests that the move above the psychological level was a false breakout, designed to capture liquidity from short-sellers’ stops clustered above $4k.
4 — Aggressive market sell orders on the candle act as a trigger to confirm a short position setup.
5 — The hypothetical entry level is established around $4,015, with the initial trading risk management stop-loss placed above the recent swing high (SL1).
6 — As the price drops to $4,005, the temptation to protect the position grows.
7 — You move your stop to breakeven right at the entry price level (SL2), assuming the setup is now risk-free.
8 — However, after bouncing off $4,005, the price rallies back, coming within inches of the entry point.
This brings you to a moment of truth: either your simulated position gets stopped out at $0, ending the trade prematurely, or it survives to realize its full profit potential.
In this specific scenario, your market read was accurate. Following a brief consolidation around $4,008–4,012, the price dropped sharply, delivering a substantial move. Yet, the market came within a few ticks of triggering your stop loss, which would have left you empty-handed despite a flawless break-even analysis. Was it truly worth the risk?
Psychology vs. Mathematical Expectation
Intraday traders are often driven by an immediate fear: as soon as the market shows a small floating profit, the impulse is to slide the stop to zero. It feels like you’ve eliminated the risk and achieved total safety. However, when you quantify this reactive behavior, it actually disrupts the statistical edge of your system.
Every trading strategy relies on the balance between two core metrics:
- Win Rate — the percentage of successful market outcomes.
- R:R (Reward-to-Risk Ratio) — the amount of potential profit relative to the simulated risk per trade.
A premature stop adjustment distorts this mathematical balance: while the number of actual losing outcomes decreases, you get a massive spike in trades ending in a flat $0 result due to standard market noise.
What Is Mathematical Expectation and How to Calculate It
Simply put, mathematical expectation trading is the average amount of money your strategy is expected to win or lose per simulated position over a large sample size (e.g., 100 trades).
The calculation formula is as follows:
Mathematical Expectation = (Win Rate × Average Win) − (Loss Rate × Average Loss)
Let’s look at a quick backtest example with these performance metrics:
- Win Rate: 40% (0.4)
- Average Win: $300
- Loss Rate: 60% (0.6)
- Average Loss: $100
(0.4 × $300) − (0.6 × $100) = $120 − $60 = $60
This means the strategy has a positive mathematical expectation. On average, every analyzed setup generates a theoretical value of $60.
Now, see what happens when you implement an aggressive break-even rule. Your average loss might drop, but your actual win rate shrinks because many trades get stopped out at entry. If your win rate drops to 20% and the remaining 80% end at a flat $0, your math changes:
(0.2 × $300) − (0.8 × $0) = $60 − $0 = $60
At first glance, the net result looks identical. However, if these early exits also reduce your average win to just $200 due to constant premature shakeouts, your formula becomes: (0.2 × $200) − (0.8 × $0) = $40. Your edge is shrinking, and if you add any hidden operational costs, the strategy can easily flip into a net loss.
Pros and Cons of Moving to Breakeven
To help you make an objective decision, let’s look at the clear pros and cons of using a break-even stop:
“A protective level should only be adjusted when your original chart analysis is validated as no longer accurate based on market structure. If you move your stop simply to escape short-term emotional pressure, you are actively trading against your own math.” — Dr. Van Tharp.
How to Find the Break Even Point: Formulas for Different Markets
Before adjusting any protective levels on your chart, you must understand exactly where the mathematical break-even point lies. While it is tempting to assume it is identical to your entry price, the actual break-even calculation / formula varies across financial instruments due to asset specifications and contract structures.
Linear Assets: Stocks and Spot Crypto
For equities and spot digital assets, finding the break even point formula is straightforward. Your net entry must account for transaction costs:
Break Even Price = Entry Price + (Total Fees / Position Size in Units)
Example: Suppose you analyze a setup for stock XXX bought at $100. The combined exchange and broker fees for entering and exiting amount to $2. If the position size is 10 shares, your true baseline is:
$100 + ($2 / 10) = $100.20
Only at this price level does the position become truly “free” for your account balance.
Derivatives: Futures Market
When analyzing futures charts, you cannot simply take the entry price and add a dollar fee like you do with stocks. Here, the break-even formula is tied directly to the tick value (the currency value of a minimum price movement) and the tick size:
Break Even Price = Entry Price ± (Total Fees / (Number of Contracts × (Tick Value / Tick Size)))
Minus for short positions, plus for longs
Example: Suppose you analyze a simulated short position on Gold futures (GC) at an entry price of $4,015. The round-turn fee (entry + exit) is $5 per contract. For Gold futures, the tick size is 0.1, and the tick value is $10:
$5 / (1 × ($10 / 0.1)) = $5 / 100 = 0.05
Since it is a short setup, how to find break even point configurations here?
$4,015 − 0.05 = $4,014.95
To clear your costs, the market must move at least half a tick in your favor. This proves that setting a break even stop loss strategy exactly at $4,015 would actually result in a net loss equal to your transaction fees.
Options: Call and Put Contracts
In options analysis, the break-even calculation looks completely different because of the non-linear risk profile (the premium paid or collected). The math depends on the type of contract and whether you are analyzing a buyer’s or a seller’s position.
For Call Options (Long):
Break Even Price = Strike Price + Option Premium
For Put Options (Long):
Break Even Price = Strike Price − Option Premium
Example: If you map out a simulated long Call option with a strike price of $4,000 and a paid premium of $50, break even calculation would be like:
$4,000 + $50 = $4,050
The underlying asset must clear this level for the analytical scenario to yield a net positive result. For the option seller, $4,050 represents the threshold where the simulated position starts accumulating losses.
Please note: Currently, ATAS does not support options analysis. However, we know how vital this asset class is for advanced risk modeling, which is why our development team is currently actively working on implementing options analysis into the analytical software. Stay tuned for upcoming releases!
Forex: The Currency Market
In traditional spot Forex, looking for how to find break even point targets requires factoring in pips, lot sizes, and pip values:
Break Even Price = Entry Price ± (Total Costs in Currency / Pip Value)
plus for long positions, minus for shorts
However, the spot Forex market has a fundamental flaw — it is completely decentralized. There is no centralized order book, and the “tick volume” metrics found in standard retail forex platforms display only the speed of price updates, not actual traded cash. This is exactly why ATAS does not support spot Forex.
Instead, professional market analysts use ATAS to evaluate currency futures (such as 6E, 6B, or 6A) listed on the CME. While the breakeven calculation here follows strict futures mechanics based on tick value, the real edge is that you gain access to centralized order flow, institutional volume clusters, and real liquidity pools. This allows you to spot genuine structural barriers rather than blindly trying to move your stop to breakeven.
💡 PRO TIP: How Scaling In Shifts Your Structural Break-Even Point
When analyzing a strong trend, market participants often build a position in pieces rather than entering all at once—a process known as scaling in. Every time you add to your position at a new price level, your structural baseline shifts, requiring a recalculation.
A common misconception among retail traders is thinking that your initial, lower entry remains independently safe. In reality, your trading account tracks these multiple execution levels as a single, combined position with a unified average price.
Let’s look at a clear execution example to demonstrate how to find break even point configurations when scaling in:
- You simulate buying 1 futures contract at $5,000. At this stage, your baseline is exactly $5,000.
- The price moves up to $5,100. Recognizing a strong trend, you scale in and add another 1 contract at $5,100.
You now hold 2 contracts bought at different prices. To find where your net $0 mark is, you must use the volume-weighted break-even formula:
Adjusted Break Even Price = (Price 1 × Volume 1 + Price 2 × Volume 2) / (Volume 1 + Volume 2)
($5,000 × 1 + $5,100 × 1) / (1 + 1) = $5,050.
Your true dynamic break-even level has climbed to $5,050. This is a complete game-changer: if the market pullbacks to $5,000, the $100 loss on your second unit will completely wipe out the $100 profit from your first unit, leaving the overall trade in the red.
This proves why mastering this calculation prevents unexpected shakeouts—if you decide to move your stop to break even, your target is no longer $5,000, but exactly $5,050.
Hidden Enemies: Why a $0 Break-Even Can Still Result in a Loss
You’ve calculated the numbers perfectly, shifted your protective level exactly to your volume-weighted entry, and walked away expecting a flat $0 outcome in the worst-case scenario. Yet, when checking your execution logs, you notice a frustrating micro-loss. What happened?
In theoretical chart analysis, a break-even level is a static line. In a live order book, however, it is a dynamic zone heavily impacted by three operational frictions. This is a crucial element of professional trading risk management:
The combination of these three factors means that a “zero” exit in practice almost always carries hidden losses.
Systematic Break Even: Build in a Buffer
When trying to move your stop to break even, always build in a small buffer for execution friction. Your structural stop should sit 1–2 ticks inside profit territory to offset commissions, spreads, and potential slippage.
4 Stop-Management Tactics Using ATAS Analytics
Moving a stop-loss to zero simply because the market ticked a few points in your favor is a reliable way to slowly destroy your strategy’s expectancy. Professional break even analysis requires objective market reasons to alter your downside parameters. ATAS provides the exact tools you need to execute this accurately.
Here are 4 advanced tactics to manage and protect your position.
1. The ATR Indicator — Avoid Moving Too Soon
Logic: It is crucial to factor in the asset’s current environmental volatility. By using the Average True Range (ATR) indicator, a trader can delay moving the stop to break even until the price has traveled a specific distance. The goal is to protect your stop from being clipped by random market noise.
Stop Loss is moved to break even
Who it’s for: Perfect for traders who need clear, mechanical rules. The ATR stop loss / ATR break even filter protects against the emotional urge to jump to $0 the moment the P&L turns green.
2. The Momentum Scalping Tactic: Locking a Micro-Profit
Logic: “I’d rather exit with a micro-profit than risk the price returning to $0 and leaving me with nothing but a commission loss.”
→
Stop Loss is moved to break even + 5 ticks
Who it’s for: For short-term trading. The goal of a strict scalping break even protocol is to accumulate many small wins. The scalping trader accepts that large-potential setups will occasionally be stopped out by noise — this is completely normal for this business model, since the next pattern will appear in just a few minutes. At the same time, maintaining rigid control over your risk per trade / position size formula remains the top priority to shield your account.
3. Trend Trading: When a Small Loss Beats Break Even
Logic: “I follow the trend and hate being stopped out at $0 while the price runs another 100 ticks. I’m willing to risk 5 ticks below entry to avoid a random stop-out on a strong move.”
→
Stop Loss is moved to break even − 5 ticks
Who it’s for: This fits traders who build their system around capturing major trend expansions. The main goal here is to prevent random market noise from shaking a trader out of a high-potential position right at the start of a massive move that could yield hundreds of ticks. It is a tool for conscious position management, where the trader avoids suffocating the trade with tight limits, giving the price enough room to breathe so they can capture the absolute maximum of a trend trading stop loss configuration.
4. Structural Break Even: Footprint Analysis
Cluster analysis allows you to look inside every individual candlestick to evaluate the real-time auction between buyers and sellers. This is the ultimate, “structural” approach to protecting positions because it completely abandons rigid, blind mathematical rules and relies entirely on developing market facts.
Logic: “I don’t care about an abstract number of ticks the price has traveled. What matters is where the market has just built a fresh ‘wall’ of support or resistance. That is where I will hide my protective order.”
Let’s dissect a specific execution example — the BTC/USDT futures market:
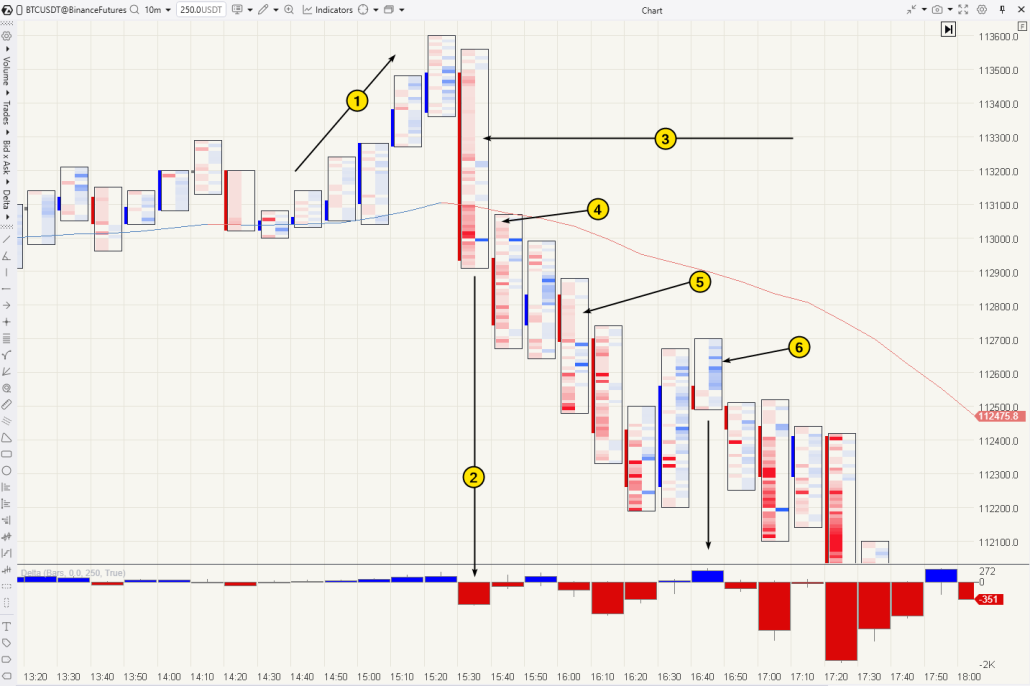
1 — Failed auction and aggressive sellers. Following a period of consolidation, the market attempts a bullish expansion, but this breakout fails instantly.
2 — The Delta indicator at the bottom of the chart flashes a massive surge in net-selling volume — aggressive market sellers seize control and slam the price downward.
3 and 4 — Recognizing that the upside momentum has trapped buyers, the trader triggers a short analytical position (4) around the psychological level of $113,000. The initial protective stop is placed inside the clear order flow imbalance zone (3) above $113,300, where aggressive buyers were entirely absent (empty clusters).
5 — As the price declines, the footprint chart consistently delivers live market evidence. Inside the descending bars, the market prints a sequence of fresh, aggressive selling imbalances (highlighted in bright red). This confirms that institutional selling pressure remains dominant, while passive buying interest is virtually non-existent.
6 — During a minor corrective pullback, reactive buyers attempt to reverse the momentum but run directly into passive institutional sell limits, walking straight into a “bull trap.” Their buy volume is absorbed, the bar closes lower, and a cluster of trapped longs is left exposed at the highs.
How to determine your protective targets: The combination of consecutive selling imbalances (5) and a verified trapped buyer phenomenon (6) provides data-backed justification to safely lower your stop-loss—first to break even, and then trail it into profit territory directly behind these newly established volume blocks. The trader’s stop is shielded by factual block orders rather than emotional bias—making it structurally more resilient to standard market noise.
4 Stop-Management Tactics — Summary
— ATR Filter: move only after 2× volatility is cleared — protects the stop from random noise
— Scalping BE: stop to zero + 5 ticks — guarantees micro-profit instead of zero
— Trend BE: stop to zero − 5 ticks — gives price room to breathe during a strong move
— Structural BE: stop behind a volume cluster or imbalance — protection without blind formulas
Position Sizing and Break Even: The Synergy in Action
While a break-even adjustment mitigates the risk of a single trade, proper position sizing safeguards your entire account. Experienced market analysts combine these two practices to optimize capital management rather than just cutting downsides.
Here is how these two concepts interact within a unified framework:
- Break-Even as a Catalyst for Capital Allocation. Moving a protective stop to a break-even level effectively removes the open risk from that specific trade. Traders often utilize this milestone to free up risk capacity, allowing them to look for secondary setups or scale into a strong, developing auction without overloading the account’s total exposure.
- The Reality of Initial Risk. Even when a strategy relies on a rapid shift to $0, baseline position sizing trading parameters are always calculated around the maximum initial stop distance. A sudden momentum flush can easily execute the original stop before there is an opportunity to adjust the order in the terminal.
- Dynamic Exposure Tracking. Modifying an active position—whether through partial profit-taking or adding to a trend—immediately shifts the dynamic baseline. Recalculating the adjusted metrics ensures that the overall risk per trade / position size formula stays perfectly aligned with the evolving market structure.
The Replay simulator allows you to test how volume management rules and break-even tactics interact using historical data streams. This provides a clear, simulated view of your strategy’s performance before any live market parameters are established.
5 Common Mistakes When Moving to Break-Even
Even experienced market participants frequently misuse break-even adjustments, turning a capital preservation tool into a source of consistent underperformance. Here are the five most common tactical errors—and how to address each one.
5 Common Mistakes When Moving to Break-Even
1Adjusting the Protective Order Too Early — Shifting to a break-even structure the exact moment a position turns positive suffocates the trade before it has room to breathe. The Fix: Utilizing an ATR stop loss strategy establishes a volatility-adjusted minimum distance requirement before any protective adjustments occur.
2Ignoring Hidden Operational Frictions — Setting a stop precisely at the entry execution price and assuming the setup is “risk-free” is a dangerous oversight. The Fix: Always calculate your true baseline by embedding all transaction frictions into your formulas.
3Treating a Break-Even Exit as a Profit Target — A break-even adjustment is strictly a risk management mechanism, not a strategic goal. Missing out on just one major directional trend can erase the cumulative mathematical benefit of twenty break-even exits. The Fix: Understand that break-even is a tool to manage risk, not a strategy for booking gains.
4Applying a Uniform Rule Across Conflicting Trading Styles — For an institutional order flow scalper executing a high-frequency scalping break even routine, rapid scratches are vital. However, applying that same rigidity to a trend trading stop loss system will systematically liquidate winning positions prematurely. The Fix: Thoroughly backtest dynamic stop behaviors on your specific setup inside the Market Replay simulator before implementing them live.
5Shifting Levels Without Structural Validation — Moving a stop mechanically based on arbitrary point distances without analyzing whether the auction has developed structural backing leaves your order vulnerable. The Fix: Verify the developing Volume Profile nodes and footprint imbalances before adjusting your protection parameters.
How to Configure and Test Break-Even Tactics in ATAS
There is no single “correct” rule for adjusting a protective stop-loss. Much depends on your individual market analysis style and personal preferences. Therefore, it is most practical to test different tactics using the built-in ATAS tools. The Protective Strategies module allows you to fully automate mechanical approaches (Tactics 1–3), freeing up your attention during active position management.
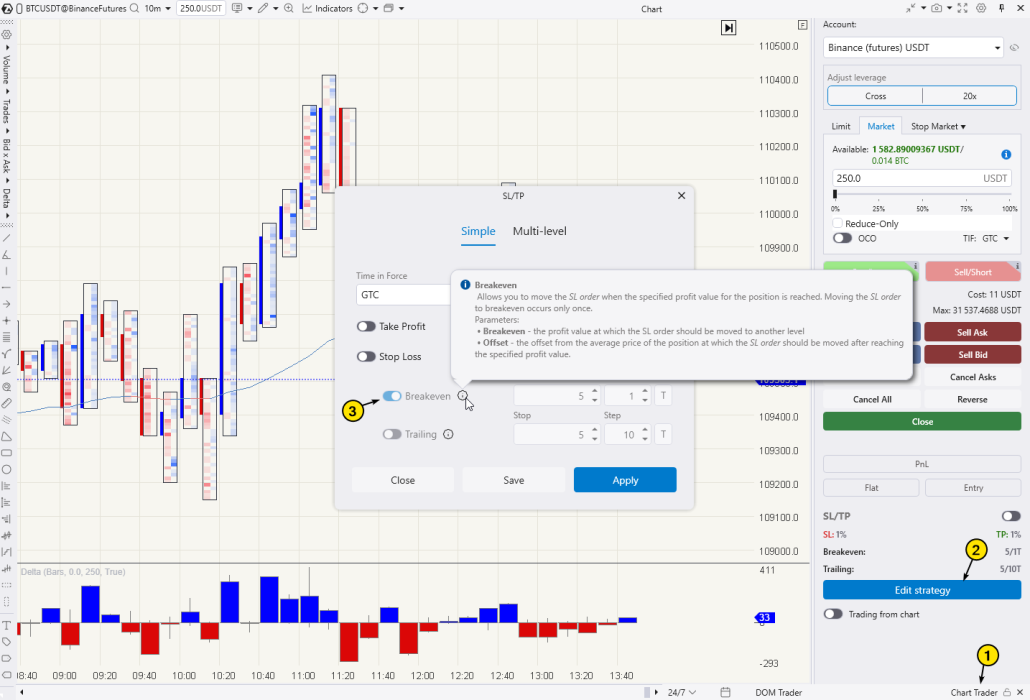
To open the configuration window:
1 — Open the Chart Trader panel.
2 — Click the Edit Strategy button.
3 — In the settings window, activate the Breakeven function and define your required parameters (the number of profit ticks and the trigger step).
The next logical milestone is verifying which of the 4 discussed tactics fits optimally into your specific system. The best tool for this research is Replay, which acts as a functional “time machine” for analyzing historical market data.
Logging 10 to 20 simulated sessions in this manner helps build analytical muscle memory. You can then deeply analyze the resulting performance data inside the Trading Journal module to clearly identify which risk modification profile delivers the highest mathematical efficiency.
FAQ
Break even is a risk management strategy in which a trader moves their Stop Loss to the trade’s entry price, reducing the open structural risk on that specific setup to zero on paper. In practice, however, a hasty and rapid move to $0 often results in the position being stopped out by random market noise, which can negatively affect long-run trading statistics.
An impulsive move to $0 is more often counterproductive, as it deteriorates the mathematical expectation of the strategy. Conversely, a justified, structural shift of the protective stop behind objective volume levels is a sound professional approach.
The volume-weighted break even analysis formula is utilized when scaling or averaging into a position:
BEP = (Price 1 × Size 1 + Price 2 × Size 2) / (Size 1 + Size 2)
Example: If you bought 1 contract at $5,000 and another 1 contract at $4,950, the average break-even point is:
($5,000 × 1 + $4,950 × 1) / 2 = $4,975
Specialized formulas for equities, futures, and options markets are detailed in Section 3.
ATAS supports break-even management via two distinct workflows:
- Automated: Use the Protective Strategies module, where you can configure your own parameters for automatic stop-loss adjustments.
- Analytical: Use the Footprint and Volume Profile tools to identify strong structural levels (HVN/POC) to serve as data-backed protective barriers for your manual stop adjustments behind real market volumes.
For options, the break-even point directly incorporates the premium paid. For Call options, the formula is: Strike + Premium. For Put options, the formula is: Strike − Premium
Unlike spot or futures markets, the option premium represents a sunk cost from the moment of purchase—the underlying asset price must recover this value before the position turns net-profitable.
A precise calculation must factor in: standard exchange and broker commissions, the bid-ask spread, estimated execution slippage when filling stop-market orders, and overnight rollover/swap fees. Simply setting your stop order at the historical entry price does not guarantee complete protection from micro-losses.
Yes, particularly when evaluating a new setup or navigating periods of anomalous market volatility. Preserving capital and gaining market experience without realizing a loss is a completely valid outcome. The problem arises only when breaking even becomes a habit that systematically prevents a strategy from capturing outsized trending moves.
Moving a protective stop to break even effectively removes the live risk from that specific trade. Some traders utilize this milestone to safely add volume to the position (scale in) at a better price with a fresh standalone stop. When adding volume, it is vital to recalculate the weighted break-even price (see Section 6 for the complete framework).
Conclusion: Break Even as an Element of a Conscious Strategy
Adjusting a protective stop-loss to break even is a powerful capital preservation tool—but only when it anchors directly to cold mathematical calculations and objective market volumes. Attempting to mechanically “hide at $0” during the slightest minor pullback is almost always an emotional reaction that systematically degrades your strategy’s long-term expectancy.
Download and start to use ATAS for free. Utilizing institutional data streams, such as the Volume Profile and Footprint Chart tools within ATAS, allows you to abandon blind execution rules. Instead, you can manage your protection parameters consciously, hiding your stops behind verified cluster levels and passive limit blocks. Furthermore, the Market Replay simulator and Trading Journal module provide the exact sandbox required to refine these tactics without exposure to live capital.
Ultimately, the goal of a robust trading framework is not to scratch every single trade at zero risk, but to allow your core mathematical edge to fully play out across a significant statistical sample. Configure your protective strategies intelligently, decode the order flow, and analyze with clarity using ATAS!
Information in this article cannot be perceived as a call for investing or buying/selling of any asset on the exchange. All situations, discussed in the article, are provided with the purpose of getting acquainted with the functionality and advantages of the ATAS platform.
Subscribe
Get the latest ATAS news delivered conveniently