Automated trading isn’t a niche idea anymore — everyone is talking about it. But a bot is only as smart as the instructions behind it, and most trading bots react to price alone — a thin signal that misses what’s really happening underneath the move.
This guide breaks down how automated trading strategies work, which approaches traders rely on, and how richer market data sharpens every decision a bot makes.
Get started now!
Try ATAS for free with no time limits
What Are Automated Trading Strategies?
Automated trading strategies are rule-based systems that let software open and close trades on your behalf when preset conditions are met. Instead of watching charts and clicking manually, you set the logic — entry triggers, exit targets, and risk limits — and the program runs it the moment the market lines up.
People use “automated” and “algorithmic” almost interchangeably, and in casual talk, that’s fine. But there’s an important distinction:
| Automated trading systems focus on execution: software places orders without manual input. | Algorithmic trading strategies put more weight on the decision model — the logic that decides what to trade and when. |
Most setups blend both. The same idea scales from one rule on a single account to automated trading strategies for copy trading that mirror a system across many accounts.
How Automated Trading Works: Entry, Exit & Risk
Both advanced and simple automated trading strategies are based on three main components:
Those blocks hold across multiple markets: automated forex trading strategies, futures bots, stock market tools, and crypto scripts all lean on the same three. Here’s a practical example. Say a trader wants a bot to trade breakouts on the E-mini S&P 500 futures (ES) and only take the ones with real buying behind them. The rules might look like this:
- Entry: Buy one contract when price breaks above the prior session high and cumulative delta is rising, confirming aggressive buyers are pushing the move (not just a thin poke through the level).
- Exit: Take profit at 8 ticks or close the trade if delta flips negative while price stalls, indicating the breakout is weakening.
- Position sizing: Risk no more than 0.5% of the account per trade, with a hard stop 6 ticks below entry and a daily cap of three losing trades before the bot shuts off.
So, to launch a bot, you set the trading rules and connect it to your broker through an API. The tool then fires orders when the conditions are met.
ATAS in practice:
In a trading bot strategy, ATAS is the data analysis layer. You use its order-flow data — delta, footprint, and liquidity visualization — to shape and refine your own entry and exit conditions. It doesn’t execute trades or route orders; your broker or crypto exchange handles that. But it does allow you to gain deeper insights into the market through 240+ indicators that can give your bot an edge.
Common Strategies for Automated Trading Bots
Most algorithmic trading strategies fall into a few recognizable families. The table below lays out six of the most common strategies for automated trading bots: what they do, where they fit, and how richer data improves each.
| Strategy | How it works | Markets | ATAS data |
|---|---|---|---|
| Trend following | Rides a sustained move until it stalls | Strong, directional markets | Cumulative delta and trading volume confirm the trend has real backing |
| Mean reversion | Fades stretched prices back to fair value | Range-bound markets | Volume profile value areas and POC define fair value with hard data |
| Momentum / breakout | Enters as price breaks a key level | Volatile markets driven by news | Footprint and delta separate a real breakout from a thin trap |
| Arbitrage | Profits from price differences across venues | Multi-exchange markets | Tick-level data verifies a gap is real, not a stale quote |
| Market making | Posts bids and offers to earn the spread | Liquid, stable markets | Heatmap and DOM show where resting liquidity sits |
| Scalping | Takes many small profits from quick moves | Liquid, active sessions | Smart DOM and tape speed expose short-term pressure that a scalping bot can use |
There’s no universal answer to which are the best automated trading strategies; the right one depends on the market and the risk you’ll carry. These are the setups traders meet most often, and ATAS covers more in its Strategies blog section.
We’ll look at the three most popular in more detail below.
1. Trend-Following Strategies
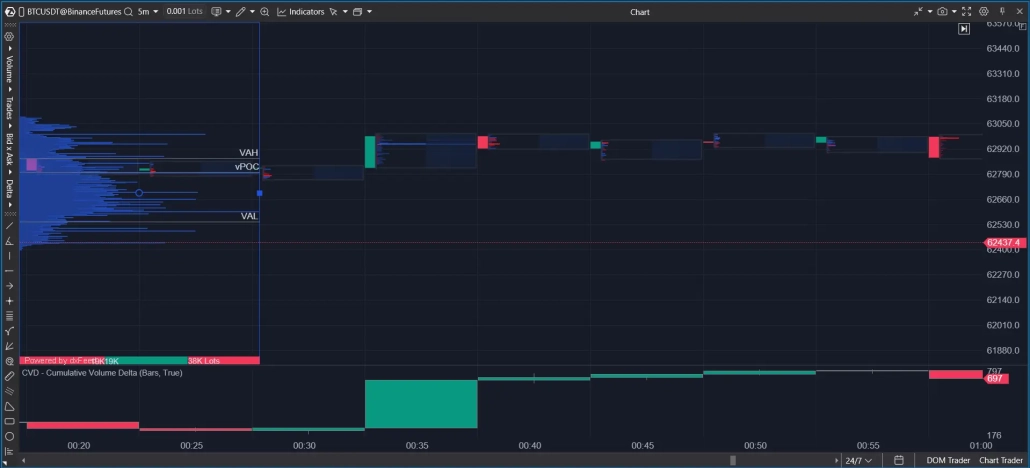
Trend following is the classic “ride the wave” approach. A bot spots a move starting, usually a moving average crossover, and holds until the trend breaks. The math is humbling: many small losses on false starts pay for a few potential big winners, so you need to tell a real trend from a fakeout.
Before the bot commits, ATAS helps confirm trend strength with cumulative delta and volume. If delta stays flat while price climbs, the move lacks power, and ATAS charts make the gap easy to read. Here’s how it looks when the price trend and delta move together:
2. Mean Reversion Strategies
Mean reversion assumes that price, stretched too far, snaps back toward fair value. It suits range-bound markets, where the same highs and lows keep getting tested. Defining “fair value” is the hard part here.
ATAS gives you an objective anchor through the volume profile: the value area marks where most business got done (between the value area high (VAH) and value area low (VAL)), and the point of control (POC) flags the price with the heaviest volume. When price drifts well above the value area amid lower participation, a mean-reversion bot has a data-backed reason to fade it.
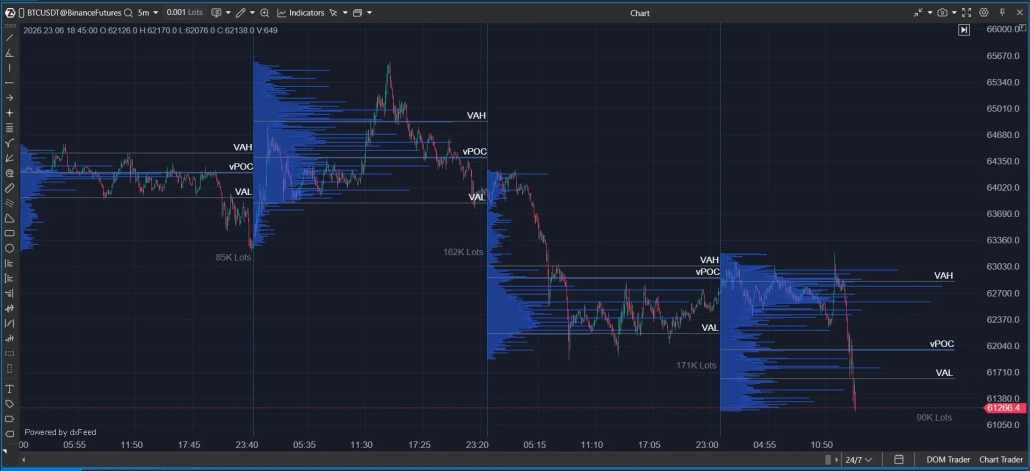
Case Study: Fading Excess Outside the Value Area
This BTCUSDT 5m chart provides a textbook example of how a mean-reversion algorithm uses volume profile structures to spot overextended prices and execute high-probability fades:
- Establishing the parameters of fair value: The software maps out the boundaries where the majority of trading occurred. The Value Area High (VAH) rests near 60,550, the Value Area Low (VAL) is established at 59,520, and the volume Point of Control (vPOC) forms our central gravitational anchor at 59,800.
- The false breakout (12:05): Price aggressively spikes above the VAH, peaking near 60,800. While a simple price-action bot might buy this momentum, a mean-reversion bot analyzes the underlying volume profile. It sees that this rapid upward move is entering a low-volume zone with poor participation — meaning the market is rejecting these higher prices as “unfair.”
- The mean reversion rotation: Once the buying exhaustion is confirmed at the highs, the bot fades the move, shorting the asset with an initial target at the vPOC. The market snaps back violently, slicing through the VAH, hitting the vPOC, and ultimately rotating all the way down to test the opposite extreme at the VAL and below.
By anchoring its logic to the auction boundaries rather than just price candles, the algorithm successfully avoids chasing a trap and capitalizes on the market’s natural tendency to return to balance.
3. Momentum & Breakout Strategies
Momentum and breakout strategies do the opposite of fading: they buy strength as the price clears a key level. The trouble is the false breakout: price pokes past resistance, pulls in buyers, then collapses. Bots that rely on price alone constantly fall for these traps.
The order flow trading approach helps tell the two apart: a real breakout shows a surge of aggressive volume through the level, while a trap shows thin participation and quick absorption. With a footprint and delta, a momentum bot can check whether real contracts are trading through before it fires.
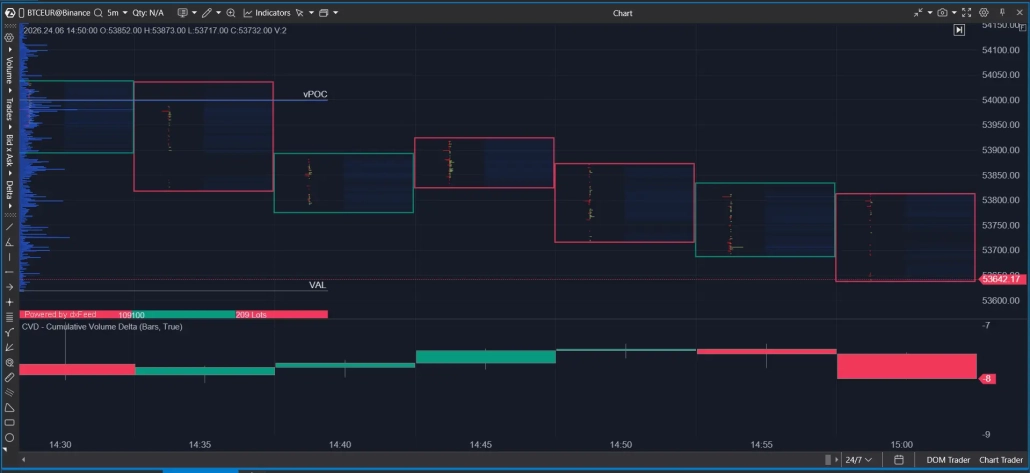
Case Study: Spotting Absorption and Breakout Confirmations in Real Time
The accompanying chart of the ES@CME 5m contract perfectly illustrates how order flow tools prevent trading blind at key structural levels:
- Identifying the key level: The gray VAL (Value Area Low) line at 7532.50 serves as our primary level of interest.
- Spotting the trap & absorption (07:10 – 07:25): As the price dropped toward the 7521.00 area, classic momentum algorithms might have chased the breakdown. However, the order flow shows defensive buying: at 07:10, a heavy volume cluster of 210 prints at the very bottom of the bar, blocking further downside. In the next bar at 07:15, the highest volume shifts to the upper half (224 contracts), showing that market buyers quickly pushed the price back up. After a brief pause at 07:20, where 200 contracts trade at the lower tail, a final downward test at 07:25 prints 150 contracts at the bottom before closing higher. This sequence confirms that aggressive selling has been completely absorbed, trapping late shorts.
- Confirming the real breakout (07:45): Following the V-shaped reversal, the price returns to test the VAL resistance. Instead of an empty, low-volume exhaustion trap, the footprint flashes an intense influx of institutional activity with a bright cluster of 253 contracts trading right through the level. Interestingly, while the Cumulative Volume Delta (CVD) remains negative and prints a red bar at 07:45, the price continues to clear the level. This clear delta divergence indicates that the breakout is being driven by strong passive limit orders absorbing market selling, confirming genuine interest in pushing the price higher.
By filtering the price action through the lens of a footprint and delta, an order flow bot can instantly distinguish a high-probability breakout from a dangerous bear trap.
Pros and Cons of Automated Trading
Automation solves real problems and creates new ones. Before handing the keys to automated trading bots, be honest about both sides.
| Pros | Cons |
|---|---|
| Discipline: The bot follows its rules without second-guessing. | Overfitting: A strategy tuned too tightly to historical data falls apart live. |
| Speed: Orders fire in milliseconds, faster than manual trading. | Tech failures: A dropped connection can leave a position unmanaged. |
| Monitoring: Bots watch the market 24/5 and 24/7 in crypto. | Supervision: “Set and forget” is how accounts blow up. |
| Backtestable: You can test the logic before risking money. | False confidence: A clean backtest can hide fragile assumptions. |
| No emotion: Fear and greed don’t influence trading decisions. | Cost: Quality market data feeds and hosting add up. |
Most failures trace back to weak inputs or weak oversight. Both are fixable, and the first starts with better data.
How Data Quality Influences Bot Performance
Most trading algorithms eat the same thin diet: open, high, low, close, maybe volume — the root of overfitting. With market price as the only input, a strategy has little to hold on to except the shape of past charts, so it memorizes noise. Feed it a fuller picture, and it has something durable to stand on.
Order flow is that fuller input. Instead of the candle’s outline, it shows the executed trades and resting liquidity behind a move: footprint clusters, delta, and the depth of market (DOM). Updating in real time, a strategy built on this data separates genuine moves from traps as they form, not after the fact, and helps manage market volatility.
ATAS in practice:
ATAS supplies exactly this layer. It helps confirm a breakout through footprint charts, offering over 400 cluster variations to see inside a candle. The software allows you to connect 25+ exchanges to obtain high-quality data and features more than 70 flexible volume analysis tools to make the most of it.
Building Automated Strategies with ATAS
For a trading bot strategy, ATAS allows you to connect custom bots. You can write them yourself using C# and configure access through a developer API. If you don’t have coding skills, that’s not a problem — on the Marketplace, you can order a custom algorithm or find a ready-made one.
Most algorithmic traders take one of two paths:
- Build: Write your own triggers when you have an edge and can code them.
- Buy: Purchase a Marketplace algo or commission one when you’d rather not touch C#.
ATAS in practice:
The analytical platform is where an automated trading system gets its data layer — the market conditions and analytical inputs that define what the bot watches for. What makes ATAS stand out is that custom bots and indicators run on the same raw Level 2 data as ATAS’s own built-in indicators. That’s what makes deep, granular analysis possible: your logic reads the order book as it actually forms, not a rounded-off summary of it. Aggregated data lags behind live order flow and blurs what happened at each price level; raw data doesn’t.
Backtesting Strategies with ATAS Market Replay
A strategy that looks perfect on paper still has to survive a market it was never trained on. Backtesting trading strategies is how you find the cracks before they cost real money.
ATAS Market Replay runs the market back tick by tick and preserves the chart or order book as it actually moved. Logic that leans on absorption, delta, or market liquidity shifts gets checked against how the session truly unfolded, not a smoothed-over summary.
ATAS in practice:
Backtesting trading strategies through Replay can help you avoid overfitting and lets you rehearse without risk — the step that separates durable algorithmic trading systems from lucky ones. Run the same trading bot strategy across calm, trending, and volatile sessions; if it only works in one regime, better to learn now than with live capital on the line.
Risk Management & Legal Considerations
Automation removes emotion from execution, not risk from the market. The guardrails below apply to any automated trading strategies and keep a bad day from becoming a blown account:
- Cap risk per trade: A fixed, small percentage of the account, no exceptions.
- Set a daily loss limit: The bot should stop once it’s hit.
- Keep position sizing sane: Leverage magnifies mistakes as much as gains.
- Monitor actively: Check fills, connectivity, and behavior through the session.
- Stay in the loop: You should be able to flatten everything with one click.
On the legal side, algo trading strategies are allowed in most regulated markets; funds and banks have run them for decades. Using automation to manipulate the market crosses the line: spoofing (placing orders you plan to cancel) and layering may draw real penalties. High-frequency trading — one of the main use case scenarios for bots — must also be considered carefully, depending on your jurisdiction.
Worth restating: ATAS is analysis software. It doesn’t execute trades, hold funds, or manage capital. Those stay with you and your broker or exchange.
FAQ
They’re rule-based systems that buy and sell automatically when conditions you set are met. You define the entry, exit, and risk; the bot handles execution via your broker.
“Automated” emphasizes hands-off execution, while algorithmic trading strategies stress the decision model that picks what to trade. Most real setups combine both.
Some are; plenty aren’t. Profitability depends on having a real edge, solid risk control, and quality data, not on the bot itself. Whether bots are profitable depends on what you feed them and how closely you manage them.
If you have an idea for a bot but don’t have any programming skills, you can order a custom development project on the ATAS Marketplace. You’ll also find no-code visual bot builders there to help you assemble your own strategy without touching C#, as well as ready-made solutions that can expand your strategy.
No. ATAS is a platform for trading analysis. It visualizes market structure; your broker or exchange places the order. ATAS never trades your account on its own.
Use ATAS Market Replay. It replays the market tick by tick with the order book intact, so you can test entries, exits, and liquidity logic before going live.
Build Smarter Strategies with ATAS
A bot is only as good as the information it acts on. Price-only inputs get price-only results; order flow gives your logic something real to work with. Download ATAS, start on the free plan, and build on data that shows what the market is truly doing.
The information in this article should not be considered an invitation to invest in or buy/sell any asset on an exchange. All situations discussed in the article are described solely to introduce the functionality and advantages of the ATAS platform.
Subscribe
Get the latest ATAS news delivered conveniently