Choosing the right futures contract can be more complicated than it seems. Knowing the ticker alone is not enough to assess position size, the value of a price move, or the actual risk involved. RTY/M2K adds another layer of complexity, with two contract sizes and price movements that do not always follow the same pattern as ES and NQ.
Small-cap futures are interesting because they provide exposure to a market segment that can react differently to interest rates, economic expectations, and shifts in risk appetite. This guide covers RTY and M2K contract specifications, how they work, how to analyse them, how they compare with ES and NQ, and the main risks to consider.
Start now!
Try ATAS free with no time limit
What Are E-mini Russell 2000 Futures (RTY) and Micro E-mini (M2K)?
The Russell 2000 is a stock market index that tracks approximately 2,000 U.S. small-cap companies. Unlike the S&P 500 and Nasdaq-100, where the largest companies play a significant role, the Russell 2000 helps traders assess the performance of smaller publicly traded U.S. businesses.
You cannot work with the index directly, but you can trade futures listed by CME Group. Two contracts are available: RTY (E-mini Russell 2000) and M2K (Micro E-mini Russell 2000). Both track the same index but differ in size: M2K provides one-tenth the notional exposure of RTY at the same index level.
In practice, this lets you choose a position size that fits your trading account and acceptable risk. RTY is suited to larger positions, while M2K allows you to adjust exposure more precisely without switching to a different market.
For analysis, remember that the index reflects the performance of its constituent stocks, while RTY and M2K are separate exchange-traded instruments, each with its own price, trading volume, and order flow. In ATAS, you can study market participant activity directly in the futures market using footprint, Delta, and other volume analysis tools.
RTY vs. M2K Contract Specifications
RTY and M2K are both linked to the Russell 2000 Index, but they differ in contract size. The table below outlines the key specifications to understand before beginning the analysis.
| Parameter | RTY — E-mini | M2K — Micro E-mini |
|---|---|---|
| CME Globex symbol | RTY | M2K |
| Contract multiplier | $50 × index value | $5 × index value |
| Minimum price increment (tick size) | 0.10 index points | 0.10 index points |
| Tick value | $5 | $0.50 |
| CME Globex trading hours | Sunday–Friday, 6:00 p.m.–5:00 p.m. ET; daily break from 5:00 p.m. to 6:00 p.m. ET | Sunday–Friday, 6:00 p.m.–5:00 p.m. ET; daily break from 5:00 p.m. to 6:00 p.m. ET |
| Margin requirements | Depend on exchange requirements and the broker | Depend on exchange requirements and the broker |
| Expiration settlement | Cash-settled using the Special Opening Quotation (SOQ) | Cash-settled using the same SOQ as RTY |
| Contract months | March, June, September, December | March, June, September, December |
How Do These Specifications Affect Risk?
5-point move: RTY vs. M2K
If the price moves 5 points against your position, the loss will be $250 for one RTY contract or $25 for one M2K contract, excluding commissions and slippage.
Opening a position requires margin, or collateral, which can vary depending on exchange requirements, your broker, and market conditions. Check your broker’s current margin requirements before placing a trade. Margin is not the same as the maximum possible loss: the outcome of a trade depends on price movement and the number of contracts you hold.
Why Analyse E-mini Russell 2000 Futures?
RTY and M2K let you analyse movements in the stocks of smaller U.S. companies without opening separate positions in each one. This is useful if you want to follow not only the largest companies in the S&P 500 and Nasdaq-100, but also a broader segment of the stock market — small-cap companies.
The Russell 2000 can behave differently from ES and NQ. Smaller companies often depend more heavily on borrowing costs and the state of the domestic economy. As a result, RTY may respond to Federal Reserve decisions, interest rate changes, and economic data differently from other stock indexes. However, all three markets can move in the same direction, especially during major market shocks.
These contracts also offer a practical difference in position sizing. RTY is suited to larger positions, while M2K allows you to fine-tune position size to match your risk tolerance. Still, diversification alone is not a good reason to choose Russell 2000 futures. First, assess their liquidity, price behavior, and suitability for your trading strategy.
Who Trades RTY and M2K Futures?
Both retail traders and professional market participants use these contracts. Their objectives vary: some seek to profit from intraday movements in the Russell 2000, while others hedge equity portfolios or assess the performance of small-cap companies.
Retail traders may analyze RTY and M2K around news releases, economic data, or technical levels. For intraday, they use charts, volume, and price reactions at key levels. M2K is useful when they need to reduce position size without switching to a different market.
Funds and asset managers may use futures to temporarily reduce exposure to portfolios invested in smaller companies. For example, if an investor expects a short-term decline in this market segment, a futures position may partially offset losses on the underlying stocks.
Some traders also compare the Russell 2000 with the S&P 500 and Nasdaq-100. If large-cap stocks are rising while the Russell 2000 lags behind, this may indicate that the rally has limited market participation. However, this hypothesis needs confirmation from other data: a divergence between indexes alone does not guarantee a reversal.
What Moves the Price of E-mini Russell 2000 Futures?
RTY and M2K prices are influenced by interest rates, the state of the U.S. economy, corporate earnings, and overall investor risk appetite. To understand price movements in these futures, you need to look beyond the direction of the stock market and consider the characteristics of smaller companies.
Federal Reserve decisions and interest rates. Smaller companies often depend more heavily on borrowed capital than the largest corporations. As a result, expectations of higher interest rates can put pressure on the Russell 2000, while expectations of monetary policy easing may support it. However, the market’s reaction depends on why rates are changing and what investors already expect.
Economic data. Inflation, employment, and consumer spending figures influence growth forecasts and expectations for future Fed decisions. Unexpected results can trigger sharp moves in RTY, particularly when they change market expectations.
Corporate earnings and business conditions. The Russell 2000 covers companies across a range of industries. Changes in revenue, expenses, and earnings forecasts affect how their stocks are valued and, in turn, influence the index.
Risk appetite. When investors are willing to take on more risk, small-cap stocks may attract additional demand. During periods of uncertainty, market participants may instead reduce their positions. Watch how price and trading volume respond: a news release alone does not guarantee a move in the expected direction.
How to Analyze E-mini Russell 2000 Futures (RTY/M2K)
RTY and M2K analysis starts with choosing a contract, assessing risk, and preparing a trade plan. A price forecast is not a substitute for preparation: define your entry, stop-loss level, and exit conditions before placing a trade.
1. Choose a contract that fits your risk tolerance
RTY and M2K track the same index, but their dollar outcomes differ by a factor of ten for the same price movement. Calculate your potential loss before entering a position, and do not base your decision solely on the margin available in your account.
2. Analyze RTY—trade the M2K contract
If the M2K contract size suits you but you want to view RTY data, enable the Cross Trading feature in ATAS. You analyze the RTY chart, order book, and tick stream, and the orders you place from this chart are routed through your broker’s connection to the M2K contract. The price tick for both contracts is the same—0.10 points—so the order price remains the same, and the financial result is calculated based on the M2K tick value—$0.50.
Note: The order is executed in the M2K order book, which has its own liquidity and spread. Therefore, the execution price may differ from what you see on the RTY chart.
To turn on cross-trading in ATAS, go to General Settings (Settings -> Common) and check the box next to the “Enable Cross-Trading” option.
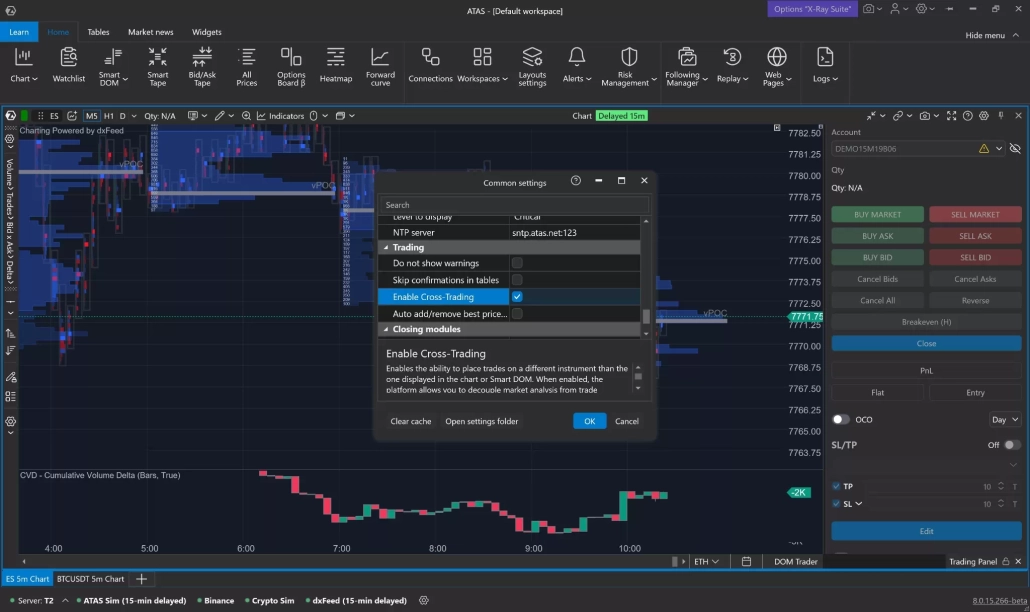
Enable Cross-Trading in ATAS General Settings
☝🏻The cross-trading feature does not work on the built-in ATAS Sim demo server. For cross-trading, the analytical platform must simultaneously compare price ticks, order book, and liquidity for two related instruments (for example, the underlying ES futures contract and the MES micro-contract). The ATAS Sim server emulates order execution exclusively within the context of a single specific order book on which a chart is open. It cannot redirect orders “on the fly” from ES charts for execution within the virtual MES gateway.
3. Define your setup
Mark key levels, previous highs and lows, and areas of elevated trading activity. Decide in advance what needs to happen for you to enter and what price action would invalidate your scenario.
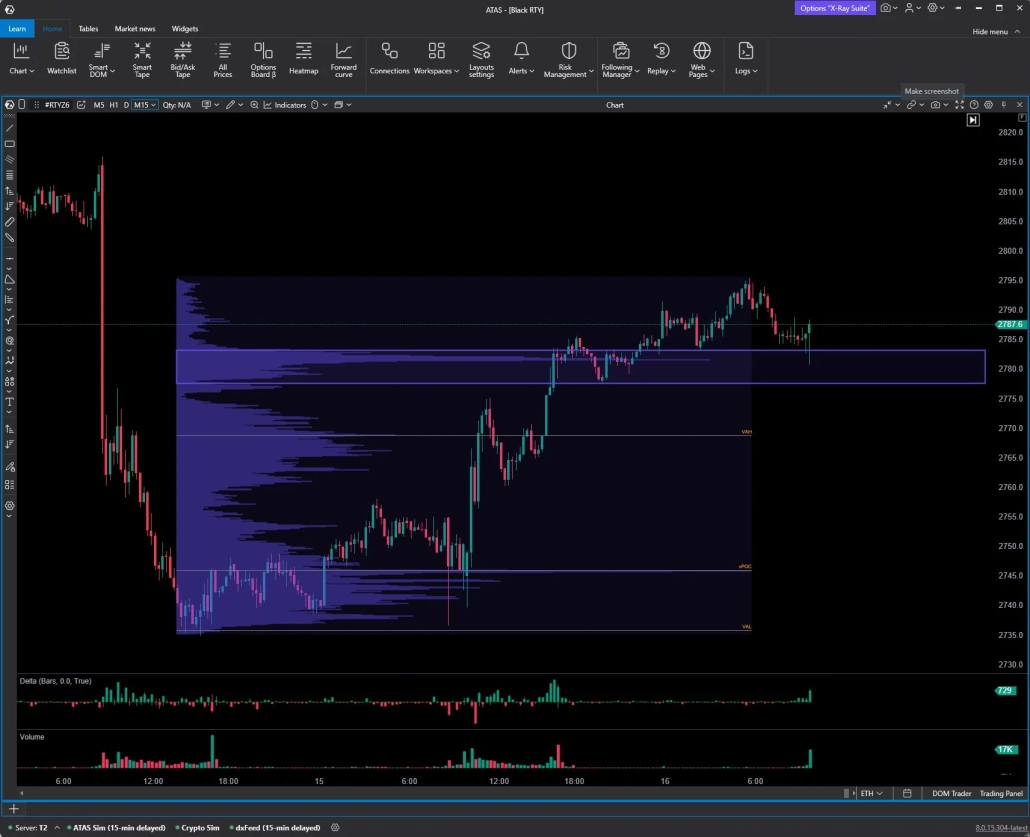
Using Volume Profile to Establish Support and Resistance Levels
4. Choose an order type
A market order lets you enter without waiting for a specified price, but the execution price may differ from what you expected. A limit order sets the price you are willing to accept, although execution is not guaranteed. A stop order is triggered when the price reaches a specified level; it is most often used to limit losses.
5. Study order flow
Footprint charts, Delta, and Volume Profile help you see where trades are being executed, how aggressive buying compares with aggressive selling, and whether a price move is gaining follow-through. ATAS lets you analyze this activity directly in the RTY/M2K futures market using volume analysis tools.
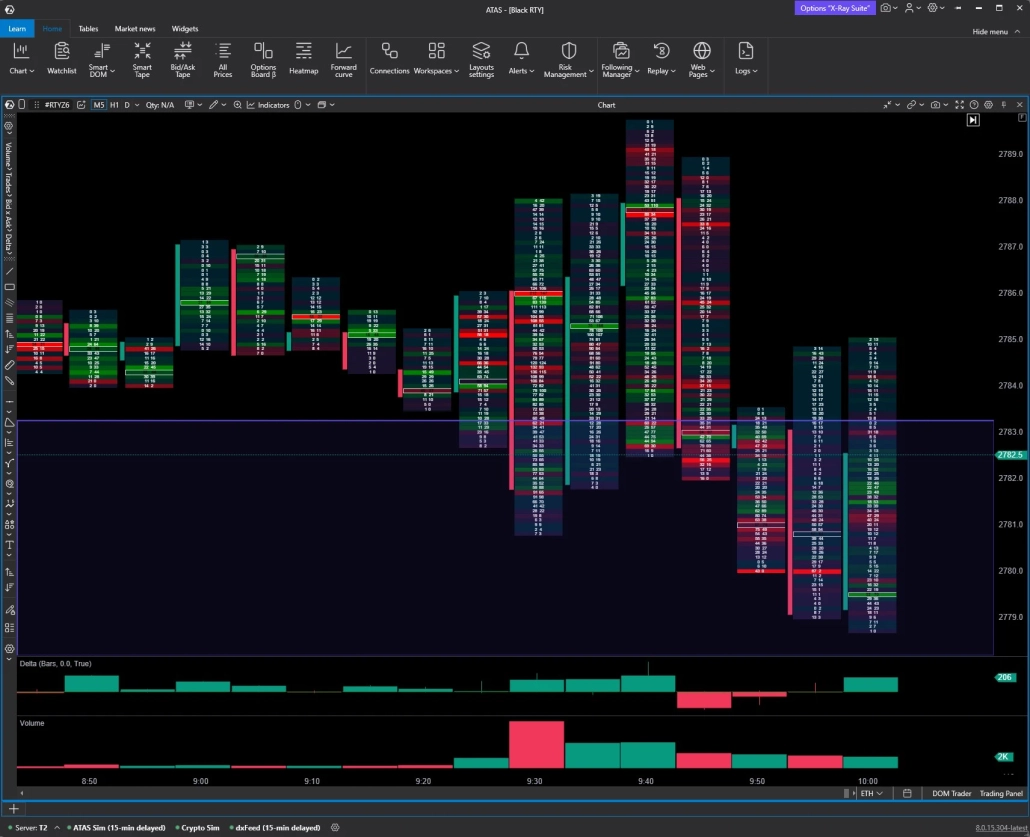
Using a cluster chart to obtain detailed information about trading volumes at a specific price level
6. Review the trade
After closing a position, assess whether you followed your plan, how price reacted to volume, and whether your stop was too close to normal market fluctuations. Record your observations in a trading journal. Reviewing a series of trades will help you evaluate your strategy more reliably than judging it by a single successful outcome.
Risks of Working with Small-Cap Index Futures
RTY and M2K provide exposure to small-cap stocks, but dealing with them requires strict risk management. Even a relatively small price move can lead to a substantial loss when leverage is involved.
Sharp price swings. The Russell 2000 can react significantly to economic news, Federal Reserve decisions, and changes in investor expectations. A stop-loss can help limit risk, but during rapid moves or periods of limited liquidity, the order may be filled at a less favorable price.
Leverage. Opening a futures position requires only a margin deposit, but profits and losses are calculated based on the full contract value. If the market moves against your position, losses can quickly exceed the amount you initially expected to risk.
Liquidity. Execution is generally easier during active trading hours than during periods of low market activity. Outside regular hours, spreads and slippage may increase. Before entering a trade, check current trading volume and the gap between the best bid and ask prices.
Russell 2000 reconstitution. Starting in 2026, FTSE Russell will review the index composition twice a year—in June and December. The review may affect the supply and demand for shares of companies that are added to or removed from the index. Keep track of reconstitution dates and remember that these events can intensify market activity.
To manage risk, calculate your potential loss in advance, avoid oversized positions, and never treat the margin required by your broker as a measure of how safe a trade is.
RTY/M2K Contract Months, Trading Hours & Settlement
RTY and M2K futures trade nearly around the clock on business days, with the main contracts expiring quarterly. These features matter when planning trades and rolling a position into the next contract.
When do the contracts expire?
CME Group follows a quarterly cycle, with expirations in March, June, September, and December. Before opening a position, check the contract month shown in your analytical platform. As expiration approaches, trading activity typically shifts to the next contract. For more details on how continuous futures contracts work and how to use them for chart analysis, visit the ATAS blog.
When can you trade?
RTY and M2K trade on CME Globex from Sunday at 6:00 p.m. to Friday at 5:00 p.m. Eastern Time (ET), with a daily break from 5:00 p.m. to 6:00 p.m. ET. Holiday schedules may differ.
How does expiration settlement work?
RTY and M2K are cash-settled, meaning no stocks are delivered. The final settlement value of an expiring contract is determined using the Russell 2000 Special Opening Quotation (SOQ). This value is calculated from the opening prices of the index’s constituent stocks on the expiration date. RTY and M2K use the same SOQ.
If you hold a position as expiration approaches, decide in advance whether to close it or roll it into the next contract. To roll a position, you must close the position in the expiring contract and open a new one in the next contract. The prices of the two contracts may differ.
E-mini Russell 2000 Futures vs. E-mini S&P 500 and Nasdaq-100 Futures
All four contracts let you track movements in the U.S. stock market, but they represent different segments. RTY and M2K track small-cap companies, ES tracks 500 leading U.S. companies across a range of industries, and NQ tracks 100 of the largest non-financial companies listed on Nasdaq. Technology companies play a significant role in the Nasdaq-100. For more details, read the ATAS blog guide to Nasdaq-100 futures.
| Parameter | RTY | M2K | ES | NQ |
|---|---|---|---|---|
| Underlying index | Russell 2000 | Russell 2000 | S&P 500 | Nasdaq-100 |
| Contract multiplier | $50 × index value | $5 × index value | $50 × index value | $20 × index value |
| Minimum price increment | 0.10 points | 0.10 points | 0.25 points | 0.25 points |
| Tick value | $5 | $0.50 | $12.50 | $5 |
| Companies represented by the index | Small-cap companies | Small-cap companies | U.S. companies across multiple industries | Largest non-financial companies listed on Nasdaq |
Which Contract Should You Choose?
Choose a contract based not only on the index it tracks, but also on tick value, volatility, and liquidity. Before entering a trade, calculate your potential loss based on your stop-loss level and the number of contracts.
Conclusion
RTY and M2K let you analyze the performance of small-cap companies and follow a market segment that may respond to economic events differently from the S&P 500 and Nasdaq-100. But choosing a contract is only the first step.
To make more informed decisions, combine price analysis with trading volume and order flow data. Watch where market participants are active, how price reacts to large trades, and whether a move gains follow-through. ATAS tools help you study these dynamics directly on futures charts.
Start by learning one contract, test your trading strategy on historical data, and define your acceptable loss in advance. Consistent market analysis and risk management help you make trading decisions based on observable data rather than emotions.
FAQ
E-mini refers to a smaller-sized futures contract compared with the traditional standard contract on the same index. RTY lets you analyze movements in the Russell 2000 without buying shares of every company included in the index.
Both contracts track the Russell 2000, but they differ in size. RTY has a multiplier of $50 per index point, while M2K has a multiplier of $5. As a result, their tick values are $5 and $0.50, respectively. M2K allows you to adjust position size more precisely.
There is no single required amount. It depends on the contract you choose, the margin requirements set by the exchange and your broker, and your approach to risk management. Before opening a position, check the current margin requirements and calculate your potential loss based on your stop-loss. Do not use all your available buying power simply because your broker allows it.
The minimum price increment for RTY is 0.10 index points, and each tick is worth $5. M2K has the same minimum price increment, but each tick is worth $0.50. These values let you calculate potential profit or loss for a given price movement.
The Russell 2000 helps assess the performance of small-cap companies, but it does not represent the entire U.S. economy. Its movements can offer insight into credit conditions, business expectations, and investor risk appetite. For a more complete picture, compare it with other stock indexes, labor market data, inflation figures, and economic growth indicators.
Information in this article cannot be perceived as a call for investing or buying/selling of any asset on the exchange. All situations, discussed in the article, are provided with the purpose of getting acquainted with the functionality and advantages of the ATAS platform.
Subscribe
Get the latest ATAS news delivered conveniently