
A short trade from a premarket zone to the session POC
This volume profile strategy case study follows a short trade in NQ futures (NQZ6), from premarket zone mapping to a target at the session POC. It shows how to define a zone with Volume Profile and TPO, and how to read the order flow response there with Footprint, Absorption, CVD, Big Trades, and Cluster Statistics. A zone tells you where to pay attention; price confirmation tells you when to act.
Building the Premarket Map with Volume Profile: Balance, HVN, and LVN
Start now!
Try ATAS free with no time limit
Educational note. This case study describes one trading process and is not investment advice. Futures trading involves substantial risk. The price calculations exclude fees and slippage, and a stop order does not guarantee execution at its stop price.
Reading Market Balance: VAH, POC, and VAL on Daily RTH Profiles
Compare recent completed RTH sessions, using the same session template and profile settings. Mark each session’s VAH, POC, and VAL. The POC (point of control) is the highest-volume price row; VAH (value area high) and VAL (value area low) bound the chart’s configured value area. Overlapping value areas and POCs within a common range suggest balance, with price trading in a relatively stable region. A stable POC supports that reading; a lower POC means the session’s highest-volume price has shifted lower.
Here, the completed RTH profiles show value migrating lower. That context supports watching for a rally into a mapped area where sellers may reappear. Figure 1 shows the lower placement of later value.
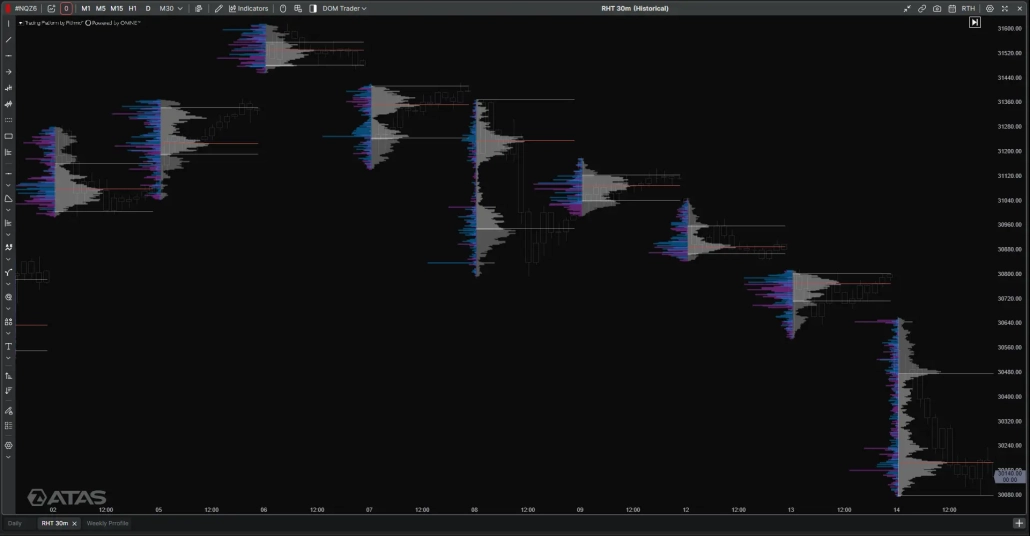
Figure 1: Completed 30-minute RTH Volume Profiles compared on a shared price scale. Later distributions and their POCs sit lower than the earlier profiles, illustrating the downward migration used to frame the short scenario.
High Volume Node vs Low Volume Node: How Zone A Was Defined
A High Volume Node (HVN) is a local peak in traded volume relative to nearby prices; a Low Volume Node (LVN) is a local trough. A volume ledge is an abrupt change in profile width across adjacent prices that can mark the edge of a more accepted region. These features are related, but they describe different parts of the distribution.
Build the map in four steps:
- Mark the previous completed RTH session’s VAH, POC, and VAL.
- Inspect the volume profile around those references for local peaks, troughs, and abrupt changes in profile width.
- Use the visible transition to draw a bounded area rather than assuming every reference is an exact reaction price.
- Record the boundaries and carry the same values onto the charts used during the session.
Zone A, shown in Figure 2, spans 30,079–30,109 and brackets the visible volume ledge on the prior-session profile.
Two higher reference bands remain on the map at 30,176–30,205 and 30,466–30,501. The documented price response and entry sequence developed at Zone A, so the higher bands remain contextual references rather than the focus of this trade.
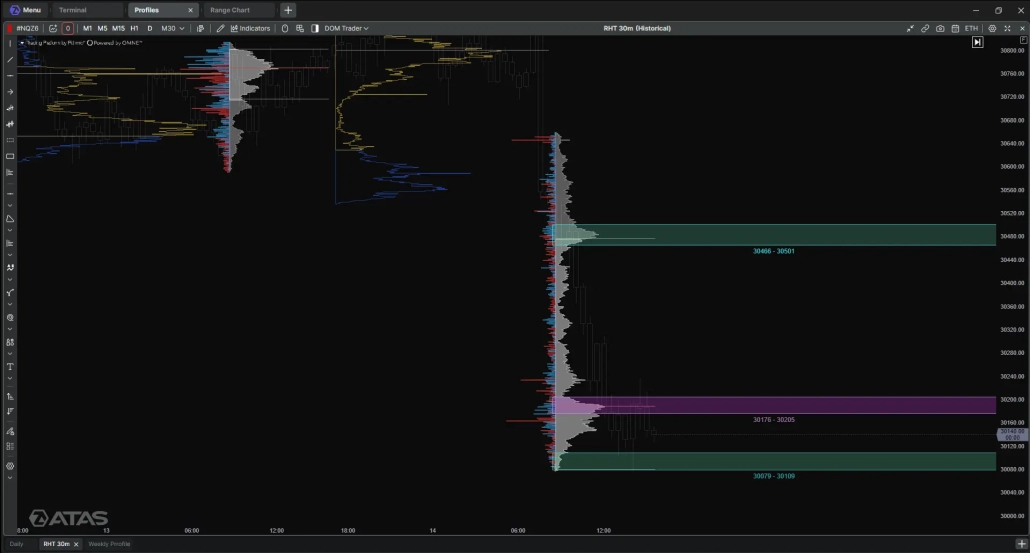
Figure 2: Previous-session RTH Volume Profile with the premarket reference bands. Zone A is 30,079–30,109; the higher bands are 30,176–30,205 and 30,466–30,501. The profile histogram provides the volume context for the marked areas.
Adding Weekly Context with a TPO Profile and Single Prints
Weekly profiles add a longer-term comparison after the RTH map is drawn. Volume Profile groups traded volume by price; a Time Price Opportunity (TPO) profile records the time periods in which each price traded. The measures are different: one describes volume, the other time-at-price.
The older weekly Volume Profile shows a local volume concentration near Zone A, not the profile’s overall POC. The weekly TPO view also shows a local time-based feature in the area.
A single print is a price row visited in only one TPO period. The marked weekly references at 30,063.00, 30,041.00, and 30,008.50 are below Zone A’s lower edge at 30,079; they are nearby context, not part of the zone. Figures 3 shows the volume and time-based views side by side.
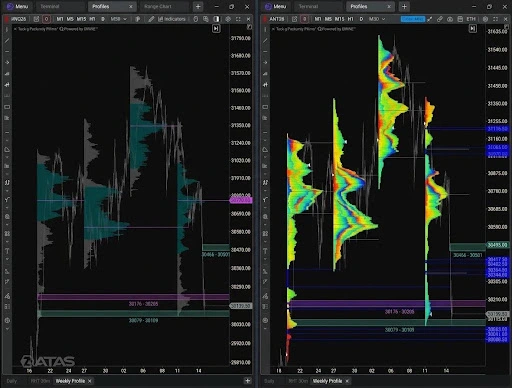
Figure 3: Weekly Volume Profile (left) and weekly TPO (right) with the reference bands. Zone A (30,079–30,109) intersects a small local volume feature; the single prints at 30,063.00, 30,041.00, and 30,008.50 lie below the zone.
Effort vs Result on the Footprint: Absorption at Zone A
Footprint and the ATAS Absorption Indicator
A Footprint displays executed volume at each price, commonly as bid × ask. Aggressive buy orders lift offers; passive sell limits rest at the ask and provide liquidity for those buys. Each cell shows the trades executed when the orders meet.
A stacked buy imbalance is a run of adjacent price rows where ask volume is unusually high relative to bid volume under the chart’s comparison settings. It marks concentrated buying effort; price progress is the result. If buyers keep lifting offers but price stalls or turns lower, their effort has not produced a matching advance, which can be consistent with absorption.
Figure 4 shows the one-minute Footprint at Zone A (30,079–30,109). During the 12:42 reaction, one cluster recorded 255 contracts at the bid and 422 at the ask. Total volume was 2,827 contracts and delta was positive but relatively small at +39, while price failed to sustain upward progress. At 12:43, volume was 1,011 contracts and delta shifted to −155 as price moved lower. This is the effort-versus-result pattern the rest of the setup builds on.
The ATAS Absorption indicator highlighted activity around 12:42 as price reached Zone A.рядку, колонку
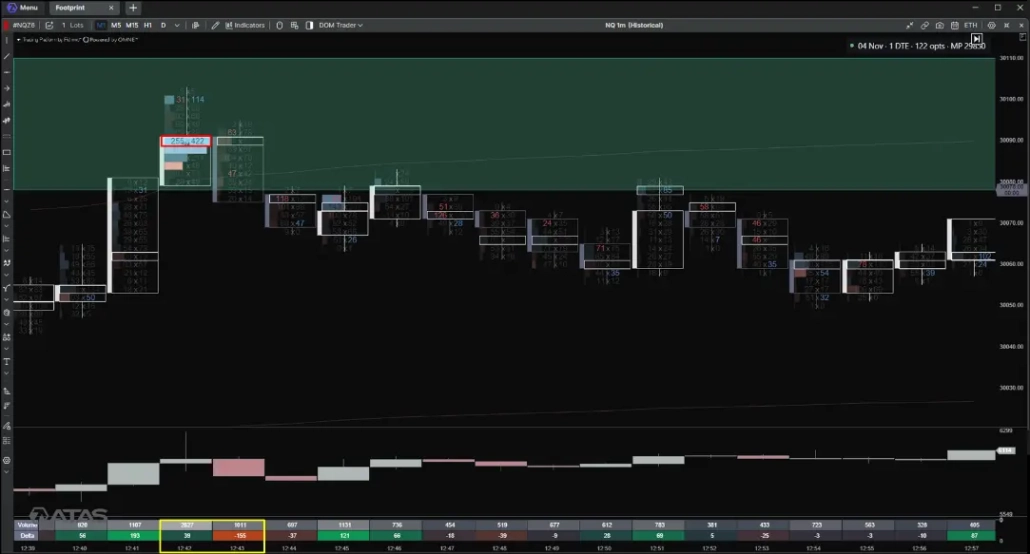
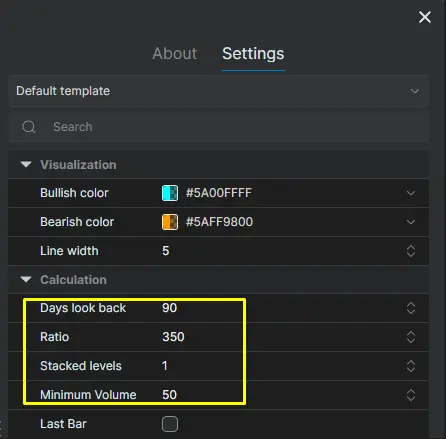
Figure 4: Buying effort and price rejection at Zone A. The one-minute Footprint shows concentrated ask-side executions during the 12:42 reaction, followed by negative delta at 12:43 as price moved lower. ATAS Absorption settings — Ratio 350, Stacked Levels 1, Minimum Volume 50, Days Look Back 90.
Speed of Tape: Activity Rises, Price Stalls
Speed of Tape added a view of execution activity on the 1,000-volume chart. Several histogram bars were highlighted around the 12:42 test of Zone A, showing that transactions were taking place more quickly as price moved into the area. The pace picked up, but price failed to hold its upward progress. This complemented the Footprint and Absorption readings: activity increased, while the price result remained limited.
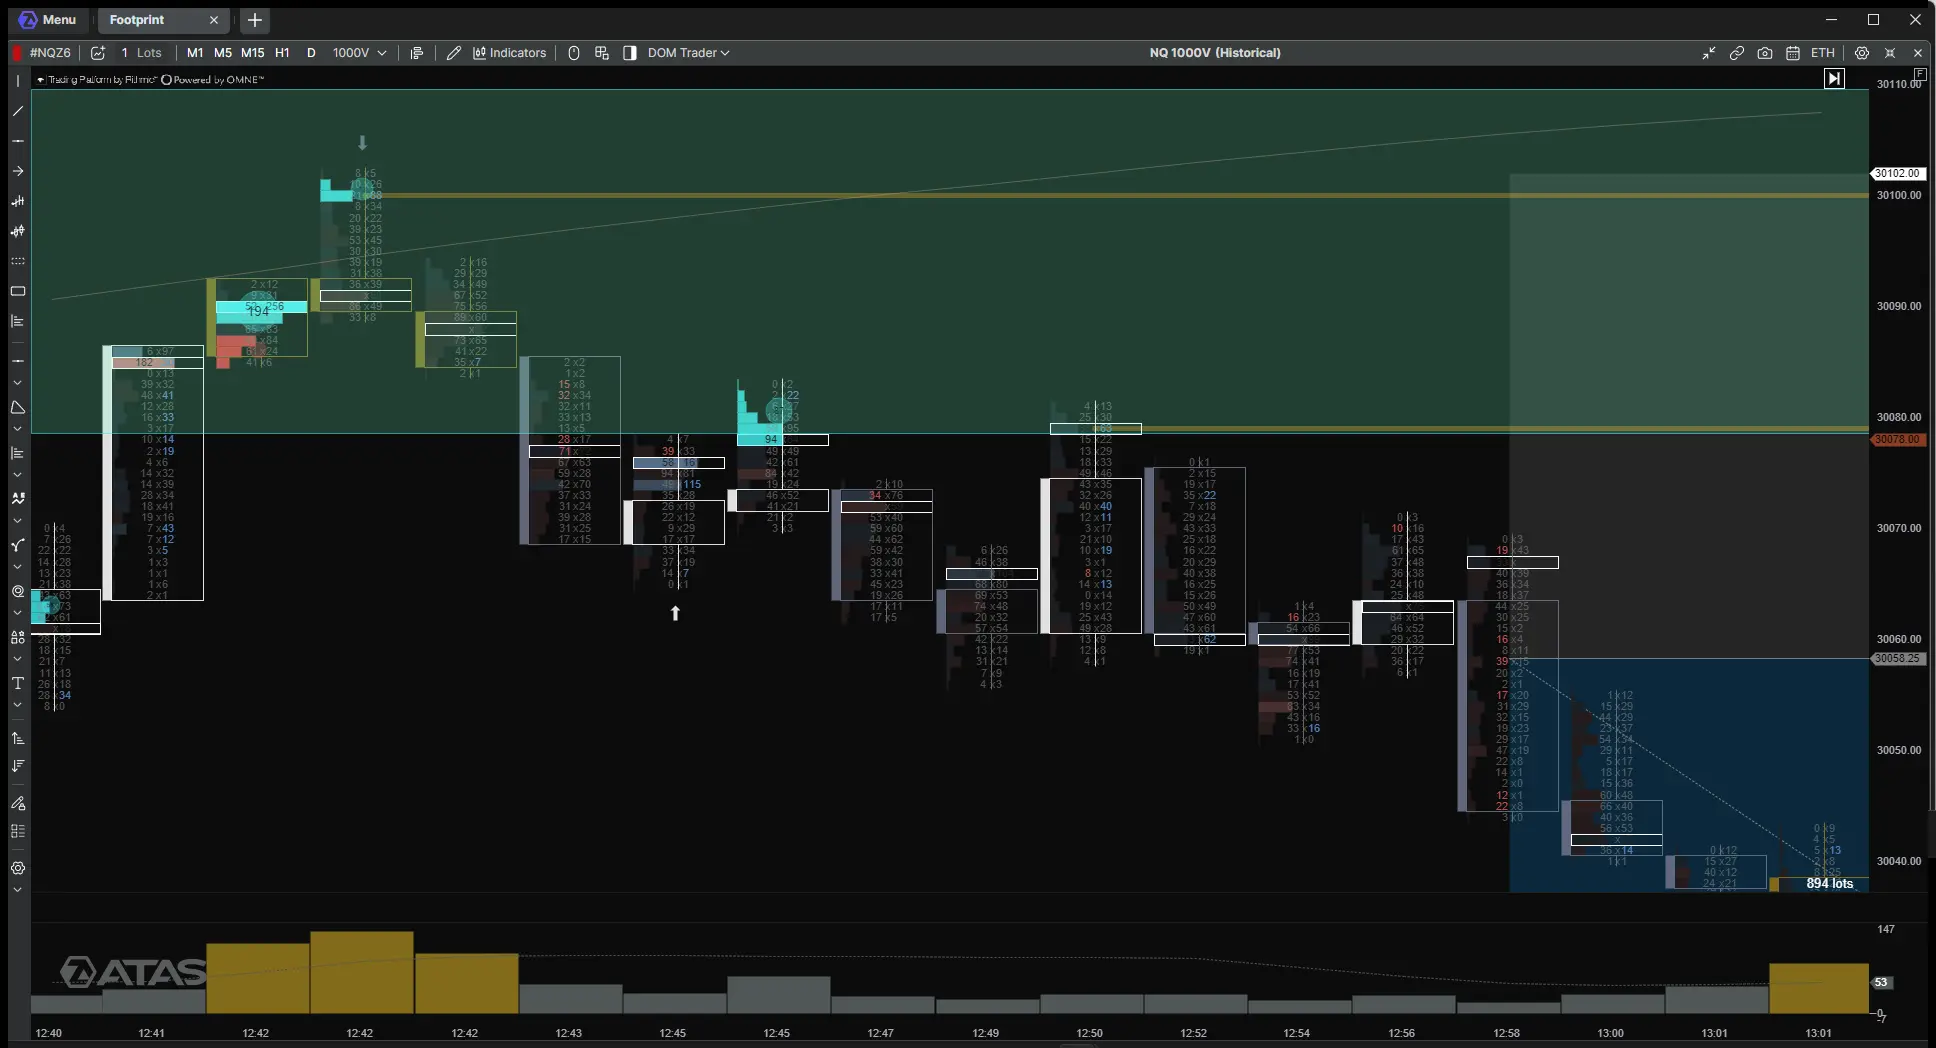
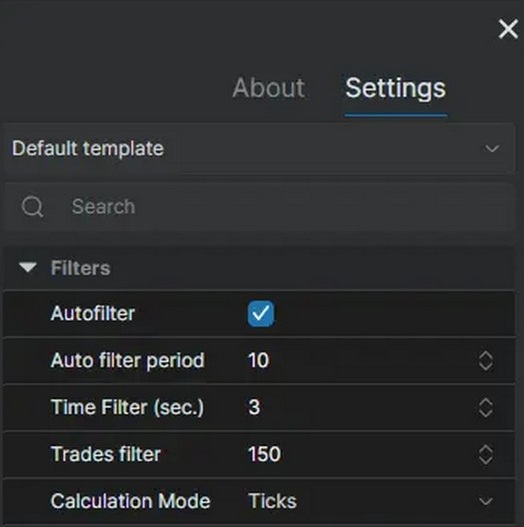
Figure 5: Speed of Tape on the 1,000-volume NQ chart. Several histogram bars are highlighted around the 12:42 test of Zone A. Speed of Tape settings: Ticks mode, Time filter 3 seconds, Autofilter enabled, Auto filter period 10, Trades filter 150, Length 5, and Draw bars enabled.
Ticks mode reflects the number of executions rather than contracts. The Time filter makes brief increases in activity easier to see, while Autofilter adjusts the highlighted activity to the recent trading pace.
CVD Divergence Inside Zone A
What CVD Divergence Shows
Cumulative Volume Delta (CVD) tracks the running difference between volume executed at the ask and at the bid over its configured accumulation period. Ask-side executions add positive delta and are commonly associated with aggressive buying; bid-side executions add negative delta and are commonly associated with aggressive selling. CVD records executed aggression, not resting liquidity or participant identity. Its reset and accumulation settings affect the curve, so compare swings only when those settings are consistent.
Read CVD against corresponding price swings. If both form higher highs, buying aggression is accompanied by price progress. If CVD reaches a higher high while price stalls or forms a lower high, effort has increased without a matching advance. That mismatch is an effort-versus-result divergence.
The Divergence in This Trade
In this trade, price formed a lower second high while CVD formed a higher high. That is the reverse of conventional bearish divergence, in which price makes a higher high as CVD makes a lower high. Here, CVD’s higher high showed cumulative net aggressive buying exceeding its prior peak, but price failed to exceed its earlier high. Buying effort increased without producing better upward progress. On its own, a divergence can persist while price consolidates or continues higher; here it mattered because it appeared at Zone A.
Figure 6 labels both swings. At Zone A (30,079–30,109), that relationship fit the earlier Absorption observation: aggressive buying appeared, but the advance could not be sustained.
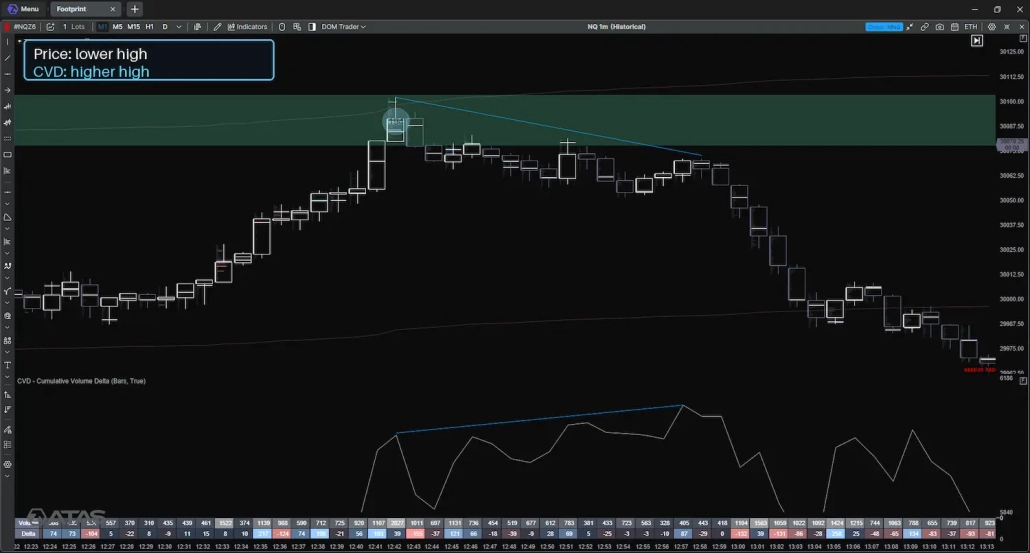
Figure 6: One-minute price and CVD comparison near Zone A. Price forms a lower second high while CVD reaches a higher high. The labeled divergence highlights greater buying aggression without a higher price high.
Big Trades: Spotting Participation at the Zone
Big Trades highlights executions that meet the indicator’s selected calculation and filtering rules. In this example, the one-minute chart uses Autofilter mode at Medium, giving a time-based view of notable activity. The 1,000-volume chart uses a Minimum Volume of 50 with Autofilter off, a more sensitive setting for following activity as volume bars form. A 1,000-volume bar represents a specified amount of traded volume, not a fixed interval of clock time.
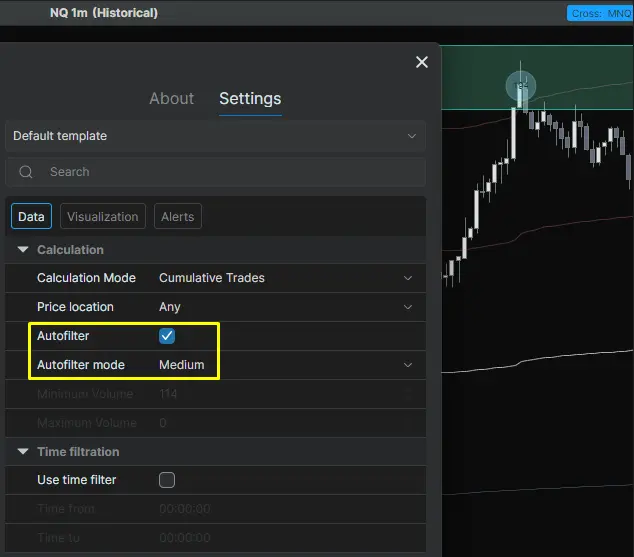
Figure 7: Settings used: one-minute chart — Autofilter on, Medium,; 1,000-volume chart — Autofilter off, Minimum Volume 50.
The 1,000-volume chart shows Big Trades markers during the approach to Zone A and around the initial reaction near 12:42. They highlight qualifying activity to compare with the price response, Absorption, and CVD. Figure 8 shows the chart sequence.
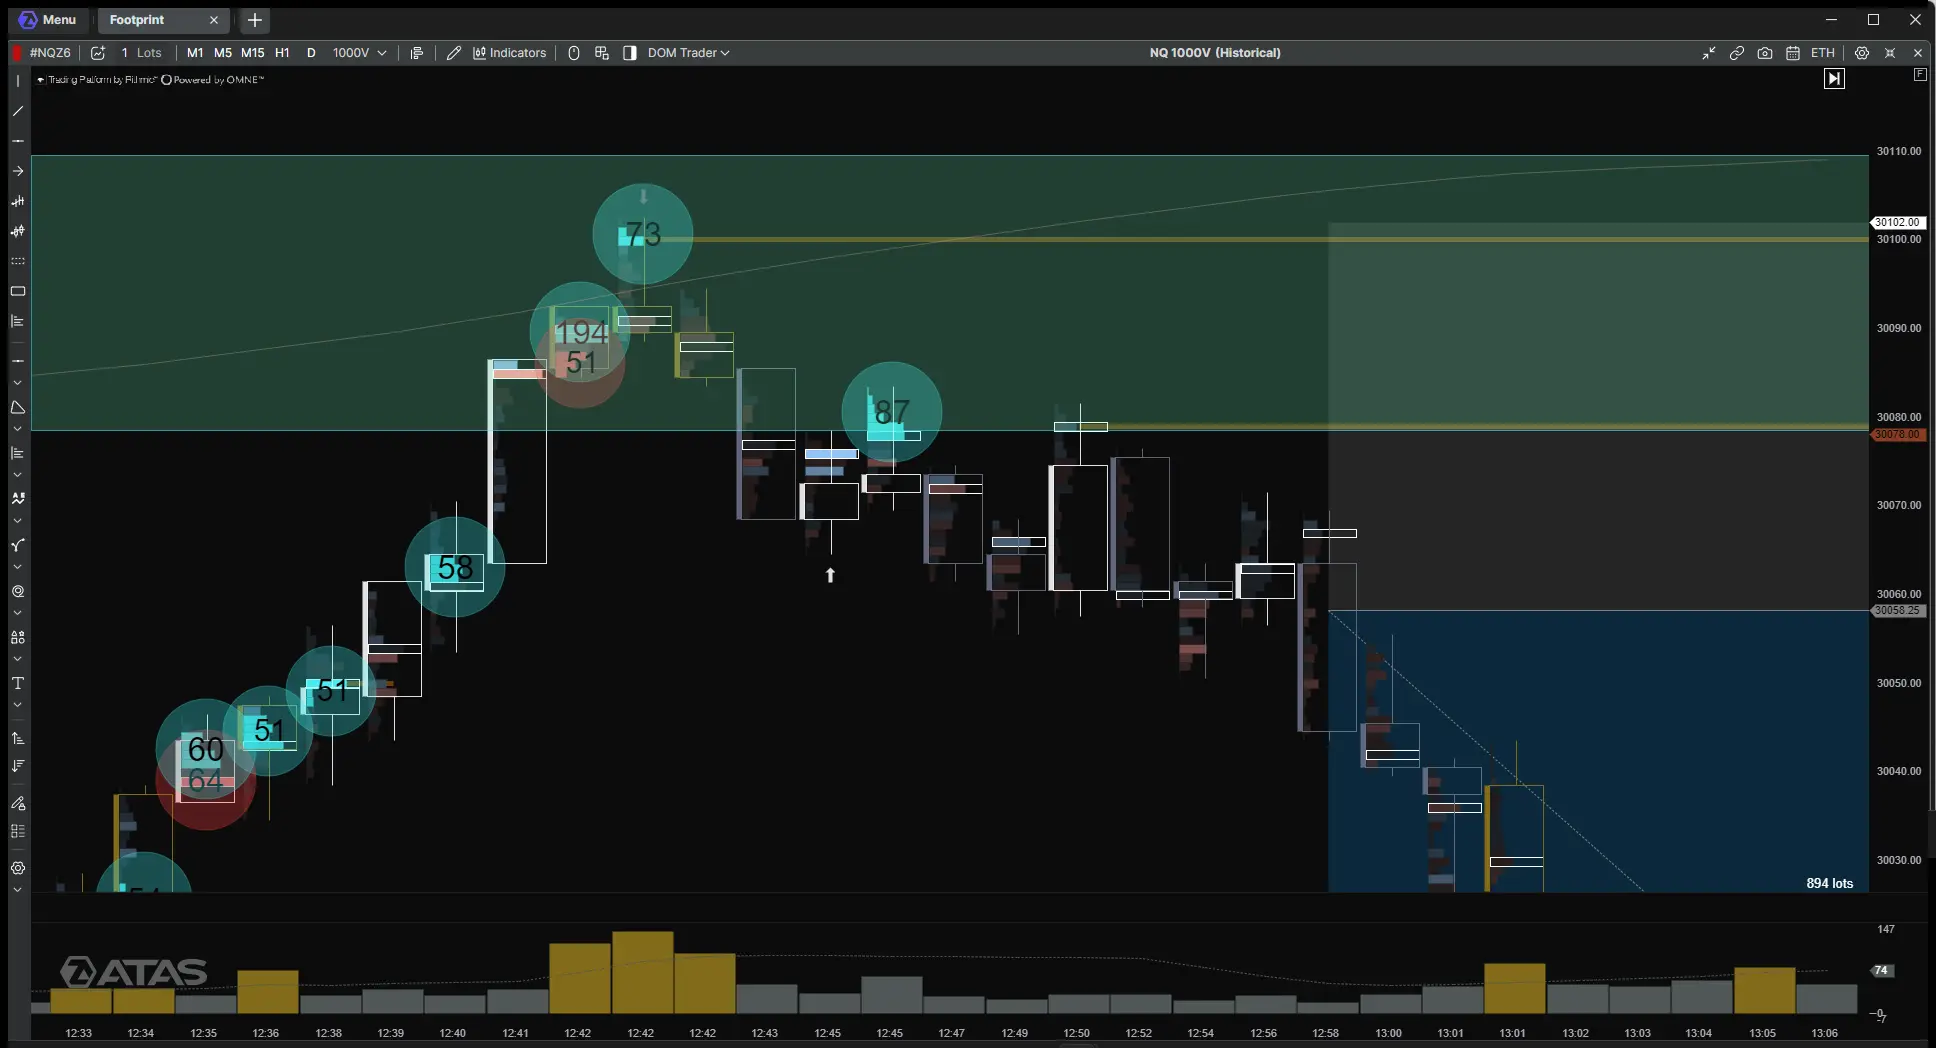
Figure 8: Big Trades markers on the NQ 1,000-volume chart during the approach to Zone A and the subsequent price response.
NQ Futures Case Study: From Zone A to the Session POC
Why Nasdaq Futures (NQ) Suit This Approach
Nasdaq-100 E-mini futures (NQ) move fast: during the regular session, it can move dozens of points within minutes. That speed makes a premarket map especially useful — the zones are defined before the open, so the decision at the zone is about reading the response, not about finding a level under time pressure. NQ is also highly liquid during RTH, so Footprint, delta, and Big Trades show enough activity at each price to read effort and result clearly.This makes NQ a practical market for an order flow strategy built around predefined zones.
Waiting for Confirmation: Volume, Delta, and the Entry
In this case, the one-minute chart places the 12:42 reaction on clock time, while the 1,000-volume chart shows the later shift in activity without assigning each bar a fixed number of minutes. At 12:42, price reached Zone A, the Absorption indicator flagged the reaction, and Big Trades marked activity near the zone. For the next 17 minutes, there was no confirmation: volume was not convincing, delta stayed close to neutral, and price made no clear progress lower. The short became actionable when selling volume increased, Cluster Statistics (the volume and delta rows below the chart) showed clearly negative delta, and price broke the short-term structure below the zone. The entry was taken at 30,058.25, 20.75 points below Zone A’s lower edge. Figure 9 shows the sequence on the 1,000-volume chart, with the entry, stop, and target marked.
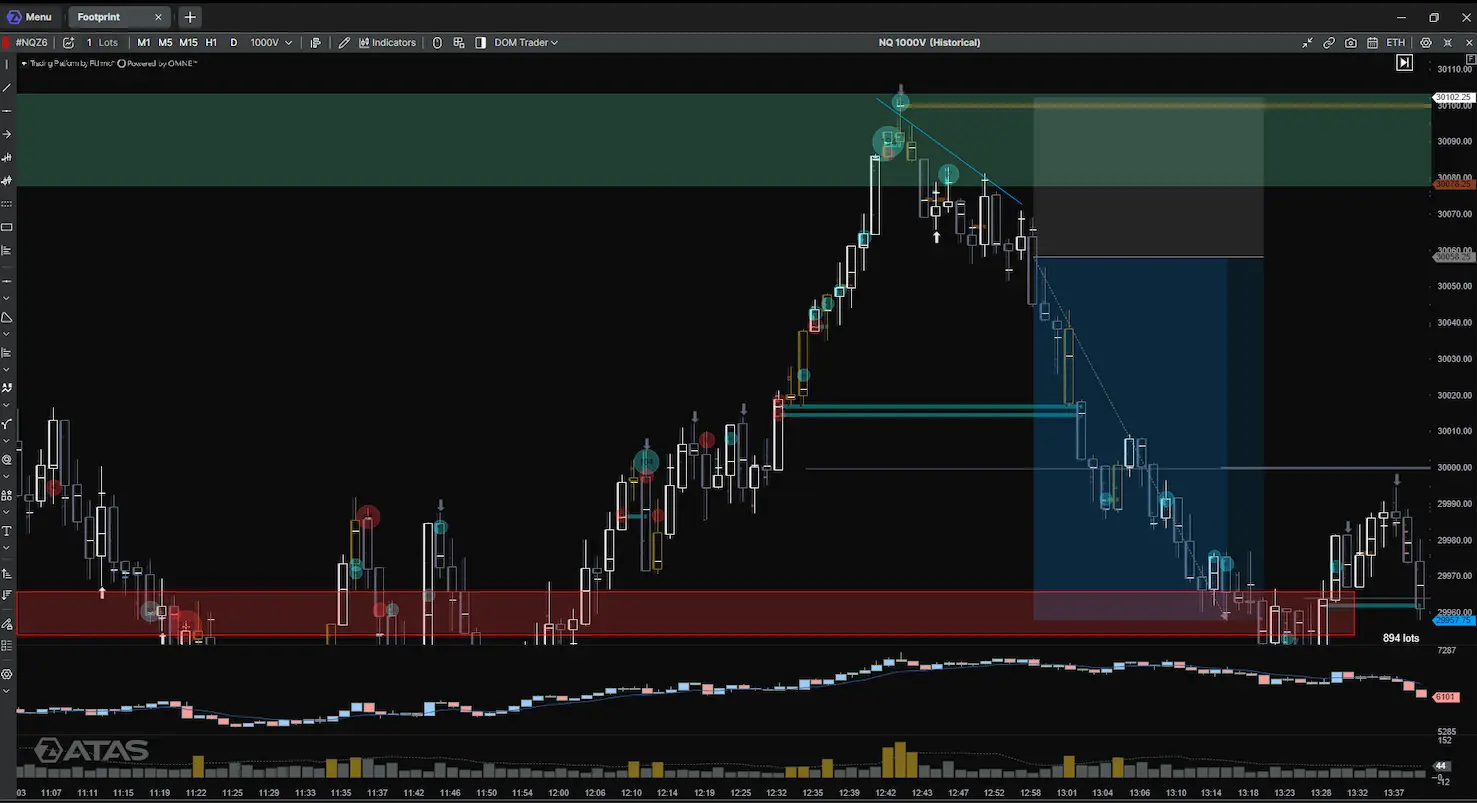
Figure 9: NQ 1,000-volume chart of the short sequence. The chart marks the entry level at 30,058.25, stop at 30,102.25, and planned target at 29,957.75, alongside the price move from Zone A.
Stop Placement
The planned stop was 30,102.25, or 44.00 points above the 30,058.25 entry. It was set above the level where the absorption reading appeared but remains inside Zone A (30,079–30,109), 6.75 points below the upper boundary.
How to Use Fixed Range Volume Profile to Set a Target
The target came from a Fixed Range Volume Profile of the session’s volume distribution as it stood at the entry decision. The procedure is:
- Select the Fixed Range Volume Profile drawing tool in the ATAS chart.
- Set the start of the range at the New York session open.
- Extend the range to the point at which the short decision was made and the entry was taken. Do not include the subsequent decline when deciding what the profile showed at entry.
- Read the POC, the price row with the greatest volume in that selected range. In this case, the selected POC was 29,957.75.
- Compare that level with other references already on the chart. In this case, the session POC was chosen as the planned objective.
The range endpoints matter because a developing profile changes as new volume is added. Holding the endpoint at the entry decision keeps later price movement from changing the information used to set the original target. Figure 10 shows the session profile and its POC target.
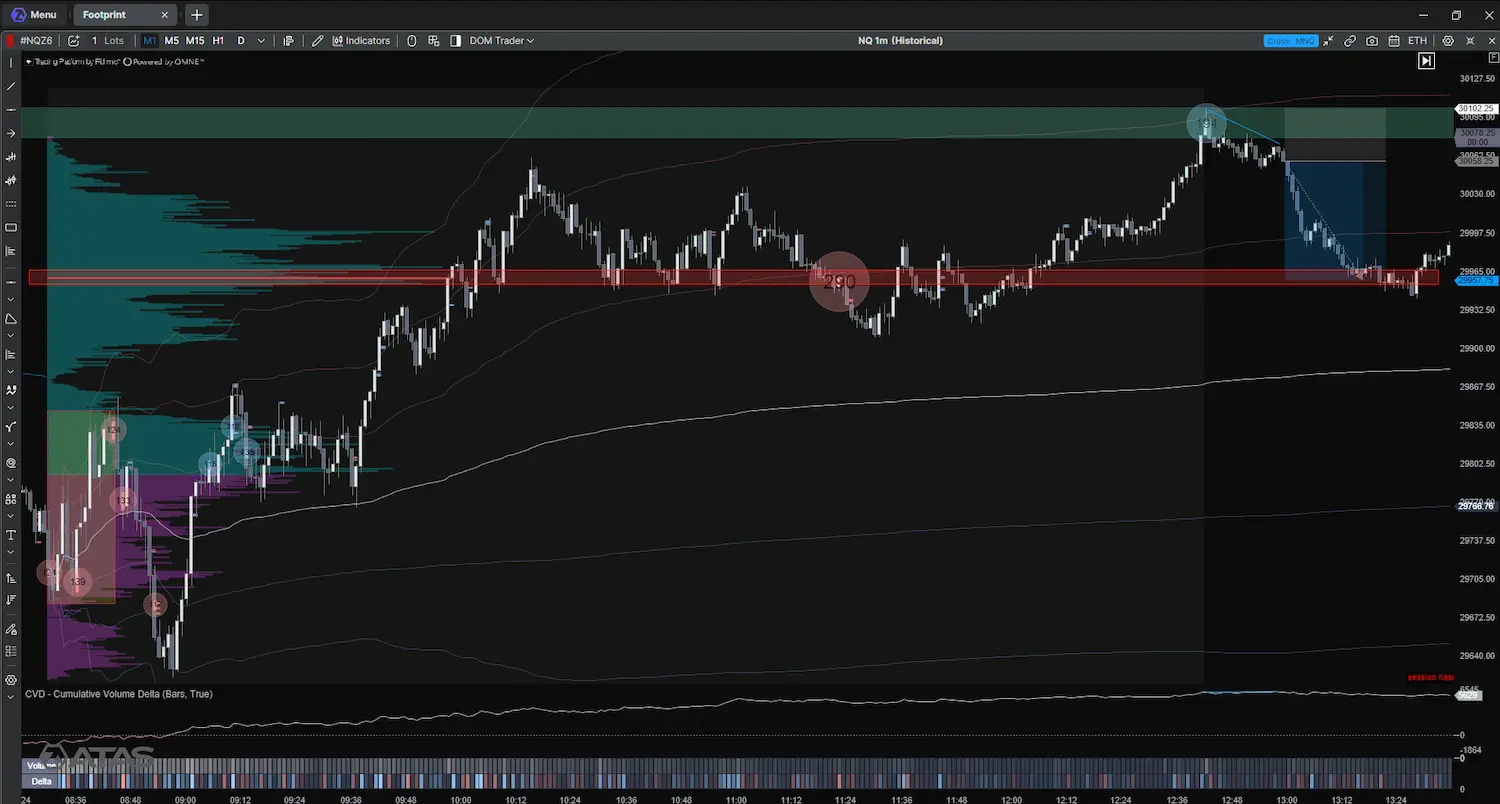
Figure 10: One-minute chart with the session Volume Profile, CVD, and volume/delta rows. The target marker is 29,957.75, the POC selected for the trade plan.
| Parameter | Value |
|---|---|
| Instrument | NQZ6 (December 2026 expiry) |
| Direction | Short |
| Entry | 30,058.25 |
| Stop | 30,102.25 |
| Risk | 44.00 points |
| Target | 29,957.75 Potential reward |
| Reward-to-risk | Approximately 2.28:1 before costs |
When the Setup Fails
The setup fails in three ways:
- No confirmation. Price stays inside Zone A, volume does not expand, and delta remains neutral. Without a break lower, there is no short.
- Acceptance above the zone. Price closes above 30,109 and holds there while buyers keep producing higher highs. The idea that sellers are capping price is no longer valid.
- Failed breakdown. Price breaks below the zone but quickly closes back above 30,079 with positive delta.
Before entry, these conditions mean staying flat. Once the short is open, the stop at 30,102.25 defines the exit.
Common Mistakes When Reading Order Flow at a Zone
- Treating the zone as an automatic entry. Zone A marks where to pay attention. The trade still needs a response in price and order flow; the first touch alone is not enough.
- Confusing aggressive buying with upward control. Ask-side executions show buying effort, but price must still make progress. If it cannot move above the prior high, compare the result with the effort instead of assuming buyers are winning.
- Reading CVD divergence without price structure. A CVD higher high alongside a price lower high is a mismatch, not an instruction to sell. The later break and downside movement matter.
- Treating Big Trades as proof of intent. A qualifying marker identifies activity under the chosen filter; it does not reveal who traded or whether the trade was opening, closing, or hedging a position. Use it to inspect the surrounding price response, not as proof that a large trader is entering or that a reversal is underway.
- Mixing profile references. A completed-session POC, a weekly POC, and the session-to-entry POC refer to different ranges. The 29,957.75 target came from the profile ending at the entry decision.
Volume Profile Strategy Checklist
- Are the completed RTH profiles balanced, or is value migrating up or down?
- Have the previous session’s VAH, POC, and VAL and the relevant HVN, LVN, or volume ledge been compared?
- Are the zone boundaries recorded before the open and carried onto the session charts?
- At the zone, does the price response show buying or selling effort, and what result is price producing?
- Did the Absorption reading draw attention to activity, and what did price do afterward?
- Is the stop placed beyond the level where the buying effort failed, and is the risk known in points?
- Is the target taken from a Fixed Range Volume Profile that ends at the entry decision?
FAQ
No. It shows that buying or selling effort is not producing a matching price move. In this case it mattered because it appeared at Zone A and was followed by a break lower.
Yes. MNQ (Micro E-mini Nasdaq-100) futures are one-tenth the size of NQ; the reading process is the same, only the contract size and exposure differ.
The one-minute chart places events in clock time; the 1,000-volume chart forms a new bar after every 1,000 contracts, which makes bursts of activity easier to follow as the move develops.
Information in this article cannot be perceived as a call for investing or buying/selling of any asset on the exchange. All situations, discussed in the article, are provided with the purpose of getting acquainted with the functionality and advantages of the ATAS platform.
Subscribe
Get the latest ATAS news delivered conveniently