
A sell-side liquidity sweep is confirmed by how price responds after it trades below a visible low, not by the break itself. In two Bitcoin examples, we use price closes, CVD divergence, open interest, and the ATAS footprint to separate a reclaim from acceptance below the level.
Why a Sell-Side Liquidity Sweep Needs Confirmation
A move below a previous low does not tell us whether a reversal or a breakdown will follow. The key question is how price responds to the selling: does it continue lower, or does it recover despite the selling pressure?
Sell orders can accumulate below a visible low. They may include stop-loss orders from traders holding long positions and entry orders from traders expecting a breakdown. Traders call this potential selling sell-side liquidity.
A sell-side liquidity sweep is a move below a visible low that can trigger the sell orders resting there, followed by a recovery back above that low. For the broader concept, see our liquidity sweep guide.
A reclaim is a recovery above the broken level. A candle closing above it provides the first price confirmation; the following bars show whether the reclaim holds. Cumulative volume delta (CVD), open interest (OI) and the footprint help explain the trades and changes in open exposure around the move.
We will compare two “Bitcoin (BTCUSD)” examples in ATAS. The October example shows a reclaim despite further aggressive selling. The September example also shows a price/CVD divergence during a rebound, but price remains below its reference level. Comparing the two cases shows what the indicators contribute and why a divergence alone is insufficient.
Start now!
Try ATAS free with no time limit
Setting Up the Workflow in ATAS
Instrument, Data Source and Units
Both cases use BTCUSD@Bybit, Bybit’s inverse perpetual contract, on an H1 (one-hour) chart. All timestamps use a fixed UTC+02:00 offset and mark the start of each hourly bar. All data relate to this contract on Bybit.
According to Bybit’s contract specifications, one BTCUSD inverse contract represents USD 1, and BTC is the settlement asset. Volume, delta, CVD and open interest for this contract are therefore expressed in USD contract quantities. They do not measure traders’ margin deposits.
Open Chart settings (gear icon at the upper right of the chart) → Visual Settings → Volume visualization and enable Minimize volume values to display compact K/M labels. Volumes in USDT applies to USDT pairs, so it stays off for BTCUSD.
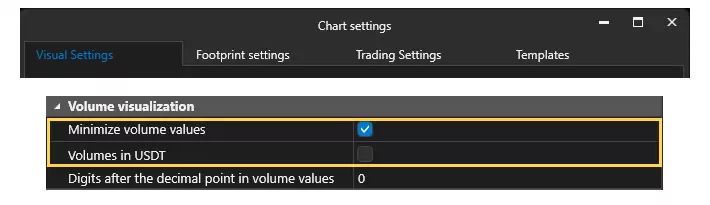
Figure 1. Chart settings → Visual Settings → Volume visualization. Volumes in USDT is off, Minimize volume values is on, and the number of decimal places is set to 0. These highlighted controls reproduce the display used in the examples.
K means thousands and M means millions. For BTCUSD, a volume label of 30M means approximately USD 30 million in traded contract quantity. Check the units again when switching instruments, because BTCUSD and BTCUSDT use different conventions.
Adding Cumulative Delta, Open Interest and Cluster Statistic
Click Indicators on the chart toolbar. Find and add Cumulative Delta, Open Interest and Cluster Statistic. The Added list in Figure 2 contains only these three tools.
Delta is ask volume minus bid volume. Buying at the ask is aggressive buying; selling at the bid is aggressive selling. A negative delta means that more volume was traded at the bid than at the ask. CVD adds these deltas over time. Comparing CVD with price shows whether successive waves of selling are still pushing price lower.
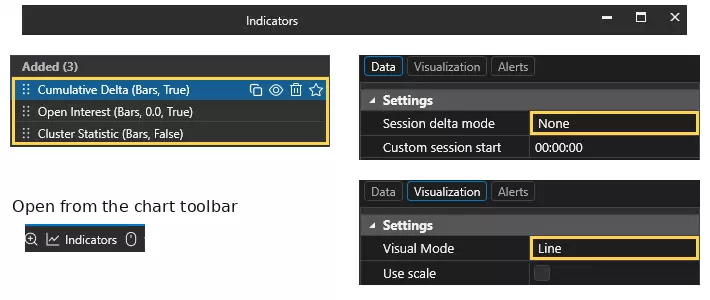
Figure 2. Chart toolbar → Indicators. The Added list shows the three indicators. Select Cumulative Delta → Data and set Session delta mode to None. Under Visualization, set Visual Mode to Line. The image combines focused crops of these controls.
Keep both comparison points in the same loaded chart and leave Session delta mode set to None. Loading earlier history can shift the CVD baseline without changing the difference between the two readings. Changing the reset mode can restart the cumulative total between those points. Do not compare an absolute CVD value from one configuration with a value from another.
Compare the low of bar A with the low of bar B, then compare the CVD readings at the same two timestamps. Section 3.2 compares the 19:00 and 21:00 bars on 8 October. The coloured A/B markers link each price bar to its corresponding CVD reading.
OI measures outstanding contract exposure. A rise means exposure is growing; a fall means it is shrinking. These aggregate changes do not identify which trades opened or closed positions, which groups of traders were involved, or whether positions were forcibly closed. Each open contract has both a long and a short side.
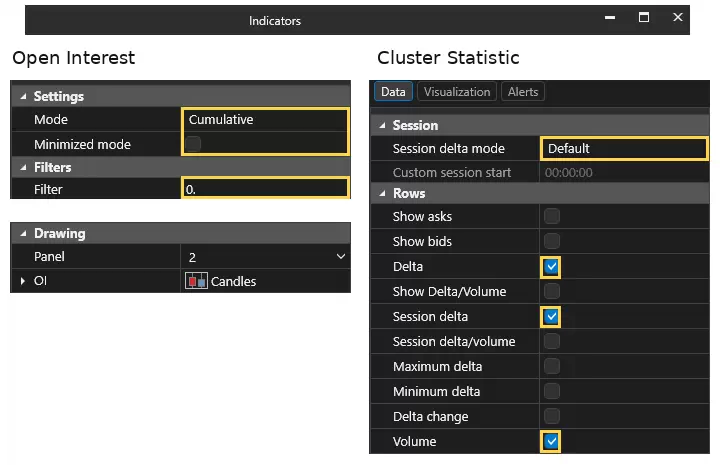
Figure 3. Indicators → Added → Open Interest: Mode is Cumulative, Minimized mode is off, Filter is 0, and OI is displayed as Candles. For Cluster Statistic → Data, enable Delta, Session delta and Volume. Its Session delta mode is Default, so the Session delta row uses a different reset setting from the CVD line.
On the H1 chart, each OI candle shows how open exposure changed during that hour. In the case studies, we use these changes to compare the phases of each event.
Footprint (Cluster Chart) Settings
A footprint shows executed volume within a candle at individual prices or grouped price rows. Open Chart settings → Footprint settings to reproduce the three views in Figure 4.
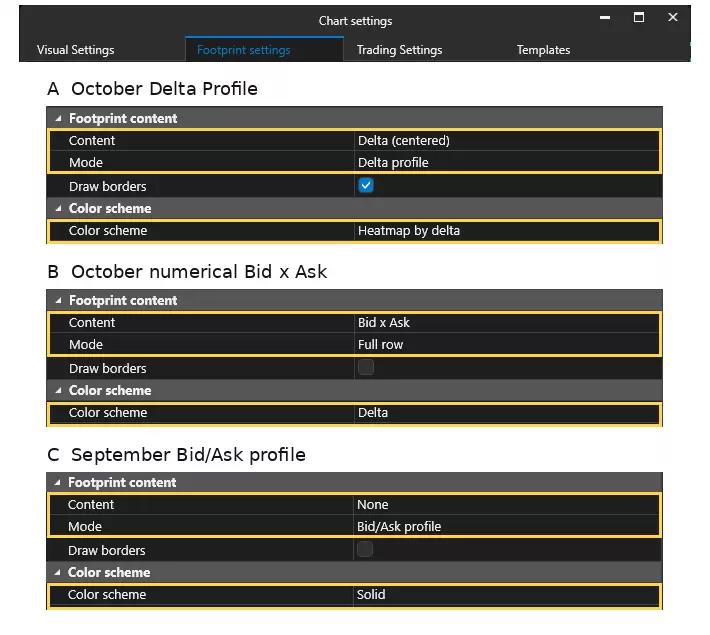
Figure 4. Footprint settings used in the article. A: October Delta Profile — Delta (centered), Delta profile, Heatmap by delta. B: October numerical footprint — Bid x Ask, Full row, Delta. C: September profile — None, Bid/Ask profile, Solid. The relevant controls are highlighted.
The October Delta Profile shows where net selling and buying occur as price approaches and recovers from the low. The numerical Bid × Ask view then lets us inspect one highlighted row. The September Bid/Ask profile displays bid volume in red and ask volume in green separately; these colours do not represent net delta at each row.
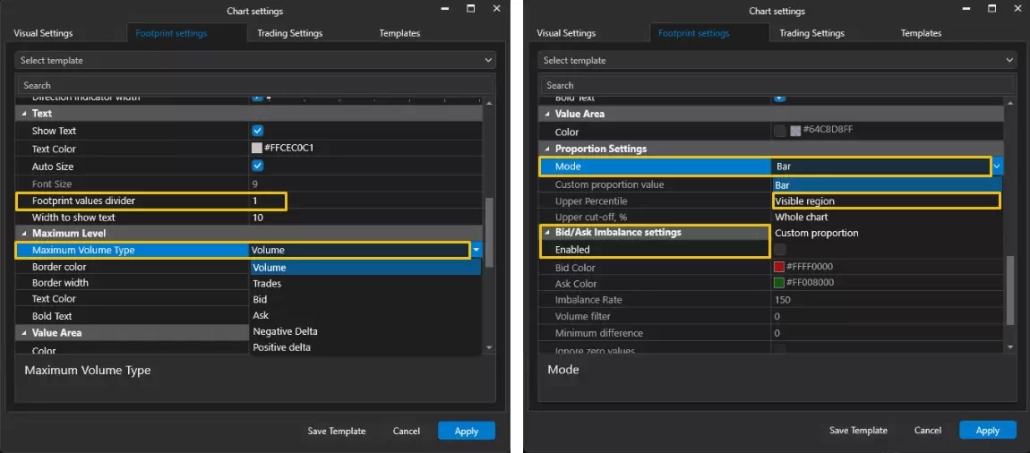
Figure 5. Footprint settings → Text: Footprint values divider = 1. Maximum Level: Maximum Volume Type = Volume. Proportion Settings: Mode = Bar for the October views and Visible region for September. Bid/Ask Imbalance settings: Enabled is off.
All three configurations use Footprint values divider = 1, no filters and no automatic Bid/Ask Imbalance highlighting. Maximum Volume Type is set to Volume, so the orange outline identifies the row with the highest total volume in its candle. Under Proportion Settings, Mode is Bar for the October views and Visible region for September. Use the displayed totals when comparing the examples, because the histogram lengths use different scaling references.
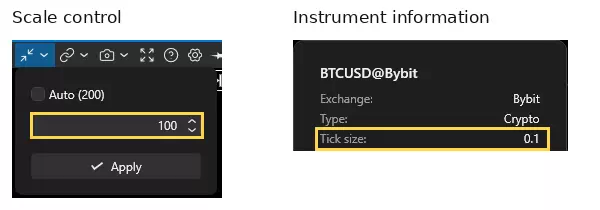
Figure 6. Upper-right chart toolbar → Scale control: enter 100, leave Auto unchecked and click Apply. In the instrument selector, click the information icon for BTCUSD@Bybit to view its Tick size of 0.1. Auto (200) is an inactive suggestion in the Scale screenshot.
Scale combines adjacent price levels. Here, 100 × 0.1 = USD 10 per row. To find a candle’s exact low or close, hover over its time column and read the O (open), H (high), L (low) and C (close) values at the upper left of the chart. Use these OHLC values to identify the exact extreme; an aggregated footprint row covers a range of prices.
Sell-Side Liquidity Sweep Example on Bitcoin: Confirmed Reclaim
Market Context and Liquidity Level
The reference is the 80,534.2 low formed on 20 September 2026 at 23:00. It is a local higher low near the base of the strong advance that follows. Price later pushes into the upper part of the visible range before the decline on 7–8 October brings it back to that earlier base.
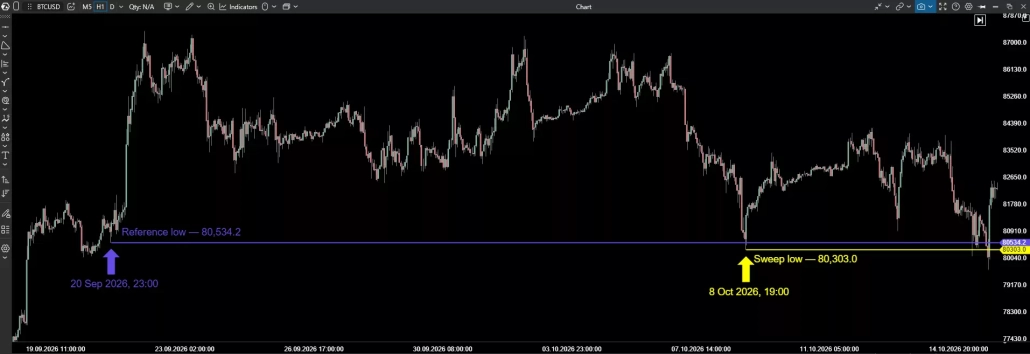
Figure 7. BTCUSD@Bybit H1 price overview. The purple arrow marks the reference low of 80,534.2, formed at 23:00 on 20 September. The yellow arrow marks the 8 October 19:00 sweep bar and its low of 80,303.0. All times use a fixed UTC+02:00 offset.
We use this higher low because it marks a distinct pullback before the advance. It is a visible local level below which traders may place stop-loss and breakdown entry orders. The older, deeper lows are separate reference levels for a broader test of the range lows. The October move tests this local higher low; it does not sweep every earlier low on the chart.
Reading the CVD Divergence
The divergence appears during the recovery, after price has traded through the reference level. Figure 8 marks both comparison points on price and CVD:
- A — 8 October, 19:00: price reaches 80,303.0. Use the CVD reading aligned with this bar.
- B — 8 October, 21:00: the low of 81,335.2 is above A’s, while CVD is below its reading at A.
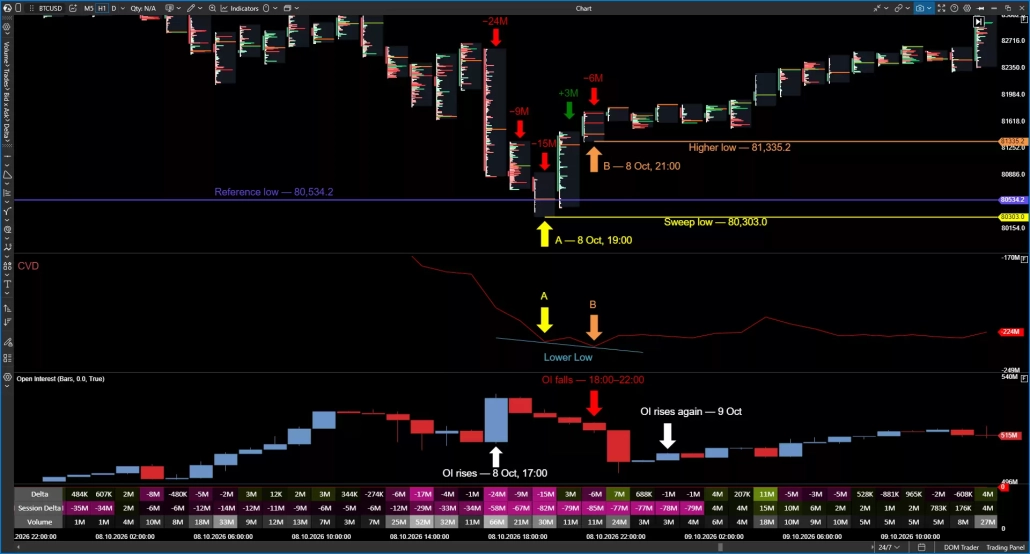
Figure 8. Aligned price, CVD, OI and Delta Profile panels. The yellow A and orange B markers identify the price/CVD comparison points. The five labelled bars run from 17:00 to 21:00 on 8 October. OI rises at 17:00, falls during the 18:00–22:00 bars, and rises again on 9 October.
The 21:00 bar records a delta of approximately −6M, yet its low remains well above the sweep low. The additional aggressive selling has not produced a lower low in price. This comparison pairs a higher hourly price low with a lower CVD reading.
The divergence appears during the rebound, not before the sweep. It suggests that selling is having less impact, but does not establish that bar B is a lasting structural swing low. CVD and the footprint are based on the same executed trades: CVD tracks cumulative delta, while the footprint shows how volume is distributed within each bar.
Interpreting the Open Interest Phases
Read the three marked phases in Figure 8 separately.
At 17:00 on 8 October, price falls while OI rises. Open exposure increases during the decline, so the activity cannot consist solely of existing positions being closed.
During the 18:00–22:00 bars, OI falls through the final decline and early rebound. Open exposure is shrinking during this phase. The initial recovery therefore does not represent a continuous build-up of new positions; position closures can contribute to the move.
On 9 October, OI rises again while price remains above the reference level during the recovery shown. Open exposure is expanding again after its earlier contraction. This later phase falls outside the initial reclaim check described in Section 3.5.
OI reveals a sequence that a single reading would miss: exposure grows before the low, contracts around the turn, then expands again. These phases help explain changes in participation, but none of them alone confirms that the reference level has been reclaimed.
Footprint Evidence: Absorption in the Sweep Candle
The five labelled Delta Profile bars in Figure 8 link aggressive selling to the price response. At 17:00, 18:00 and 19:00, their deltas are approximately −24M, −9M and −15M, respectively. The next two bars show +3M at 20:00 and −6M at 21:00.
The 19:00 sweep bar records about 30M in volume and a delta of −15M. Red areas in its Delta Profile show where net aggressive selling occurs within the bar. Its low is 80,303.0, but it closes at 80,650.6, above the 80,534.2 reference level. The numerical view makes one concentration of executed volume easier to inspect.
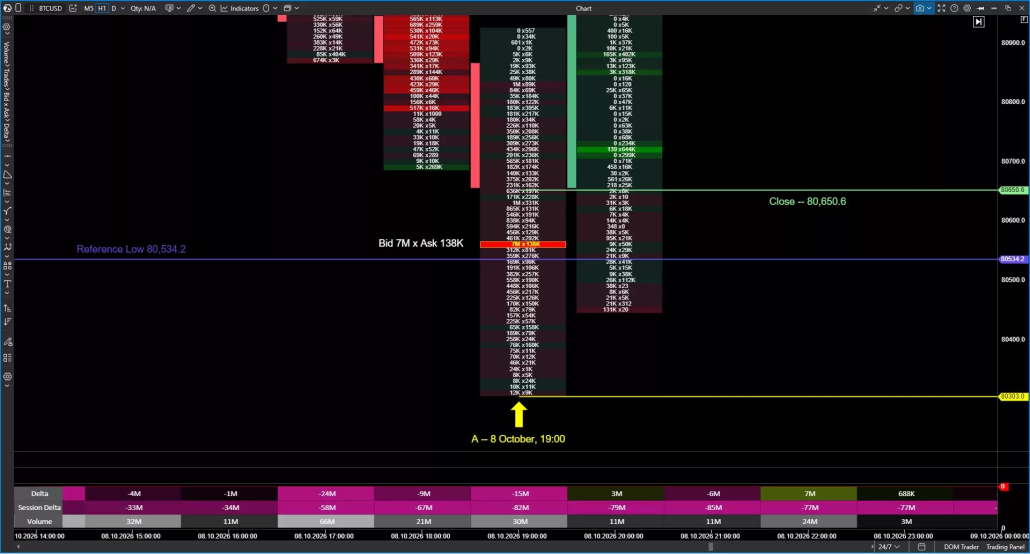
Figure 9. Numerical Bid × Ask footprint for the 19:00 bar on 8 October, at Scale 100. The reference level, low and close are labelled. The enlarged detail shows the highlighted 7M × 138K row from the same bar. This row lies above both the reference level and the sweep low.
Read the row from left to right: approximately 7M at the bid against 138K at the ask. Sellers initiated most of the volume there. The orange outline marks the row with the highest total volume in the bar; it is not an automatic imbalance signal.
The bar’s negative delta and its close back above the reference level are consistent with absorption: passive buy orders meet aggressive selling and limit its downward effect on price. Because the H1 footprint aggregates an hour of trades, it cannot show the exact sequence of executions, identify a specific buyer or show which trades came from stop orders.
Reclaim and Price Confirmation
The 19:00 bar closes at 80,650.6, reclaiming the reference level within that hour. For this historical review, we then assess the next two completed H1 bars: 20:00 and 21:00. Both close above 80,534.2.
The 20:00 bar trades below the reference level before closing above it. The 21:00 bar has a low of 81,335.2 and closes at 81,679.4. Both bars close above 80,534.2, so the reclaim holds on a closing basis over the two-bar window. The CVD divergence described in Section 3.2 appears within the same window.
The check ends when the 21:00 bar closes at 22:00. The two-bar window is defined for these examples; it is not a universal confirmation rule. The wider chart also shows a later return below the level, so the initial reclaim does not imply permanent support.
How to Confirm a Sell-Side Liquidity Sweep: Step-by-Step Workflow
Use a wider chart to identify the reference, then a footprint view to inspect the break and response.
- Choose a reference and a review window. Record the low’s price, timestamp and structural role before examining the subsequent bars. Choose how long you want to study the response, then express that period in chart bars. Here, we check whether the reclaim holds for the next two hours: two completed H1 bars. Later developments are reviewed separately.
- Record the break bar. Read its low and close from the OHLC display. A close above the reference establishes a reclaim; a close below leaves it unconfirmed.
- Check the next completed bars. Apply the same two-bar check to both cases. A close back below the reference level within that window means the reclaim fails this particular test. An intrabar dip followed by a close above the level, as in October, does not count as a failure.
- Align price and CVD. Compare the lows of two specified bars and the CVD readings at the same timestamps. Note whether the divergence appears before or after the reclaim. A divergence while price remains below the reference level supports a rebound interpretation, but does not establish a completed sweep.
- Divide OI into visible phases. Mark where OI changes direction during the approach, break and recovery. For each phase, note whether open exposure increases or decreases, rather than describing the whole event as a period of rising or falling OI.
- Locate the footprint evidence. State which bar and row contain the executions, whether they are above or below the reference, and how price responds. Selling followed by a reclaim has a different implication from selling followed by lower lows and closes below the level.
When the indicators and price suggest different interpretations, explain the disagreement. A CVD divergence or OI contraction does not override a failed reclaim. Conversely, a reclaim without a divergence lacks one element of the October example. When practising, reveal the bars one at a time so that later developments do not influence your reading of the initial break.
Counter-Example: A Failed Sweep with Acceptance Below the Level
Acceptance means price continues to trade in an area, with repeated bar closes there. In the September example, price stays mainly below the broken reference level despite a rebound.
The reference low is 85,040.1, formed on 22 September at 07:00 during the pullback between the two preceding highs. On 23 September, the bar starting at 16:00 breaks below it, reaches 83,801.8 and closes at 84,461.2.
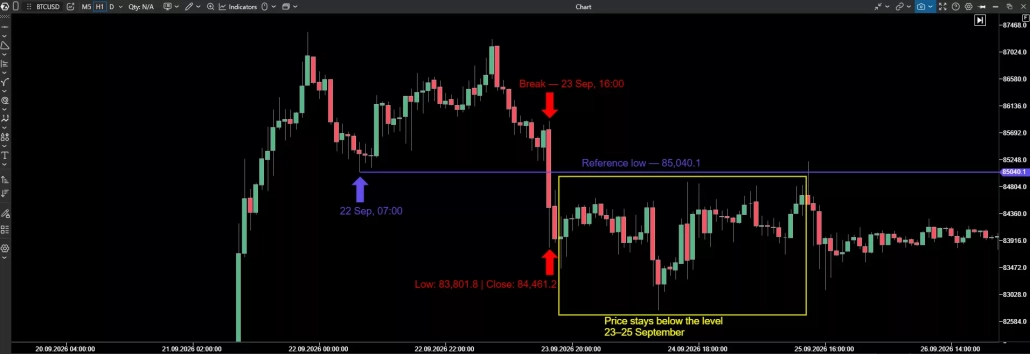
Figure 10. September price overview. Labels identify the reference level and the low and close of the bar starting at 16:00 on 23 September. The yellow rectangle shows the broader response during 23–25 September, mainly below 85,040.1.
Apply the same initial review window used for October: the 17:00 and 18:00 H1 bars. Both close below the reference level. The 18:00 bar reaches 83,449.1 and closes at 83,977.0. The reference level remains unreclaimed, and price makes another lower low during the review window.
CVD and OI fall during the break. CVD records aggressive selling, while the marked OI decline during 16:00–18:00 shows shrinking open exposure. Unlike the October approach, the September break is accompanied by a reduction in exposure. The subsequent lower low shows that this contraction does not itself mark the end of selling pressure.
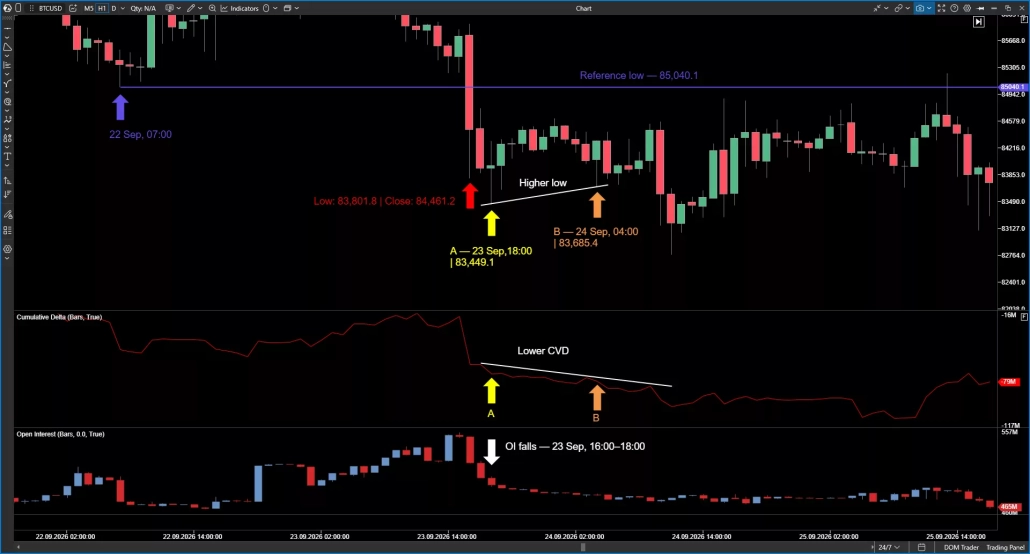
Figure 11. September price/CVD comparison and OI decline. Point A marks the 18:00 bar on 23 September, with a low of 83,449.1. Point B marks the 04:00 bar on 24 September, with a low of 83,685.4. CVD is lower at B than at A, while price remains below the reference level. The OI arrow marks 16:00–18:00 on 23 September.
The later rebound also shows a price/CVD divergence. At B, the price low of 83,685.4 is higher than A’s 83,449.1, while the CVD reading is lower. The CVD reading at 04:00 is not the lowest across the whole interval. The price bar closes at 84,309.1, still below 85,040.1.
This later comparison is outside the initial two-bar check. It shows why a divergence can accompany a rebound without confirming a reclaim of the original level.
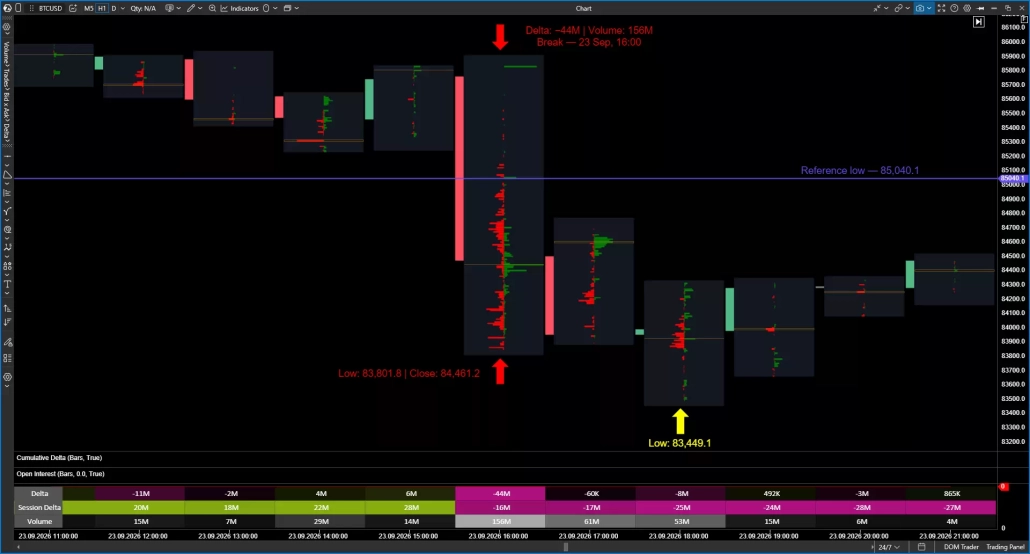
Figure 12. September Bid/Ask profile of the 16:00 break bar. Red bars show bid volume and green bars show ask volume. Cluster Statistic shows a delta of approximately −44M and volume of 156M. The yellow arrow identifies the later 18:00 low of 83,449.1.
The footprint shows executions below the reference level, with a strongly negative total delta for the break bar. The exact values are a volume of 156,203,853 and a delta of −44,270,815, rounded to 156M and −44M in Figure 12. Unlike October’s sweep bar, this bar closes below its reference level, and the next two hours bring further price weakness.
The broader 23–25 September range provides further context for acceptance. A later candle, just beyond the highlighted range, has a wick that extends above the reference level while its body remains below. Acceptance here means price mainly trades and closes below the level; it does not require every later trade to stay below it.
Key Takeaways and Checklist
- A move below a previous low does not by itself show whether a reversal or a breakdown will follow. The price response after the selling decides the case.
- In October, the 19:00 sweep bar closed back above the 80,534.2 reference level, and the next two H1 bars also closed above it. In September, the 16:00 break bar closed below 85,040.1, and the next two bars closed below it as price made a lower low.
- A price/CVD divergence suggests that selling is having less impact on price. It appeared in both examples: after the reclaim in October and during a rebound below the reference level in September. On its own, it does not confirm a sweep.
- OI shows how open exposure changes. In October, exposure grew before the low, contracted around the turn and grew again later in the recovery. In September, it contracted during the break while price continued lower. A fall in OI alone is not a reversal signal.
- The footprint locates and quantifies the selling. October’s sweep bar recorded 30M in volume and a −15M delta, yet closed back above the reference. September’s break bar recorded 156M in volume and a −44M delta, closed below the reference and was followed by a lower low.
The table summarises how the two examples differ.
| October: confirmed sweep | September: acceptance | |
|---|---|---|
| Reference low | 80,534.2 (20 Sep, 23:00) | 85,040.1 (22 Sep, 07:00) |
| Break bar | 8 Oct, 19:00: low 80,303.0, close 80,650.6 | 23 Sep, 16:00: low 83,801.8, close 84,461.2 |
| Break bar close vs level | Above | Below |
| Next two H1 closes | Both above | Both below, with a lower low |
| Break bar volume / delta | ~30M / −15M | ~156M / −44M |
| Price/CVD divergence | After the reclaim | During a rebound below the level |
| Open interest | Rose before the low, fell around the turn, rose again | Fell during the break |
| Result | Reclaim held over the two-bar window | Acceptance below the level |
Table 1. October reclaim vs September acceptance.
Before finishing your review, check:
- Have you recorded the contract, exchange, timeframe, time zone and units?
- Is the reference low marked with its price, timestamp and structural role, before you examine the subsequent bars?
- Did the break bar close above or below the reference, based on its OHLC values?
- Did the next completed bars in your review window close above the level, or did price close back below it?
- Are the two price lows and the two CVD readings taken at the same timestamps, and does the divergence appear before or after the reclaim?
- Have you divided OI into visible phases and noted whether open exposure increased or decreased in each?
- Do you know which bar and row contain the footprint evidence, whether it lies above or below the reference, and how price responded?
- If the indicators and price suggest different interpretations, have you explained the disagreement?
These examples illustrate one way to read the evidence around a sweep. They do not establish a trading strategy’s success rate or guarantee the next outcome.
FAQ
Check whether the break bar closes back above the swept low and whether the next completed bars also close above it. CVD divergence, open interest and footprint data help explain the move, but none of them replaces a reclaim on a closing basis.
It trades below the reference low and then closes back above it. In the October example, the 19:00 BTCUSD candle showed heavy aggressive selling (about 30M in volume and a −15M delta), yet closed at 80,650.6, above the 80,534.2 reference. Heavy selling alone does not identify a sweep: the September break bar also showed strong selling but closed below its level.
No. A price/CVD divergence suggests that selling is having less impact, but it appeared in both examples, including the September case where price stayed below the reference level. It supports a rebound interpretation, not a completed sweep.
Open interest shows whether open exposure is growing or shrinking. It does not show which side opened or closed positions, so it is best read in phases: before the low, around the turn and during the recovery.
In a sweep, price trades through the low and closes back above it. In acceptance, price keeps trading and closing below the broken level, as in the September example, even if a later wick briefly returns above it.
There is no universal rule. Define the review window before examining the bars and apply it consistently. In these examples, we checked whether the next two completed H1 bars closed above the reference level.
Information in this article cannot be perceived as a call for investing or buying/selling of any asset on the exchange. All situations, discussed in the article, are provided with the purpose of getting acquainted with the functionality and advantages of the ATAS platform.
Subscribe
Get the latest ATAS news delivered conveniently