From MBO data integrated into the liquidity map to smarter risk control — in Latest 8.0.15, we’ve packed in features that make a real difference to the depth of your analysis and help you keep emotions out of your risk decisions. We also focused on expanding intermarket analysis and cutting unnecessary routine out of your daily workflow.
Let’s walk through the 7 key updates in the latest version of ATAS.
MBO Bundle Inside Heatmap (Beta)
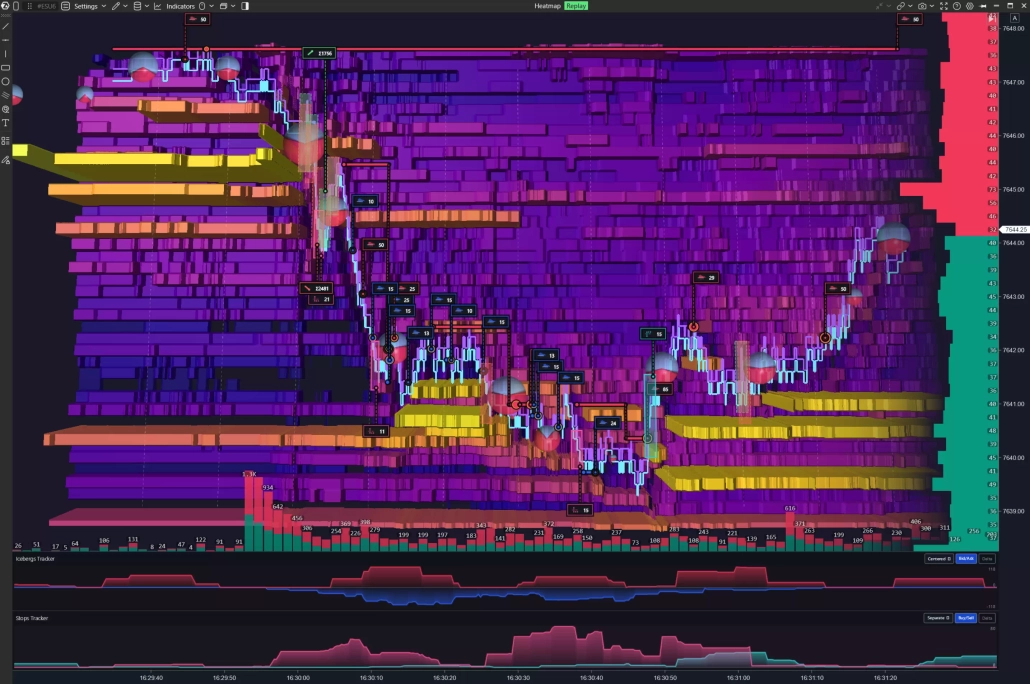
MBO (Market By Order) is more than just volume data. It lets you see every individual order in the order book and track how large participants place, modify and pull their orders.
We’ve combined two of our flagship modules in a single window. You can now analyze the Heatmap liquidity map (with its smooth 600+ FPS rendering) and overlay indicators from the premium MBO Bundle add-on:
- Iceberg Tracker — uncovers the hidden volume of large limit orders and highlights levels where “icebergs” are holding price.
- Sweeps Tracker — highlights aggressors who take out liquidity across several price levels in a single hit.
- Stop Runs Tracker — shows cascades of triggered stops that send the market into a sharp impulse.
☝🏻 MBO Bundle indicators are available in test mode for users with an Ultra subscription. Working with MBO requires a Rithmic connection.
Risk Manager: Your Discipline Assistant
“I’ll just move my stop.” “One more trade and I’ll win it back.” We all know how that ends. The new Risk Manager module helps you stick to your daily discipline: you set your limits in advance, and the analytics platform automatically tracks whether they’re being respected.
What you can keep under control:
- Daily loss limit;
- Session P&L target;
- Maximum number of trades;
- Maximum allowed streak of losing entries.
When a limit is exceeded, the system responds exactly the way you’ve configured it: from a simple notification to blocking new entries in Reduce Only mode (you can only reduce or close your current positions).
And to remove the temptation to rewrite the rules in the heat of the moment, you can lock your settings until the end of the day. If you decide to lift a restriction early, you’ll have to type in a confirmation phrase — a pause that gives you time to cool down and think twice.
Replay: A New Interface in ATAS Classic and a Release in ATAS X (Beta)
Replay, the simulator for analyzing historical data, has a new compact design in ATAS Classic. It’s now a sleek panel with all the buttons you need that doesn’t cover your chart or DOM. What’s more, you can drag the module anywhere on the screen.
Set up what you need from the start. Click Select Module and then click the window you want (Chart, Smart DOM, Smart Tape or Heatmap) to switch it to playback mode instantly.
Choose an asset: any futures, stocks or cryptocurrency whose price movement you want to analyze again.
Choose a playback mode:
- Generated Ticks and DOM: the fastest start, with ticks and DOM generated from historical data.
- Ticks + Generated DOM: uses real historical ticks with an automatically generated DOM.
- Ticks + DOM (real ticks and DOM): the most accurate mode, based on real ticks and real order book depth.
Choose where to start:
- Select Bar — start from a specific bar on the chart;
- Select Period — replay a specific time window (for example, the first hour of the US session);
- Select Date — load historical data for a selected day.
Control the navigation: change the speed on the fly, step forward one candle at a time, jump to the start or end of the period, pick any point using the Progress Bar, return to Real Time instantly and save custom templates with your settings.
Loop interesting sections. Need to review the same moment from the past several times? Turn on Auto Replay, and once the section ends, price will run through the same path again.
💡 What about ATAS X (Beta)?
Replay is now also available in the new ultra-fast version for Windows and macOS — for now, with the familiar interface.
Overlay: Intermarket Analysis on a Single Chart
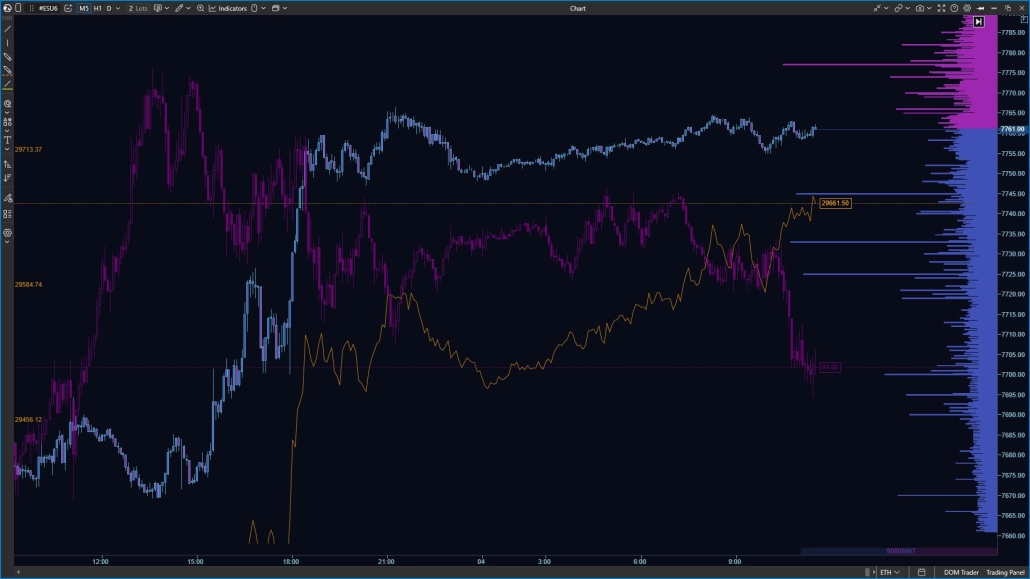
Want to compare ES and NQ, or see how crypto reacts relative to a futures contract? You no longer need to clutter your workspace with separate charts for different assets. Overlay mode lets you plot several additional instruments on a single chart.
- Lead/Lag analysis: see at a glance which market moves first and which one lags.
- Quick cross-check: check whether a move is confirmed by related assets.
- Flexible settings: color, opacity, scale and a separate price axis for each asset — your chart stays easy to read.
☝🏻 Indicators can only be applied, and orders can only be managed independently from the chart, for the main instrument.
Global Drawing Objects in Smart DOM
Lines, rays, rectangles and Highlight Y zones can now be displayed directly in Smart DOM. Simply turn on the “Global” toggle in the object’s settings.
- All your levels in view: mark an important zone or profile on the chart, and it instantly shows up in the DOM.
- Less mental clutter: no more darting your eyes between windows and memorizing numbers.
- Precise analysis: see how liquidity reacts to your levels, down to the tick.
Marking up levels just got even easier.
Single Stock Futures (SSF)
The Instruments Manager now has a Single Stock Futures (SSF) category — CME futures on individual company stocks (Apple, Microsoft and others).
Select the contract you need in the Instruments Manager and analyze it in your favorite ATAS modules.
☝🏻 Keep liquidity in mind: these instruments are new, so activity is higher on top companies, while the DOM may look thin on less popular stocks.
Duplicating Indicators on the Chart
Need to add several copies of the same indicator to a chart, each with different settings? Now you can.
For example, say you’ve set up one Big Trades indicator: you set a volume range (say, 100 to 500 contracts), configured the maximum aggregation time, chose to display trades as blue bubbles and turned on a sound alert.
Now you can copy it in one click, with all its styling, and in the second copy change only the volume (from 1,000) and the highlight color to track the largest volume spikes.
What’s more, you won’t get your copies mixed up. You can give each indicator its own name — for example, label them right on the chart as “Big Trades 500” and “Big Trades Whales” — so you know at a glance what each tool in the list is for.
Update and Try It Out
All these and other features are already available in version 8.0.15.
Restart ATAS, then download and install the update. It takes no more than a couple of minutes. Put the new features to work in practice — from the MBO + Heatmap combo to strict risk control and more convenient work with indicators.
If you have any questions or ideas for improvement along the way, our support team and community are always here for you. See you on the charts!
Subscribe
Get the latest ATAS news delivered conveniently