Market profiles: 3 things for your trading.
Any retail trader can get an access to a wide spectrum of professional analytical instruments thanks to state-of-the-art developments, implemented in the trading and analytical ATAS platform.
Today we will speak about the Market Profiles, one of the indispensable indicators of the volume analysis of the market. Of course, it requires a thorough study as well as any other analytical instrument. Nevertheless, we can immediately distinguish three main specific features of the Market Profiles, which are able to increase the efficiency of your trading right now.
In this article:
- Key levels;
- Advantageous location of a trade;
- Market context.
Key levels.
The most useful feature of the Market Profiles indicator of the ATAS platform is that it displays in the form of a chart, in the course of the price movement, the key support and resistance levels, the roles of which are played by:
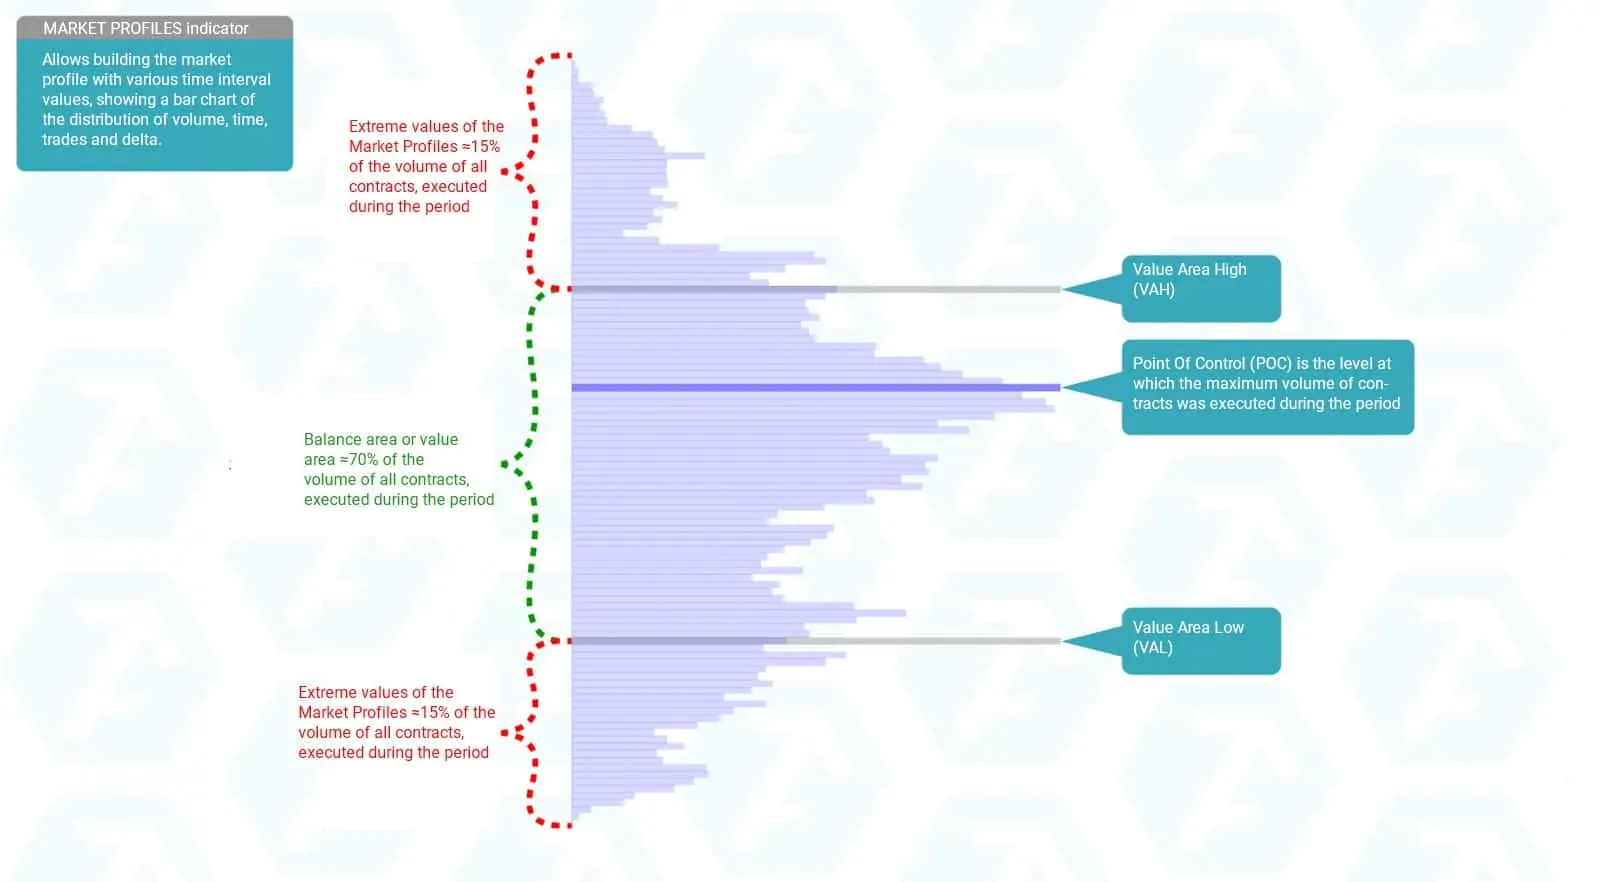
- the Value Area High (VAH) – the highest price in the Value Area;
- the Value Area Low (VAL) – the lowest price in the Value Area;
- the Point Of Control (POC) – the price level, at which the maximum number of contracts were executed during a selected period.
Simply speaking, this indicator shows the levels, at which the future asset value could be reassessed by the market participants. Consequently, these levels could be used by a trader when opening or closing trades.
The Value Area and Point Of Control clearly show where the market stays in a balance and where extreme values of this balance are located. The Market Profiles, which characterizes the most balanced market, and also its Value Area, VAH, VAL and POC are displayed below:
The market could be considered by a trader as very cheap or, on the opposite, very expensive in the area of extreme values. However, the market situation might change by the moment of formation of the Market Profiles during the next period of time. Consequently, the idea of its participants with respect to the very low or very high cost of the asset may also change. These changes will be reflected on the location of all basic elements of the Market Profiles, such as: Value Area, VAH, VAL and POC.
You can read about examples of use of the VAH and VAL in trading in the following articles: Strategy of using the footprint through the example of gold and Strategy of using the footprint through the example of E-mini S&P 500.
Advantageous location of a trade.
The balance area, or Value Area, is a range of prices, within which about 70% of all trades are executed during a selected period of time. The other 30% of trades are executed outside the Value Area (≈15% above the VAH and ≈15% below the VAL). When the price is above or below the Value Area, there is a high probability that it would come back to the balance area. Consequently, when you open trades for selling/buying, you need to take into account the fact that the price, which leaves the Value Area, would come back to it with a high degree of probability.
Chart No. 1. 15-minute chart of a EUR futures (ticker: 6E) of the ATAS platform.
As you can see in chart No. 1, the price found support at the VAL and came back to the balance area several times during the whole trading day on June 26. The similar situation was observed again the next day (June 27).
However, the most outstanding thing in trading outside the Value Area is that if the situation in the market changes and it ceases to be balanced, moving into the trend state, these changes would become evident namely outside the Value Area. It would help the trader, who is waiting for the price to come back to the balance area, to maximally limit the size of risk in the open trades.
The chart No. 2 below shows the area of chart No. 1, outlined with a grey dashed line, in detail. You can monitor who takes initiative near key levels of the Market Profiles in real time thanks to the Footprint chart. It would help you to quickly close a knowingly loss-making trade without waiting for a stop loss and open a new trade in the profitable direction.
Chart No. 2. 15-minute chart of a EUR futures (ticker 6E). The Bid x Ask footprint chart of the ATAS platform.
Market context.
A trader should have an understanding of the current market situation and its context. As a trader you should ask yourself: “Is the market unbalanced and does it move with a focus or it is in the state of a balance of demand and supply and on what timeframe? What is the market context near critical support and resistance levels and on what timeframe? Do we expect a broadcast of news that may change the current market situation?” A strong trend on a smaller timeframe could be just a part of the correction on a bigger timeframe, that is why it is always important to know where the key support and resistance levels are located on bigger timeframes.
The market context is a rather complex concept. Nevertheless, the Market Profiles can help you to systemize the market information in a convenient form even on daily and weekly timeframes. The key Market Profiles levels of bigger timeframes will become a secure foothold for making your trading decisions.
You can read about an example of use of the Value Area Low (VAL) of the previous day in the following article: Strategy of using the footprint through the example of Russell 2000 E-mini.
The Market Profiles is not a simple topic. It requires further study. Nevertheless, you can start using the described Market Profiles features right now after downloading the ATAS platform free of charge. In this article we have touched only some of the ideas of efficient application of the Market Profiles in trading. We believe that the Market Profiles indicator of the ATAS platform will help you to understand the market better. Happy trading!


