Types of ATAS Indicators, Their Functions and Configuration

ATAS Indicators: Types, Purpose and Configuration

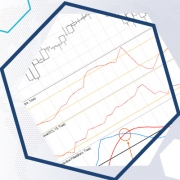
This article explains the principle behind categorizing all available indicators on the platform. Novice ATAS users can also gain insights into the purpose of indicators and how to work with them. Read in the article:  Why Indicators Are Necessary About Categories of Indicators in the ATAS Platform Bid x Ask, Delta, Volume Clusters, Profiles Commitments […]

CCI Indacator

Is it possible to combine the cluster analysis with the CCI indicator?

The subject of our today’s article is the CCI indicator. This article is another one in the series of publications about technical indicators. What is interesting about the CCI indicator? Read in this article: what CCI is, definition and calculation formula; how to trade using the CCI indicator – examples and testing using historical data; […]

Adding (combining) indicators in the ATAS platform

Adding indicators in the ATAS platform

Stock exchange trading and technical analysis of financial charts are closely connected with indicators. The present article is about convenience and powerful functionality, which the ATAS platform provides when working with indicators. Read in the article: What indicators and their purposes are How indicators are displayed How to combine indicators in the price window How […]

How to improve signals quality with Voss Predictive Filter

How to use filters in the Delta indicator

How to use filters in the Delta indicator

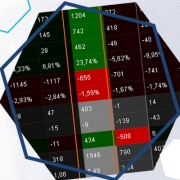
Unfortunately, many trading platforms do not contain volume indicators at all. Some of them transfer volumes but only tick ones or without dividing them into buys and sells, which limits traders in receiving important information. The ATAS platform allows analysing both buyer and seller behaviour separately not only in the horizontal projection (in other words, […]

The Coppock Curve indicator. How to apply the Coppock Curve in trading

How to apply the Coppock Curve in trading

Coppock Curve is a momentum indicator. It was developed by Edwin ‘Sedge’ Coppock, who was an economist by education. The original goal of this indicator was to detect long-term opportunities for buying in S&P 500 and Dow Industrials. However, can it be used for other markets / periods and how profitable are the curve signals? […]

How to test your trading system automatically

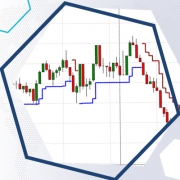
How to test trading system automatically with Super Trend

How to find strong intraday levels and how to trade them?

This article raises the issue of the significance of dynamic trading systems, which independently adapt to the market. How to develop them? We will try to demonstrate it with the use of 2 indicators. The Dynamic Levels indicator will find strong dynamic intraday levels, while the Cluster Search indicator will show traps for sellers and […]

Differences between the Cluster Search and Big Trades indicators. Detailed analysis with 4 examples2

Differences between Cluster Search and Big Trades indicators

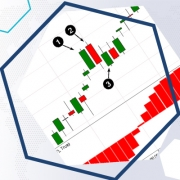
The Cluster Search and Big Trades indicators are important instruments from the ATAS platform. They can be very useful to the financial market participants who apply various trading styles. This article has been written in order to help traders to use the Cluster Search and Big Trades indicators correctly. Read in this article: Specific features […]