
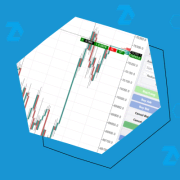
The Session Volume Profile (SVP) indicator is a market profile tool designed to display horizontal volumes for a specific trading session. In simpler terms, it is a market profile built based on a defined time interval — from a selected “begin time” to an “end time.”
In this article, we will explain in simple terms what stop-loss and take-profit are and how to use them in ATAS. Read more: What Is Take-Profit? What Is Stop-Loss? How to Use Stop-Loss and Take-Profit? Linked (OCO) Orders
Copy trading is a form of interaction in financial markets where trading operations on one account are automatically replicated on another. The accounts can belong to the same or different individuals (provider and follower), and the copying occurs based on the proportional capital allocation on respective accounts. There are also other nuances to consider. In […]
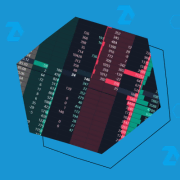
The Smart DOM (Depth of Market) is a module of the ATAS trading and analytical platform. It provides traders with a user-friendly interface to analyze detailed information about limit orders and make informed trading decisions. In this article, we delve into the enhanced functionality of this module and explore how it can help traders capitalize […]
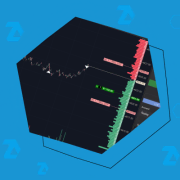
Exit strategies in trading involve a range of actions traders take to protect their capital from losses. Since losses are inherent to the profession, developing an exit strategy involves finding, achieving, and maintaining an optimal balance where losses are offset by profits. This article will delve into the tools for implementing exit strategies available in […]

This article explains the principle behind categorizing all available indicators on the platform. Novice ATAS users can also gain insights into the purpose of indicators and how to work with them. Read in the article: Why Indicators Are Necessary About Categories of Indicators in the ATAS Platform Bid x Ask, Delta, Volume Clusters, Profiles Commitments […]
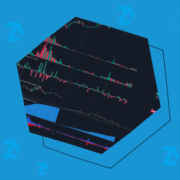
The subject of our today’s article is the CCI indicator. This article is another one in the series of publications about technical indicators. What is interesting about the CCI indicator? Read in this article: what CCI is, definition and calculation formula; how to trade using the CCI indicator – examples and testing using historical data; […]