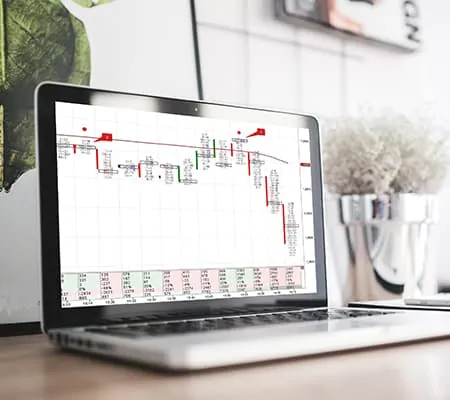
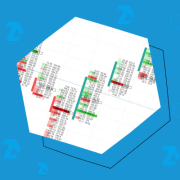
CLUSTER CHART (FOOTPRINT) ANATOMY

It had been impossible to imagine how a today’s cluster chart would look like before electronic trades were introduced, since exchanges and data suppliers had not provided all the required data. Today, online trading provides a completely new advanced flow of data from the exchange. Developers of trading platforms have got wide possibilities for creating […]

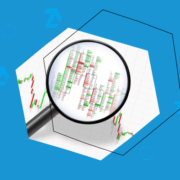
Как прибыльно, торговать используя графики Footprint?

How to trade profitably using Footprint charts

Footprint charts appeared about 20 years ago, however, there’s still little information on this trading subject on the Internet. And there are no printed books at all, although Footprint is an efficient and modern instrument. ATAS has 25 variants of cluster charts. They show the number of bids and asks, number of seconds and trades […]

Паттерны футпринта

How Footprint charts work. Footprint modes

Traders used to apply only the fundamental and technical analysis in the 20th century. They didn’t see what took place inside the candles. The cluster analysis or Footprint emerged in the 2000s. In this article for beginners we will analyze: what the Footprint is; how the Footprint works; how it can help to achieve a […]

Imbalance - what is it?

Imbalance – what is it? How to find and trade imbalance.

Imbalance is absence of balance between buy and sell orders. It is a specific term, which is used in trading only. In everyday life non-correspondence or inequality is called disbalance. For example: improper automobile wheels balance is a disbalance, which results in their non-uniform wear; receipts are less than expenditures – it is a budget […]