What you should know about NASDAQ Exchange
In this article, we will continue the subject of stock exchanges for ATAS beginners and will speak about NASDAQ. Nasdaq is the second largest stock exchange in the world by capitalization, however, it takes the first place by a number of companies. In this article, we provide the very necessary information, which anyone who wants to know about the Nasdaq stock exchange should know.
Read in this article:
- what the Nasdaq exchange is like;
- what the Nasdaq Index is;
- what is traded on the exchange;
- operating hours;
- price quotes.
We’ll start a bit from afar.
History of the Nasdaq stock exchange
The history of Nasdaq started in 1971 when the National Association of Security Dealers (NASD) registered the Nasdaq (National Association of Securities Dealers Automated Quotations) computer system.
At the beginning, it really was just an electronic quotation board and it wasn’t possible to trade through it. However, open quotes reduced the exchange spread and it was very convenient for investors. Besides, the trading volumes could be seen in the electronic system.
That is why, the trading function was soon realized and Nasdaq became a full-fledged exchange. In 1981, ten years after its creation, 37% of the American securities, which was 21 billion of stocks, were traded on Nasdaq.
The Nasdaq exchange is considered to be the most highly technological one. It implemented advanced innovations from the very beginning. For example, many traders in the 1980s executed trades by phone, calling their brokers. But in 1987, during the exchange crisis, brokers just didn’t answer the phone calls. To solve this problem, Nasdaq was transformed into a completely electronic trading system. Moreover, the market makers, who supported liquidity, emerged.
Nasdaq today
Today, securities of more than 4,000 companies are quoted on Nasdaq. The exchange divides companies into:
- blue chips (stable major companies);
- the others.
Requirements to the ‘good companies’ are very strict – profitability, capitalization, etc. However, small companies, which do not need much money, could carry out Initial Public Offerings (IPO) under a simplified procedure since 2015.
What stocks are traded on Nasdaq?
Initially, little-known companies received their capital on Nasdaq. Derivative trading was also actively developed there. In the course of time the situation changed and namely the companies with the biggest capitalization are traded on Nasdaq:
- AAPL. Apple carried out IPO on Nasdaq in 1980.
- GOOG. Google stock is also traded here.
- AMZN. The Amazon stock prices have grown on Nasdaq 100 times during 20 years of its stock trading.
Also, the world leaders, such as Microsoft, Facebook, Intel, Cisco, Adobe, Netflix, Comcast, Nvidia and Paypal, are traded on Nasdaq.
97 initial public offerings (IPO) were carried out on the Nasdaq stock exchange in the first half of 2019. It could be that some of these stocks would bring the world a new richest man on earth as it happened with Jeff Bezos, the AMZN owner.
Operating hours
The exchange works from Monday until Friday from 09:30 until 16:00 local time.
For those who trade from Russia, the operating hours start from 17:00 and end at 00:00 (Moscow Time).
There is also an after-trading session, which lasts for 4 hours after closing a regular session.
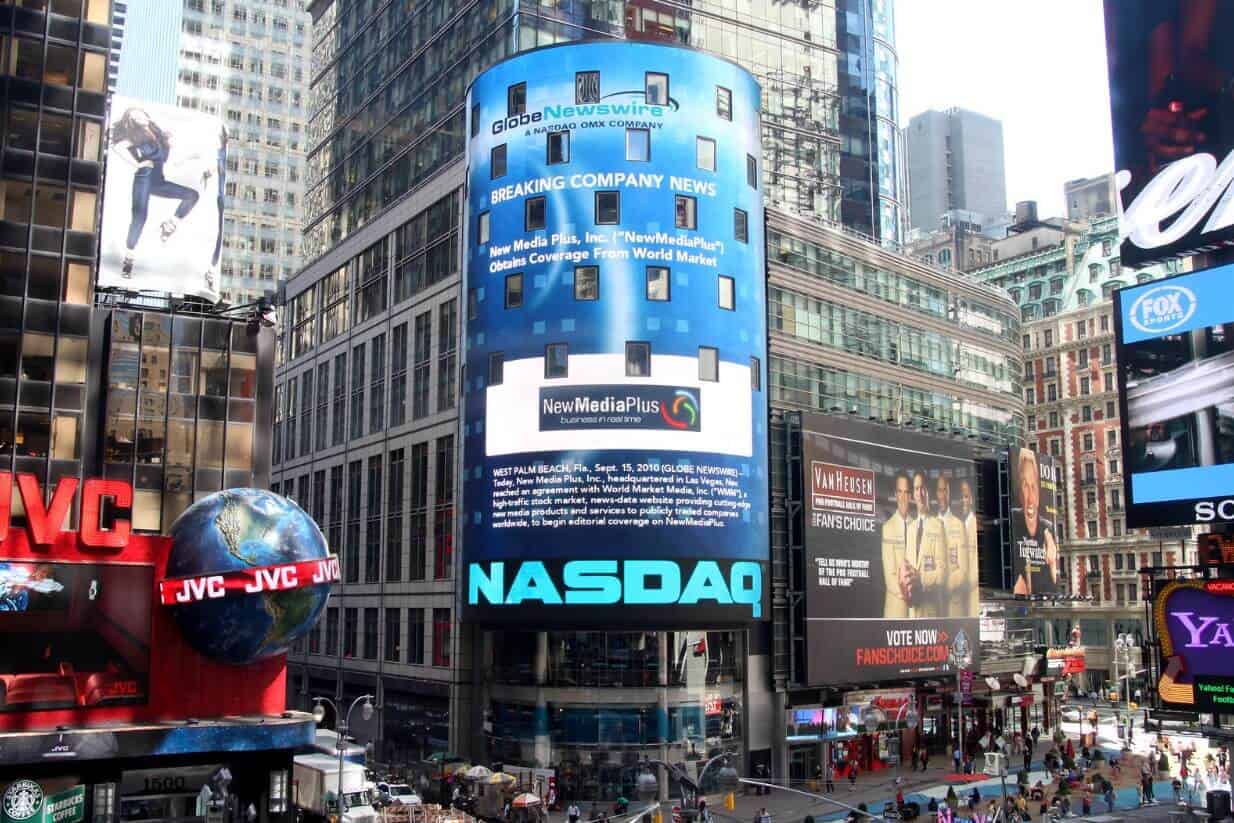
The exchange doesn’t have the ‘offline platform’ and trading hall as NYSE does. All NASDAQ trades are carried out in the electronic form. If you saw a picture of a building with a huge NASDAQ signboard, it is the NASDAQ MarketSite – an interactive panel and television studio of the NASDAQ exchange. It is located on the first floors of the Conde Nast Building on Times Square in New York.
Indices
The main index (Nasdaq Composite) was introduced together with the stock market in 1971. This index includes all common stocks, which are traded on the exchange. However, the main investment products are created on the basis of another stock index – Nasdaq-100.
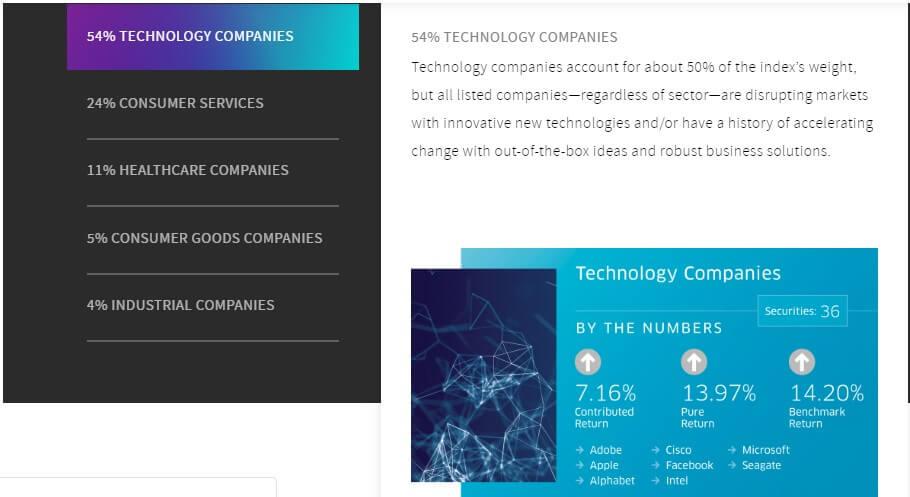
It appeared in 1985 and includes 100 nonfinancial companies. As of now, the Nasdaq-100 Index includes 100 largest (by capitalization) American and international nonfinancial companies. Technology companies, such as Adobe, Cisco, Facebook and others, take more than a half of the Index.
24% of the Index are taken by the companies from the consumer sector. They deal with the hotel and restaurant business, trading and also render tourist services. For example, these are Starbucks, Amazon, Costco and others.
11% of the Index falls on innovation medical companies.
The Nasdaq Index is very volatile, which allows intraday traders to make money.
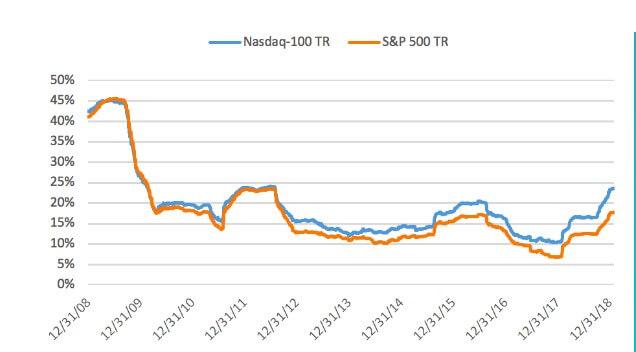
The total profitability of Nasdaq-100 exceeded profitability of the S&P 500 Index more than 2 times during the period from December 31, 2007, until June 28, 2019.
Investors may select out of more than 490 financial products created on the basis of this Index – ETF (Exchange-Traded Fund), futures and options contracts, annuities, etc.
You can find more information about the Nasdaq exchange index in our article about stock indices.
Quotations
There are three levels of quotations on the exchange:
- the first level shows the buy and sell prices, which all users may see;
- the second level is for dealers, who can see public quotations of market makers;
- the third level is for market makers only.
Trades are executed practically immediately and trading requires only the electronic connection, which could be set after you open a brokerage account.
What could be bought on Nasdaq?
You can buy securities, ETF, bonds and derivative financial instruments on commodities, currency pairs and even cryptocurrency.
Not only American securities are available here. For example, Russian investors could find Yandex quotations on Nasdaq.
Software for trading on the NASDAQ exchange
Try the trading and analytical ATAS platform for trading on the Nasdaq exchange.
ATAS contains the most advanced instruments of the cluster and technical analysis, which will help you to select the best time for opening and closing trades.
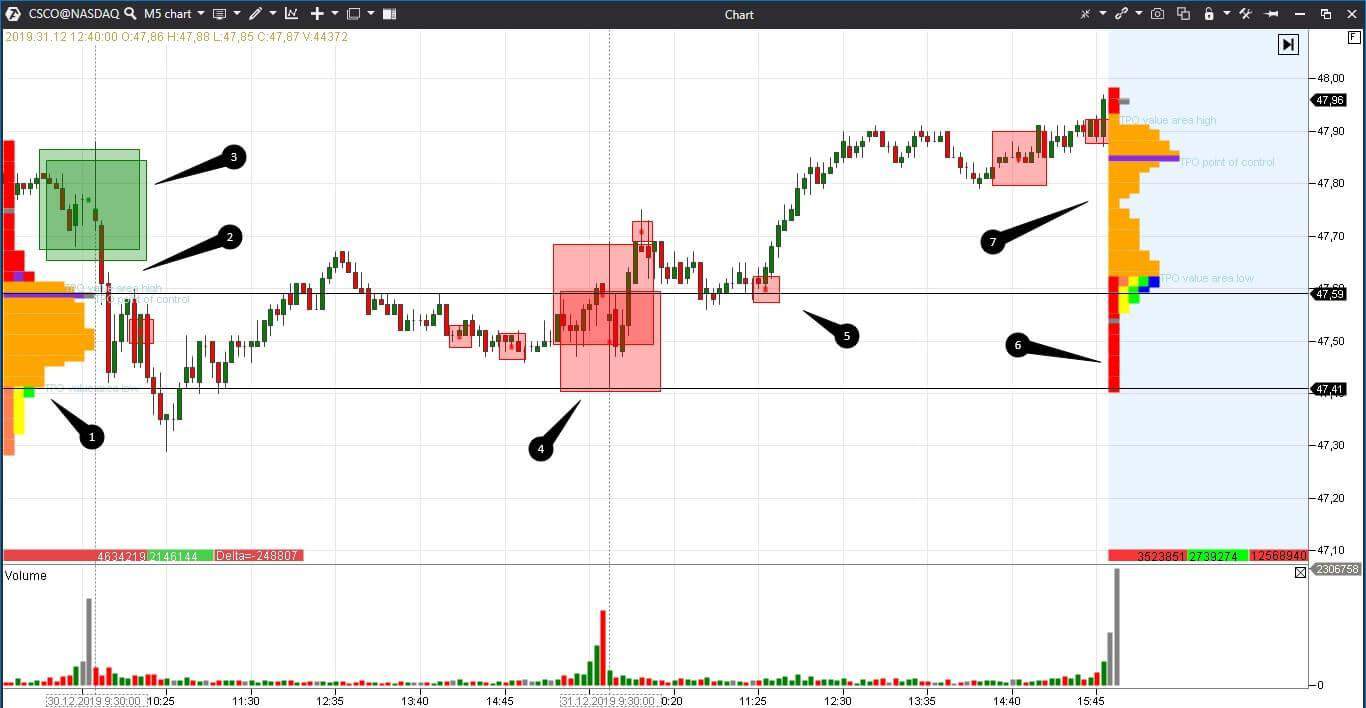
Example. Let’s consider an example of a Cisco stock 5-minute chart.
We added two fixed market profiles in the form of TPO to the chart. The left profile shows the previous day, while the right one shows the current day, however, in our case, these are the day before yesterday and yesterday trading sessions respectively.
We selected TPO because it displays single prints (red bands) more clearly. Single prints often become the support and resistance areas. When (and if) the price tests these areas, traders receive the second chance for entering into or exiting from a trade.
We also added the Volume and Big trades indicators. The data arrive from the Smart Tape in Big trades. Smart Tape is a very powerful instrument but there are very many trades displayed on it, that is why it is sometimes difficult to allocate important moments. And the indicator highlights big market sells and buys with red and green squares directly in the chart. Thus, a trader can analyze the situation faster.
What we see in the chart:
- We marked the Value Area High (VAH) and Value Area Low (VAL) of the previous day with numbers 1 and 2. It is highly probable that the price would slow down and reverse here. VAL and VAH also often become the support and resistance levels. Moreover, if a trading session opens above the previous day’s Value Area High, it is a bullish sign. If it opens below the previous day’s Value Area Low, it is a bearish sign.
- We marked major buys and sells with numbers 3 and 4. Not these areas by themselves but the price and volume movements after them are important for traders. In other words, the market reaction to big buys and sells is important. If big orders are not able to move the price in their direction, perhaps, it would go against them.
- Number 6 marks the single print of the most recent trading session. This is also the support/resistance level for traders. It is of interest that it was formed on the opening of the trading session, when sellers tried to push the price but failed. Despite their activity, the price failed to break the previous day’s Value Area Low. Big market sells, which are not able to move the price down, show up the presence of the ‘managed money’. The managed money stands up against market sells and buys with limit orders.
- We marked the test of the Value Area High with number 5. It is a chance to buy stock.
- The trading session, which is marked with number 7, looks like a double distribution by the form of profile. The maximum volume level is located in the upper part and tests the previous single print. The bell-shaped profile shows the price balance areas. Trend movement starts from such areas. Outstretched profiles show a focused price movement. Balance areas and trend movements interchange.
Conclusions
Liquidity and volatility of financial instruments are important for intraday traders.
The Nasdaq exchange and ATAS will provide you with a possibility to select ‘the stock in the game’ or volatile futures and execute trades with a good risk-reward ratio. The modern cluster analysis and big selection of securities and derivatives on the Nasdaq exchange open excellent opportunities for making a profit.
Try to start with ATAS.

