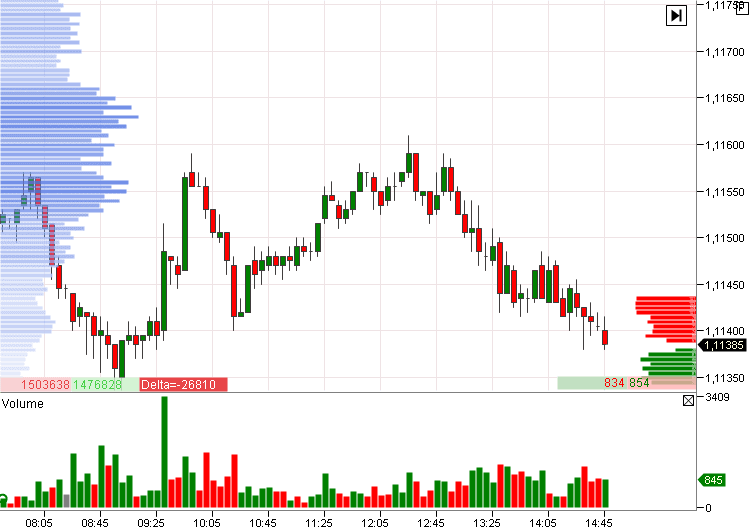
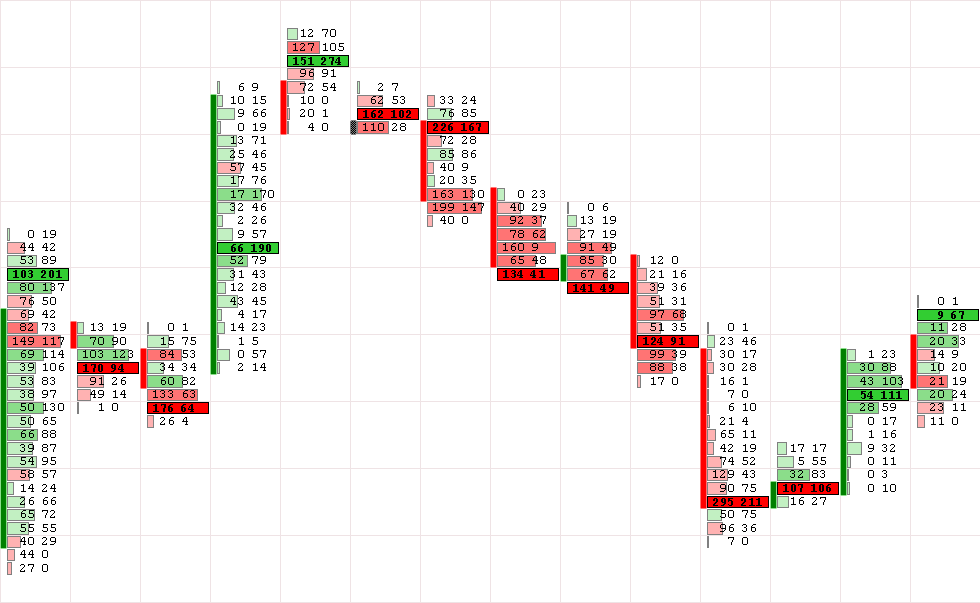
STRUCTURE OF THE CLUSTER CHART

It had been impossible to imagine how a today’s cluster chart would look like before electronic trades were introduced, since exchanges and data suppliers had not provided all the required data. Today, online trading provides a completely new advanced flow of data from the exchange. Developers of trading platforms have got wide possibilities for creating new types of presentation of exchange information for better understanding and easy interpretation of everything that takes place in the financial markets. A footprint of a cluster chart is an improvement in presentation of the trading information.
Another similar innovation is an order book (Smart DOM), which many traders use today. It drastically changed the trading process. A footprint, in its turn, provides the same level of understanding of the price but in the form of a chart interface.