Tag Archive for: Technical analysis

The Shooting Star pattern

What Is the Shooting Star Pattern: How to Using?

The Shooting Star pattern in candlestick analysis is a candle with a small body and a long upper shadow. Traditionally, a well-formed Shooting Star appears after a strong uptrend. The pattern should be seen as a signal that the trend may be reversing from bullish to bearish. It indicates a weakening of buying pressure and […]

Trading bull traps for beginners

Bull Trap in Trading. What It Is, How to Avoid It, and Profit From It

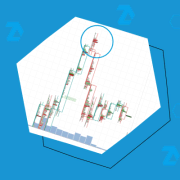
A bull trap is a market scenario with a deceptive price increase. Traders start buying the asset, expecting the uptrend to continue, but the price soon reverses and begins to fall. As a result, those caught in the trap end up closing their positions at a loss. Bull traps are common across all markets and […]

How-to-trade-level-breakouts-without-risks

How to trade level breakouts without risks

Level breakouts are a widely recognized concept in technical analysis, and even beginner traders are familiar with it. However, in practice, this strategy does not always work correctly: there is a risk of buying highs and selling lows, as many level breakout signals are false. In this practical article, we will try to give traders […]

Parallel channels in trading

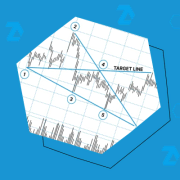
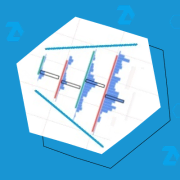
Parallel channels are an underrated pattern of technical analysis. When used with instruments for analyzing exchange volumes, parallel channels can become the basis for developing an effective trading strategy. Read more: What parallel channels are Why they work. Examples on history Advantages and disadvantages How to improve parallel channel trading with ATAS Tips for beginner […]

Магия 50%.

Why the 50% level works: hypotheses and examples

50% level is a simple technique that can be used by any beginner trader. At the same time, it is very effective – the professionals’ experience can confirm this.  By using 50% levels, traders can find entry and exit points to improve the accuracy of trading decisions and reduce risks. In this article, we have […]

Bar-by-bar analysis. How to read a chart. Part 2.

Bar-by-bar analysis. How to read a chart. Part 2

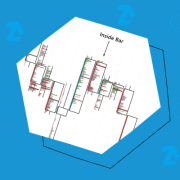
In the first article of the series, we introduced you to bar-by-bar analysis and also discussed how to use it in the bitcoin market. In this article, we will continue to study the topic using examples of other markets: Reading the futures market for the S&P-500 index using bar-by-bar analysis; Bar-by-bar analysis of the gold […]

Bar-by-bar analysis. How to read a chart. Part 1

Bar-by-bar analysis. How to read a chart. Part 1

Bar-by-bar analysis is a term that came from price action. A great contribution to the popularization of bar-by-bar analysis was made by Al Brooks, a private trader and author of several books describing the technique of reading charts by bars. Bar-by-bar analysis has important meaning. It aims at a deep understanding of the market situation […]

Как и зачем проводить тестирование в трейдинге

What does a test mean in trading?

In the articles of technical analysts for the forex market, you can find conclusions about some test like: “On Friday, the price fell and tested the 200-hour moving average” What does it mean? Read in the article: What a test means in trading. Example 1. Tests in VSA. Example 2. Tests on Mondays. Example 3. […]

Истощение давления продаж или покупок в трейдинге

Exhaustion of buying or selling pressure