Technical Analysis


Bear Trap in Trading

What Is a Bear Trap and How to Use It in Trading?

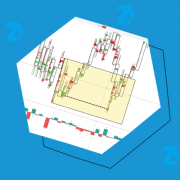
A bear trap is a market situation that can mislead inattentive traders. It consists of two movements: First, the asset price falls, creating the illusion of the beginning of a downtrend. Traders anticipating further decline rush to sell the asset, becoming bears. However, shortly after, the price begins to rise. This usually happens very rapidly, […]

Harami pattern

Bullish and Bearish harami pattern: How to Identify on the Chart and Use in Trading

The bullish harami and bearish harami are reversal patterns in technical analysis, made up of two Japanese candlesticks:    ✓   the bullish harami suggests that the trend will shift to an upward movement;    ✓   the bearish harami indicates that prices may move downward. In this article, we will examine how effectively classic candlestick patterns […]

Inverted Cup and Handle

The Cup and Handle Pattern: Meaning and Ways of Application

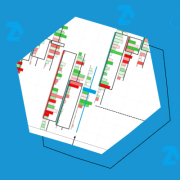
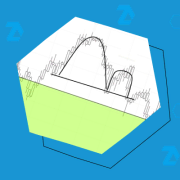
The inverted cup and handle is a bearish chart pattern that signals a potential price drop once it is completed. At first glance, this basic pattern may not seem particularly interesting to traders practicing regularly. However, analyzing it through cluster charts offers deeper insights into the reasons behind the bearish price movement. Specifically, it highlights […]

Indicators of Support and Resistance Levels

TOP-10 Support and Resistance Indicators

Support and resistance level is not just a basic trading concept — it is a powerful tool used by professionals. These levels play a crucial role in predicting price behavior in the market, offering profit opportunities. How can you find strong support and resistance levels? In this article, we will discuss 10 indicators that can […]

Piercing Line Candlestick Pattern

Piercing Line Pattern: How to Trade with the Piercing Line Trading

The Piercing Line is a two-candle reversal pattern in candlestick analysis that typically appears at the end of a downtrend, indicating a possible shift toward an upward movement. The pattern is sometimes referred to as the Piercing pattern.  Trading the Piercing Line pattern involves making decisions against the prevailing trend, which carries higher risks. This article […]

FVG Trading

FVG Trading: what is Fair Value Gap, meaning, strategy

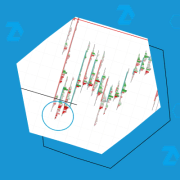
Fair Value Gaps (FVG) are impulse price movements caused by an imbalance between buyers and sellers.  This article provides a practical guide with examples of what a FVG is, how to identify it on a chart, and how to use this pattern in trading. You will also learn how to apply a strategy using the […]

Hammer Candlestick Pattern

Hammer Candlestick Pattern: What Is It and How to Use It

The hammer pattern in candlestick analysis is a candle with a narrow body and a long lower shadow. It is believed that a proper hammer appears after a downtrend and indicates the end of selling pressure and the start of buying activity. In other words, it signals a trend reversal from downward to upward. However, […]

How to profitably trade on Wolf Waves

Wolfe Wave Pattern: How to profitably trade on “Wolf Waves”

Wolfe Waves are a trading pattern developed by Bill Wolfe. This article provides a comprehensive guide to trading using this chart pattern. Read more:  How Wolfe Waves Work Identifying Wolfe Waves on a Chart Wolfe Wave Indicator How to Trade Wolfe Waves: General Rules Examples on Charts Trend Trading Trading Trend Reversals What Is the […]

The Megaphone Pattern

Megaphone Pattern: The Best Chart for Trading

The megaphone pattern is a chart formation that looks like an expanding triangle. It appears on the charts of stocks, currency pairs, or other financial instruments, and is characterized by widening boundaries where the highs and lows move in opposite directions, forming a shape similar to a megaphone. Read more: Examples of the Megaphone Pattern […]

What Is an Inside Bar

Inside Bar Pattern: What Is and How to Trade It on Footprint Charts

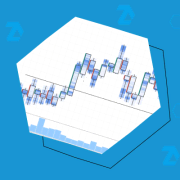
In trading, an inside bar is a pattern where a candle is fully contained within the range of the previous candle (bar). The high is lower than the previous bar’s high, and the low is higher than the previous bar’s low. Low of the previous bar < Low and High of the current bar < […]