
What Does Spinning Top Pattern Mean?
In Japanese candlestick analysis, the spinning top pattern is characterized by two main features: ✓ The candle has a small body. The opening and closing prices are close to each other, indicating minimal price change during the period. ✓ The candle has long shadows. The long upper and lower shadows show that both buyers and sellers tried to take control, but neither side succeeded in gaining a clear advantage. Analysts distinguish a few variations of this pattern: ✓ A white spinning top candlestick – a candle where the closing price is higher than the opening price. ✓ A black spinning top candlestick – a candle where the closing price is lower than the opening price. However, this does not mean that a spinning top white candle is a bullish pattern and a black one is bearish. Both types signal market indecision or a temporary balance between buyers and sellers. In simpler terms, the spinning top resembles the toy of the same name, which balances on a thin base (the small candle body), representing the balance between supply and demand, even though the edges of the toy are far from the center (the long shadows).Spinning Top Example
The screenshot below shows two examples of the spinning top pattern on the daily chart of Apple (AAPL) stock. While there may be more of these patterns on the chart (the exact number is difficult to determine due to the subjectivity of analysis), we will focus on examining these two specific examples.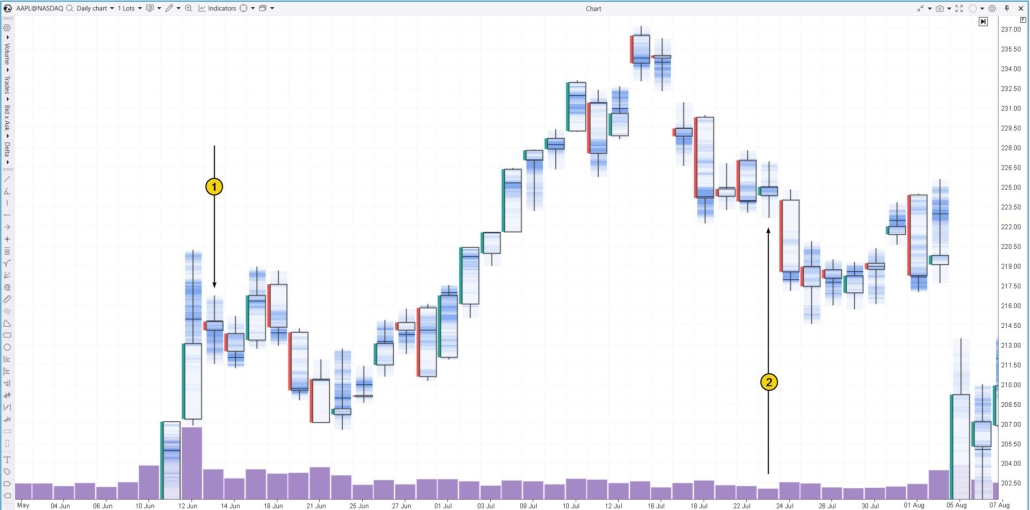
Meaning of Spinning Top Candle for Traders
The spinning top is considered a sign of market indecision. However, analyzing the context in which the pattern appears, along with studying the volumes, can provide valuable insights into what this indecision signifies. In the case of the black spinning top, the pattern emerged after the following events:- the price surged on June 11-12 following the presentation of Apple Intelligence;
- it is likely that on June 12, sellers became active, as indicated by bright clusters above the closing price.
Spinning Top Candlestick Pattern: How to Trade It?
The strategy for trading the spinning top candle is based on the idea that this pattern signals a temporary balance in the market during its current phase.- In a trending market, a spinning top may indicate that the current trend is weakening, making the market vulnerable to a correction or a pause within the trend. At the same time, a trend reversal is also possible.
- In a flat market, the appearance of a spinning top within a developing range signals market sluggishness, where supply and demand are balanced.
- The price was rising;
- Then it reached a resistance level;
- A spinning top formed on the chart.
How Effective is the Spinning Top Candle Pattern?
Thomas Bulkowski, a well-known expert on candlestick patterns, describes two types of spinning tops (based on the color/direction of the candle body): ✓ A white spinning top candlestick:- frequency: 2nd most common (very frequent);
- reversal probability: 50%;
- comment: if the price breaks out beyond the pattern, it rarely forms a significant trend.
- frequency: 1st place (very frequent);
- reversal probability: 51%;
- comment: a 51% reversal probability in practice confirms that the pattern is theoretically interpreted as indecision.
Spinning Top Pattern and Footprint Trading
Since the spinning top indicates uncertainty or indecision in the market, using additional tools is not just helpful — it is essential. Footprint charts can offer crucial insights into the market dynamics behind the spinning top.Spinning Top Candles on the E-mini S&P 500 Futures Market
Let’s take a look at two spinning top candles on the daily chart of the E-mini S&P 500 futures: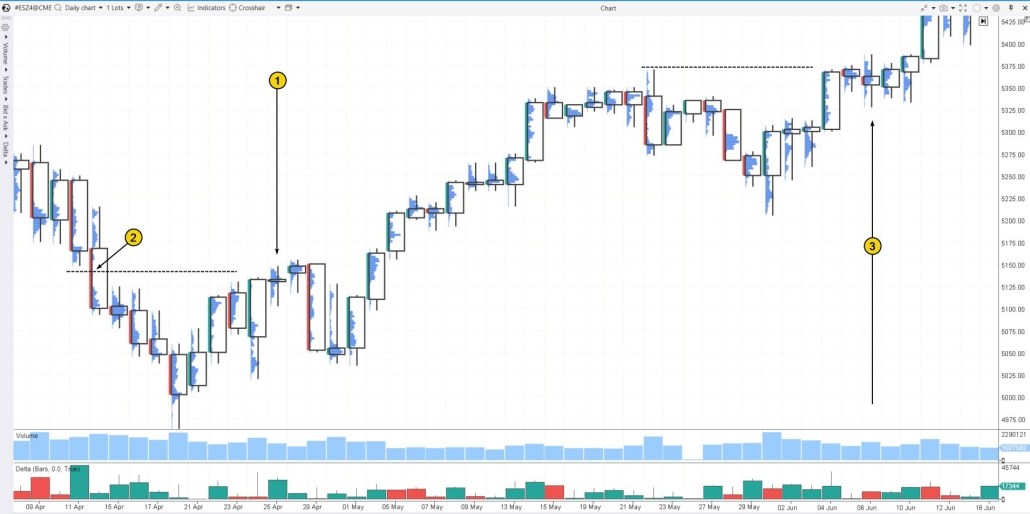
Spinning Top Pattern on a Cryptocurrency Chart
Let’s take a closer look at two spinning top candles on Litecoin’s (LTC/USDT) daily chart:
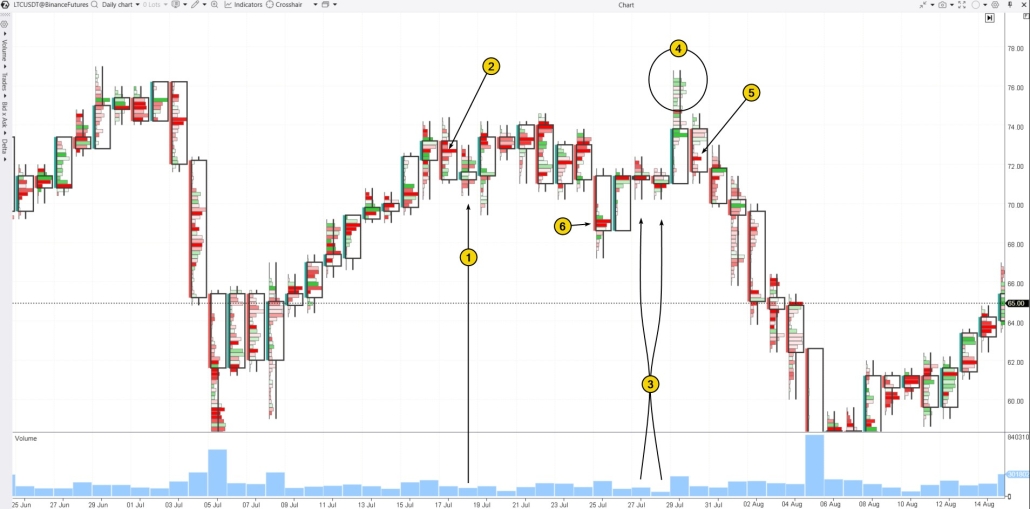
- the market saw a price increase of more than 20% from the July 5 low;
- on July 17, sellers stepped in, which can be seen in the bright red clusters (2) as the price approached the previous high near $77.
FAQ
What is a spinning top candle?
A spinning top candle is characterized by a small body and long wicks. The opening and closing prices are approximately in the middle of the candle. Typically, traders look for spinning tops on daily charts.What does a spinning top candle mean?
The appearance of a spinning top indicates that the market is in a state of uncertainty, reflecting an approximate balance of power between buyers and sellers.Is a spinning top candle bullish?
No, it is a neutral pattern and does not imply a buy signal, as has been previously stated: the pattern is interpreted as an equilibrium of forces between buyers and sellers.Spinning top reversal candle
A spinning top candle can suggest a potential trend reversal, particularly when it appears near key resistance after a price increase. Conversely, if a spinning top forms after a price drop towards a support level, it may indicate an upcoming upward reversal. However, to validate this reversal, it is highly advisable to conduct further analysis using cluster charts to find solid confirmation.How to Profitably Trade the Spinning Top Pattern
To trade the Spinning Top pattern with more confidence, consider using professional volume analysis tools like: Here is a strategy you can follow for trading the spinning top pattern: ✓ Step 1. Identify the pattern on the daily candle. ✓ Step 2. Switch to an intraday footprint to find support and resistance levels where you can open positions. Here is an example of implementing this strategy on a gold price chart: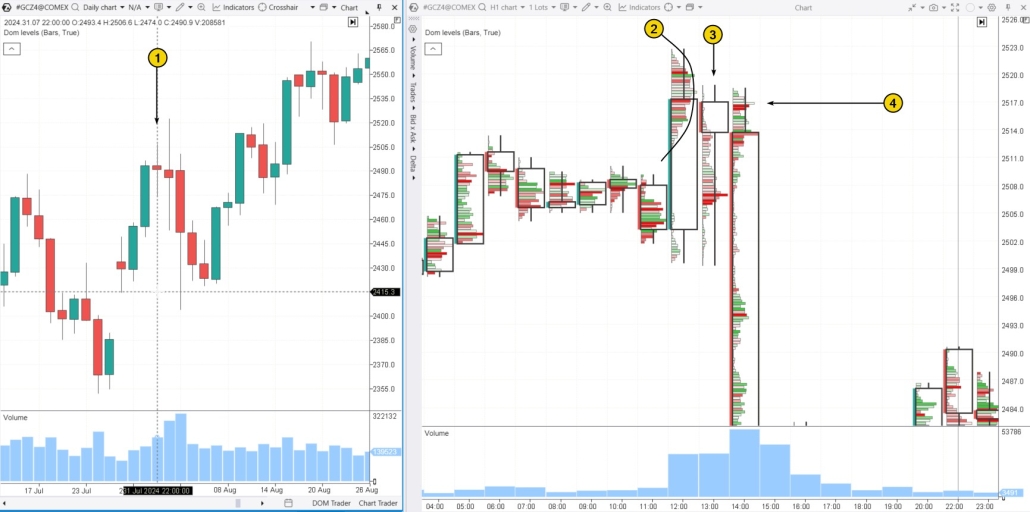
- A bulge (2) forms above the previous day’s high (which represents the spinning top), indicating a temporary balance between buyers and sellers.
- The price drops below this bulge (3), suggesting that the initial positive reaction to the news released at noon was mistaken.
- Based on the above observations, you open a short position at the test of the bulge (3).
How to Learn Pattern Trading?
To see how successful your pattern trading experience can be, try using the ATAS Market Replay feature. This tool on the ATAS platform uses historical data to recreate real-time trading conditions. It enables traders to sharpen their skills in a completely realistic environment without any financial risks. To try the simulator, download the ATAS platform for free, install, and launch it, and then: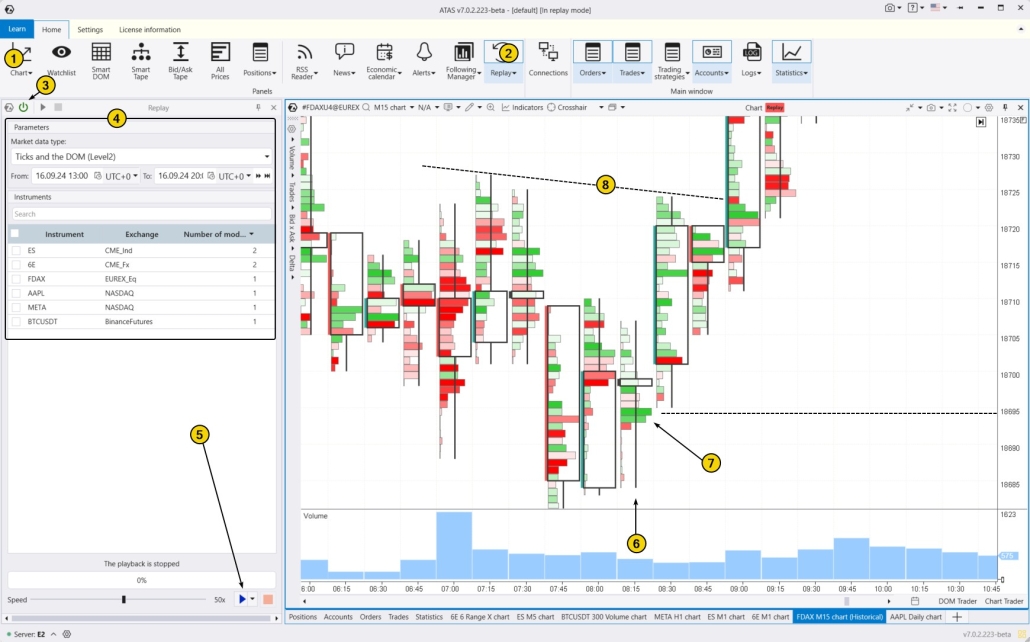
- at the low of the 08:30 candle during the test of the 18695 level;
- at the 08:45 candle as it pulls back from resistance (8);
- at the 09:00 candle upon breaking through resistance (8);
- At the 09:15 candle during the retest of the breakout of resistance (8).
Conclusions
While the name spinning top might suggest a market peak, this candlestick pattern does not indicate a top. The defining features of a spinning top are its long shadows above and below, with the opening and closing prices near the middle. These show that the market is in temporary balance, with neither buyers nor sellers taking control. At its core, the spinning top is not bullish, bearish, trend-following, or a reversal signal. It is considered a neutral pattern. Traders typically either wait for further developments or look for additional signals to make their decisions.Pros of the Spinning Top Pattern
✓ Frequency. According to Thomas Bulkowski’s rankings, the Black and White Spinning Top patterns are among the most common, occupying the top two spots. ✓ Interpretation. The pattern typically signals indecision and market balance, which often aligns with real market behavior.Cons of the Spinning Top Pattern
✘ Lack of clarity. On its own, the spinning top offers limited insight for making trading decisions, requiring additional confirmation from other tools. ✘ Subjectivity. Traders might find it challenging to assess the exact proportions of the candle’s shadows and body when identifying the pattern. ✘ There are no clear guidelines on placing stop-loss and take-profit orders. Placing stop-losses beyond the pattern’s extremes can conflict with risk management strategies, especially if the candles are large. While you read this article about trading with the spinning top pattern (or other Japanese candlestick patterns), you might realize that modern analytical tools provide more insights than traditional candlestick patterns. As a result, you may find it beneficial to shift your focus and use footprint charts and other volume analysis methods as your main sources of information, helping you make better-informed trading decisions. Download ATAS. It is free. Once you install the platform, you will automatically get the free START plan, which includes cryptocurrency trading and basic features. You can use this plan for as long as you like before deciding to upgrade to a more advanced plan for additional ATAS tools. You can also activate the Free Trial at any time, giving you 14 days of full access to all the platform’s features. This trial allows you to explore the benefits of higher-tier plans and make a well-informed purchasing decision. Do not miss the next article on our blog. Subscribe to our YouTube channel, follow us on Facebook, Instagram, Telegram or X, where we publish the latest ATAS news. Share life hacks and seek advice from other traders in the Telegram group @ATAS_Discussions.Information in this article cannot be perceived as a call for investing or buying/selling of any asset on the exchange. All situations, discussed in the article, are provided with the purpose of getting acquainted with the functionality and advantages of the ATAS platform.


