
Perhaps you have heard the opinion that the trading is complex and footprint is complicated, that financial markets are only for the sharks who have big capital and best trading algorithms. The truth is that if you concentrate on the task complexity only, you will hardly be able to solve it. Sometimes, a complex thing could be very interesting if you look at it at a different angle and here’s why.
Once upon a time, the One Stop Store was robbed in the British town Whitnash. Robbers took all the money and lottery tickets but the frightened store owner didn’t have to wait for the triumph of justice for a long time.
Unfortunate for the robbers, snow fell that night and their footprints brought the law enforcement officers directly to the robbers’ hideout. As a result, all six criminals were taken into custody.
Every day, in each market, the income ‘is stolen’ under the very nose of millions of retail traders. They suspect nothing and lose their trading deposits even without being aware what institutional traders do at the same time. We can assure you that their footprints will bring you directly to the profit.
In this article:
- What footprints the institutional players leave.
- Not just a footprint but a signature.
- The way to a stable success.
- Help in decision making.
- Take the profit before they run away.
What footprints the institutional players leave
If it seemed to you even for a second that you would have managed to cover up your tracks completely, think again and imagine that you are a criminal who leaves the crime scene. Note that the modern technologies, which are used by the law enforcement bodies for detecting and identifying footprints, are just unbelievable.
The same is true about the modern markets. While millions of retail traders closely observe the bars or Japanese candles and rely on unreliable signals of lagging indicators, institutional players grab the profit and drive away on the stolen car, which is called the market.
But their secret hope to stay unnoticed evaporates, since any position they take and any intention they have are now accessible for your analysis in real time. This information is provided in the form of a market footprint in the trading and analytical ATAS platform.
Not just a footprint but a signature
Just imagine that you are an investigator and you found an evidence which completely proves the guilt of the criminal, who signs an admission of guilt with the date of the crime and place where he could be found.
Whether they like it or not, but institutional players leave this information one second after they took a position in the market. The more aggressive their position, the more information you would have for analysis. Pieces of evidence, which could be found in each footprint chart of the ATAS platform, will bring you to profitable trades.
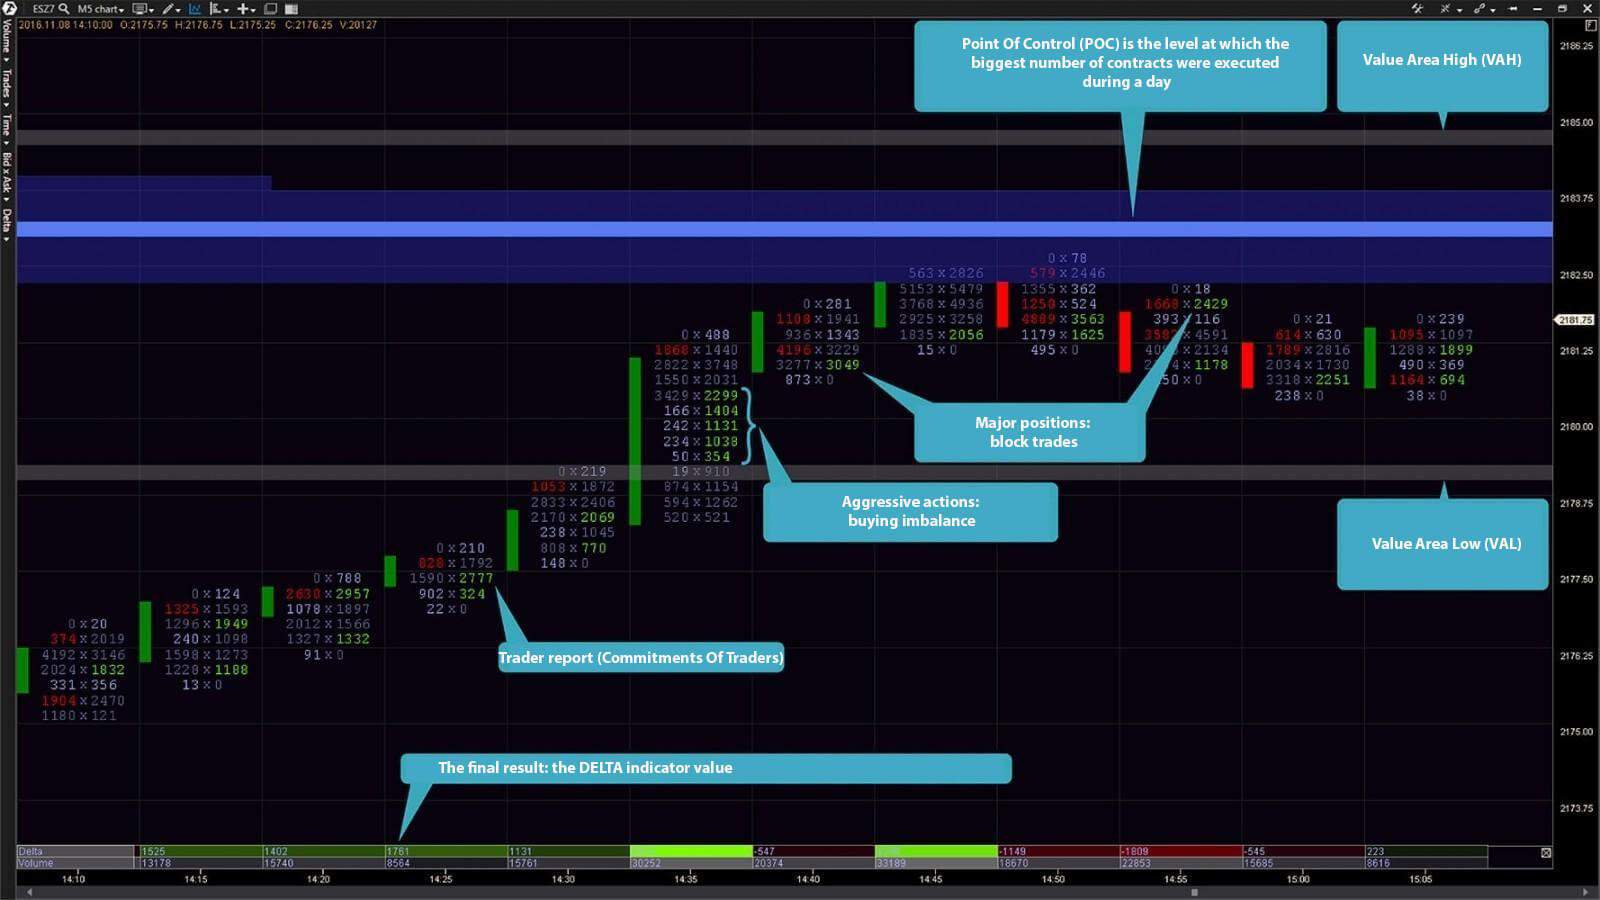
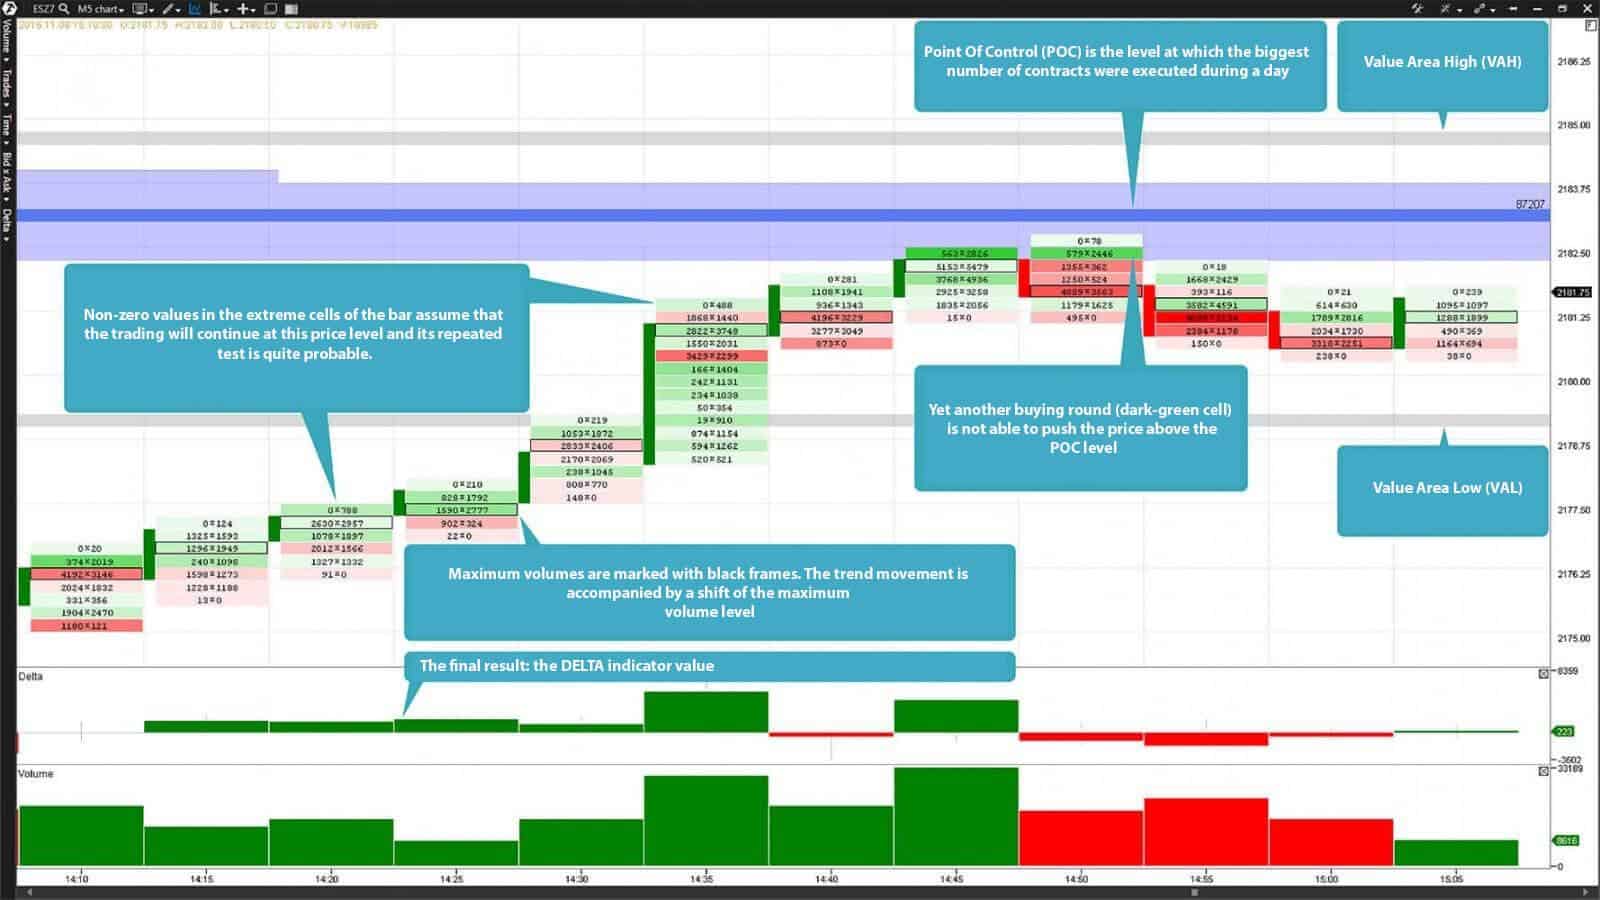
As you could see, even two variants of the footprint chart of the trading and analytical ATAS platform were sufficient to cast light on many useful details:
- Winners and losers: the final result is reflected in the form of the delta after closing each market auction (bar or candle) between the winning and losing party;
- Aggressive actions: the market positions taken by buyers or sellers with the aim to move the price in a certain direction;
- Favourable conditions: the moments when the asset cost becomes too cheap or too expensive creating favourable conditions for the reversal movement;
- Forced confrontation: the big positions, which include thousands of contracts, create the price levels (ranges), which would be tested by the price after some time;
- Conflict epicenter: the crime scene where the biggest part of the volume was traded.
The way to a stable success
Keystone policemen are constant characters of silent short films of the Keystone cinema company and are famous for their stupidity. They are also very spectacular and correspond with the classical image of a policeman. The same is true about millions of retail traders. Institutional traders fool retail traders while retail traders look into the charts with straight faces. They do not even realize that a lot of pieces of evidence are scattered around them.
The ATAS platform footprint chart will help you to identify:
- exact points of entry – places of executed trades by signals, which make you confident that you entered the market just before one or another price movement and not after it;
- closing signals – the signs of the price movement against you, when you would have to make a decision about closing your position based on aggressive movements, created by institutional players;
- dynamic stop losses – a possibility to move a stop loss following the market movement with the aim to protect the profit while actively managing the positions.
Even one half of this information will give you a huge advantage over 95% of the market retail traders – besides, it touches the upper layer only.
Help in decision making
At the beginning, the information in the footprint chart might seem overloaded and even complex, however, if you practice it regularly, you will learn to assess the current market situation quickly as an experienced investigator.
Analysis of the most recent information, which is contained in each bar, candle and market, will directly influence your trading decision making. You will be able to actively monitor the current market situation in real time instead of waiting for low-quality signals of lagging indicators as the majority of retail traders do.
This would allow you to find and control the places of execution of trades and manage the risk. These are the two most important elements which are constantly and successfully (and simultaneously) used by institutional traders in their trading.
Do not overload yourself with analysis. Study the footprint step by step, applying the received knowledge in practice, and use all the advantages it provides you with.
Take the profit before they run away
Investigations by the footprints left at the crime scenes are carried out all over the world. And despite all the efforts of criminals to cover up their tracks, professional investigations result in catching them up.
Before you execute a trade, monitor the process of formation of future powerful market movements by institutional traders. Watch how, just in front of your eyes, a fight of institutional traders develops in the ATAS platform footprint chart and trade on the side of the winner.
Follow the delta indicator values – the final result of every market auction. Follow the appearing imbalances, which demonstrate who’s got initiative. Use the Commitments Of Traders (COT) as a reference points for price ranges with the biggest concentration of the trading volume. You could additionally use the Point Of Control (POC) of the Market Profile indicator, which we discussed in this article, for identifying the maximum volume areas for any period of time.
Take your profit from the market using the reliable, advanced and efficient instrument of analysis, the footprint chart of the trading and analytical ATAS platform, while the other retail traders hopelessly wait for the lagging indicator signals and passively observe how the price rushes from them away.
We hope that the information in this article was of interest to you. We already published materials in our blog in which we considered the footprint subject. We recommend you to read the following articles if you want to study this subject further: Footprint, Learn to read the footprint: what every beginner should know and Anatomy of the cluster chart (footprint). Happy trading!


