Do you know what are the similarities between surfing and trading? Correct, there are four of them: spirit of freedom, waves of the roaring forces, serious risk and really tough professionals. Actually, there is the fifth one – there are sharks in both. In this article, we will tell you how not to allow market waves to ‘crush’ your trading deposit but to use them for making profit. We will look deeper than the price chart available for all retail traders and analyze the market volume profile (Market Profiles) indicator available in the ATAS platform. This article is more for beginner traders but it could also be useful for experienced ones since, after reading it, they might find a new place for exciting experience.
In this article:
- Why market waves ruin retail traders.
- Instrument which shows wave parameters.
- When to stay inside the market and when outside.
- Confidently stand on the wave.
“The Market Profile tries to bring the internal logic into the market context. It is the analysis method, which starts with understanding of the fact that the price in itself doesn’t bring information like words, which do not have any sense outside the context or syntax. However, the market volume is an integral part of its direct expression. Understanding of the volume will give you understanding of the market language”.
Robin Mesh, a recognized expert in using the Market Profile
The reef break in the picture to this article is called Banzai Pipeline and if you surf its waves, believed to be the most dangerous waves in the world, you can become either very popular or very dead. These really huge waves reach their peaks just above the reef, as sharp as a razor blade, only slightly covered by water.
You can rent a surfboard and go directly to the arms of death or, as a minimum, get several scratches or behave like a professional and plan everything beforehand. The plan of action is actually the same when you try to ‘catch’ big market waves. We want to assure you that not a single institutional trader will not even think about an effort to ‘catch’ a market wave without collecting as much information about it as possible.
You can independently conduct such an analysis with the help of the market volume profile (Market Profiles) indicator of the trading and analytical ATAS platform. It will show you whether there are any ‘undercurrents’ or ‘reefs’ in the market, which strengthen or weaken one or another trend.
Why market waves ruin retail traders
A guy named Butch Van Artsdalen was born in Norfolk, Virginia, but became famous at the other end of the world – in the deadly Pipeline. He did everything himself in an old-fashioned way swimming to the reef. He used to catch 25-feet (7.6 meters) waves all over the world in the 1960s and 1970s. You would have been able to feel confident just looking at this surfer.
A big number of retail traders also look that tough while their deposits are still safe. They executed several profitable trades or even made good money and they are sure that they already started to become future market legends. But in the end they will ‘ride’ such market waves, which, in the best case scenario, would bring them a series of losses, and, if they do not observe the trading capital management rules, would ‘crash’ their trading deposits.
It happens because they enter the market on reversals after powerful market movements. They are sure that they entered the market at an ideal moment. In fact, they do not have sufficient information about what drives the wave and how strong it is yet. This problem could be solved when you look at the market volume profile.
Instrument which shows wave parameters
If you have never surfed, not even mentioning the Pipeline, it would be useful for you to read the surfing news. Of course, you can jump into the water using your best guess or still select the exact time and place to catch the wave, which you can cope with.
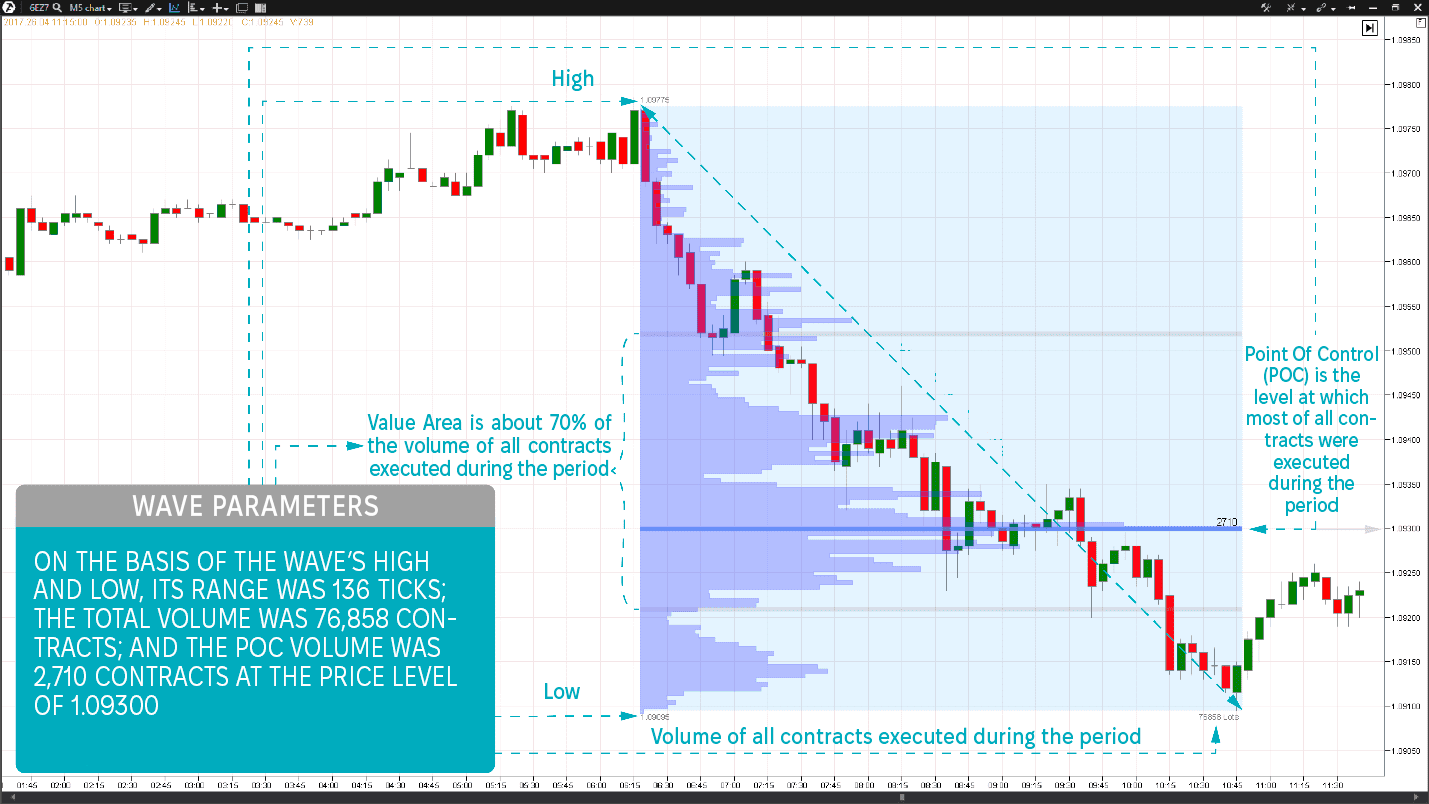
EUR futures. Never trade the market wave reversal without estimating its potential!
The same is true about trading. When you estimate a market wave you may use your best assumption or address reliable data. The Market Profiles indicator provides you with these data which are required for estimating the market wave potential. It will show you exactly those places where the volume passed and its amount and range for any selected period of time.
It is also important that it will show you the Value Area, inside which about 70% of all trades for a selected period are executed, the information which the majority of retail traders do not have access to. Moreover, there is a level inside this area, which is called the Point Of Control (POC). This is that price level in the volume profile analysis, at which the biggest number of contracts was executed. It is always marked with the longest line in the bar chart of the indicator and often with a colour. It is important to note that the Point Of Control is a dynamic value and may change its position in the process of the market wave formation.
Let’s add the market volume profile (Market Profiles) indicator to the chart (ticker: 6E). You get a possibility to quickly assess the potential of major market movements if you use this analytical instrument.
When to stay inside the market and when outside
They say that the best time for surfing in the Pipeline is December. Surfing competitions take place in December and try to guess what is recommended to the audience. You are right – to read surfing news. The news report where and when competitions are carried out so that the audience could see pros in action.
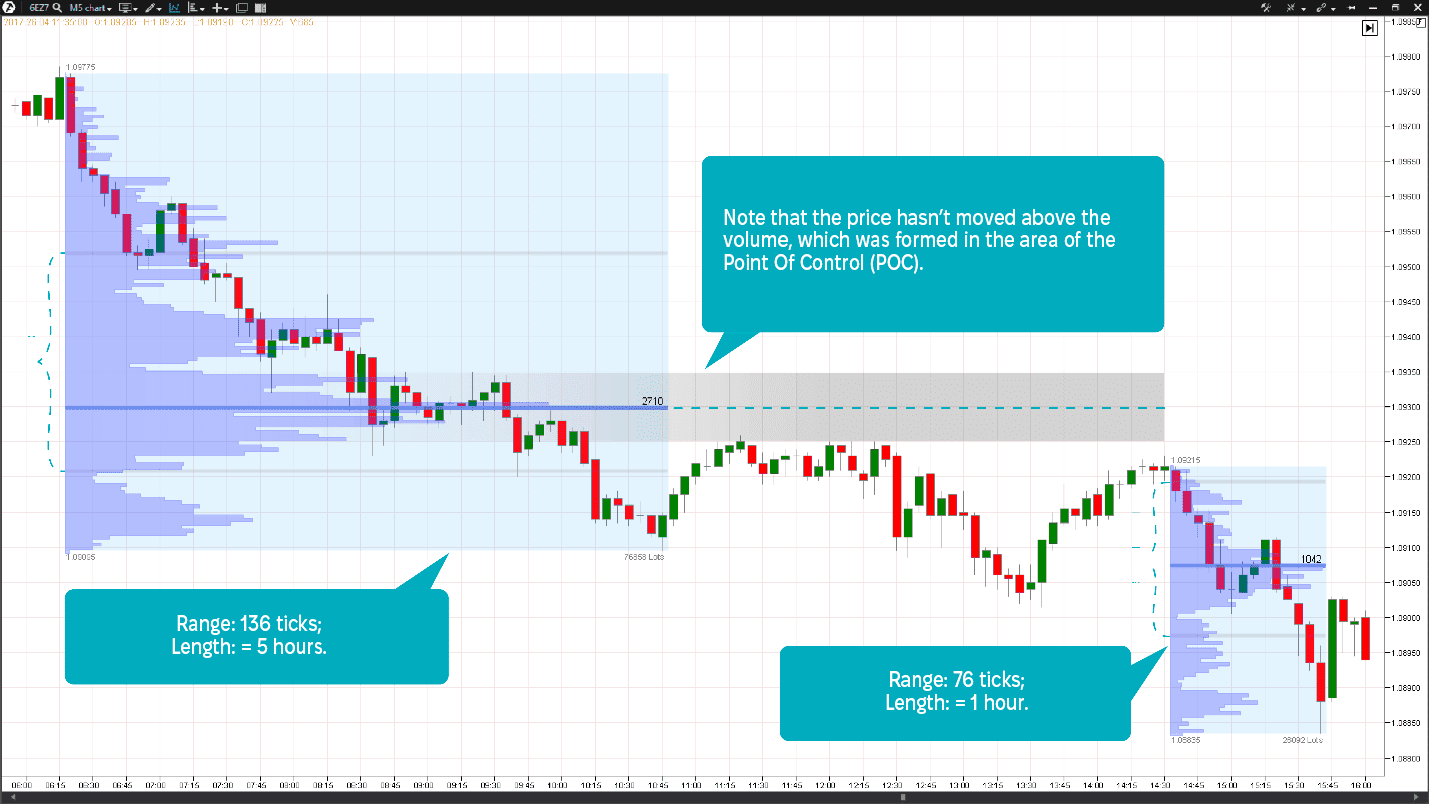
EUR futures. The price meets resistance in the area of the maximum volume of the first wave.
When you look at the accumulated volume of the market wave, you actually see actions of institutional players. Everything is simple here. The guys who traded 90% of the market volume identify the Value Area and how wide the price range would be. You shouldn’t put your trading deposit at risk standing against the powerful movement, at least, without estimating its potential first.
We can see in the above chart that the movement of the first wave in question took about 5 hours from the moment of opening the European session, after which the market consolidation took place. Movement of the second wave in the same direction already took less than an hour and constituted a little bit more than half of the first wave movement range (76 ticks). It is more than half of ticks during a bit more than an hour. Besides, look at the Value Area. There is still the institutional player interest in it at a lower price level.
The traders who looked for reversal points in this situation and didn’t trade towards the trend would better stay outside the market and wait until the second wave would develop further, watching whether its movement starts dying out together with the major player interest.
Confidently stand on the wave
Many surfers met their fates in the Pipeline, including surfer professionals Jon Mozon and Malik Joyeux. Malik was famous for riding the multimeter waves putting his life at unbelievable risk.
Never run unjustified risks. Monitor and study waves in the market you trade with the help of the market volume profile. Just add this analytical instrument to your chart and move it in the respective direction from high to low of the downwave or from low to high of the upwave. You will get a comparative review of the market if you add this indicator to all further waves in the chart.
Watch the waves which Value Areas are closer to their middles and move together with the Points Of Control (POC) towards the trend with the increase of volumes and price range. It will be a signal that the trend gains momentum. Analyze reversal points with respect to reduction of volumes and decrease of the price ranges, which would serve as a signal of exhaustion of initiative of the market participants and dying out of the current trend.
We do not recommend you to blindly jump into the depths of the market but recommend to strictly assess those market waves which are within the field of your attention. Make profit using the advanced instruments of the trading and analytical ATAS platform and confidently stand on a surfboard of trading.
Do not miss the next article on our blog. Subscribe to our YouTube channel, follow us on Facebook, Instagram, Telegram or X, where we publish the latest ATAS news. Share life hacks and seek advice from other traders in the Telegram group @ATAS_Discussions.
Information in this article cannot be perceived as a call for investing or buying/selling of any asset on the exchange. All situations, discussed in the article, are provided with the purpose of getting acquainted with the functionality and advantages of the ATAS platform.