Footprint strategy on dax example
Dax is a German stock index, calculated on the basis of 30 stocks of the biggest and most liquid German companies. It is a very volatile instrument, which provides traders with wide trading opportunities. You may efficiently apply practically any of the footprint strategies, described in previous articles, in the Dax market. This index is rather liquid but major traders have to accumulate their positions by several prices due to a high volatility. Sharp and unexpected price fluctuations in a wide range are frequently observed in this market. A sharp growth of volatility is observed twice a day, since it is a European instrument. The first leap takes place when a European session is opened and the second one – in the beginning of an American session. The Dax index is good for intraday trading.
In this article:
- Key principles;
- Examples.
Key principles.
In the examples below we will concentrate on how to trade breakouts. Breakouts take place when the price leaves the consolidation zone. You may observe the majority of them when the price leaves the pattern of the trend continuation. The continuation pattern is nothing else than a pause in the current tendency. Triangles (ascending, descending and symmetrical), flags, pennants, wedges and rectangles are some of the most famous continuation patterns.
It is extremely important for a trader to understand how one or another pattern looks like and how to interpret it correctly with the help of the footprint. The cluster presentation of the exchange information would provide a trader with valuable information about how distribution of volumes developed inside these chart patterns.
There are also two other breakout types – the support/resistance area breakout and the trendline breakout. Breakouts should only be considered in case of appearance of a high volume. A comparatively low volume may testify to a false signal with high probability. Due to the colouring of footprint cells, it is very easy to identify visually which volume level accompanied the breakout and what the specific prices, which the highest volumes passed, are.
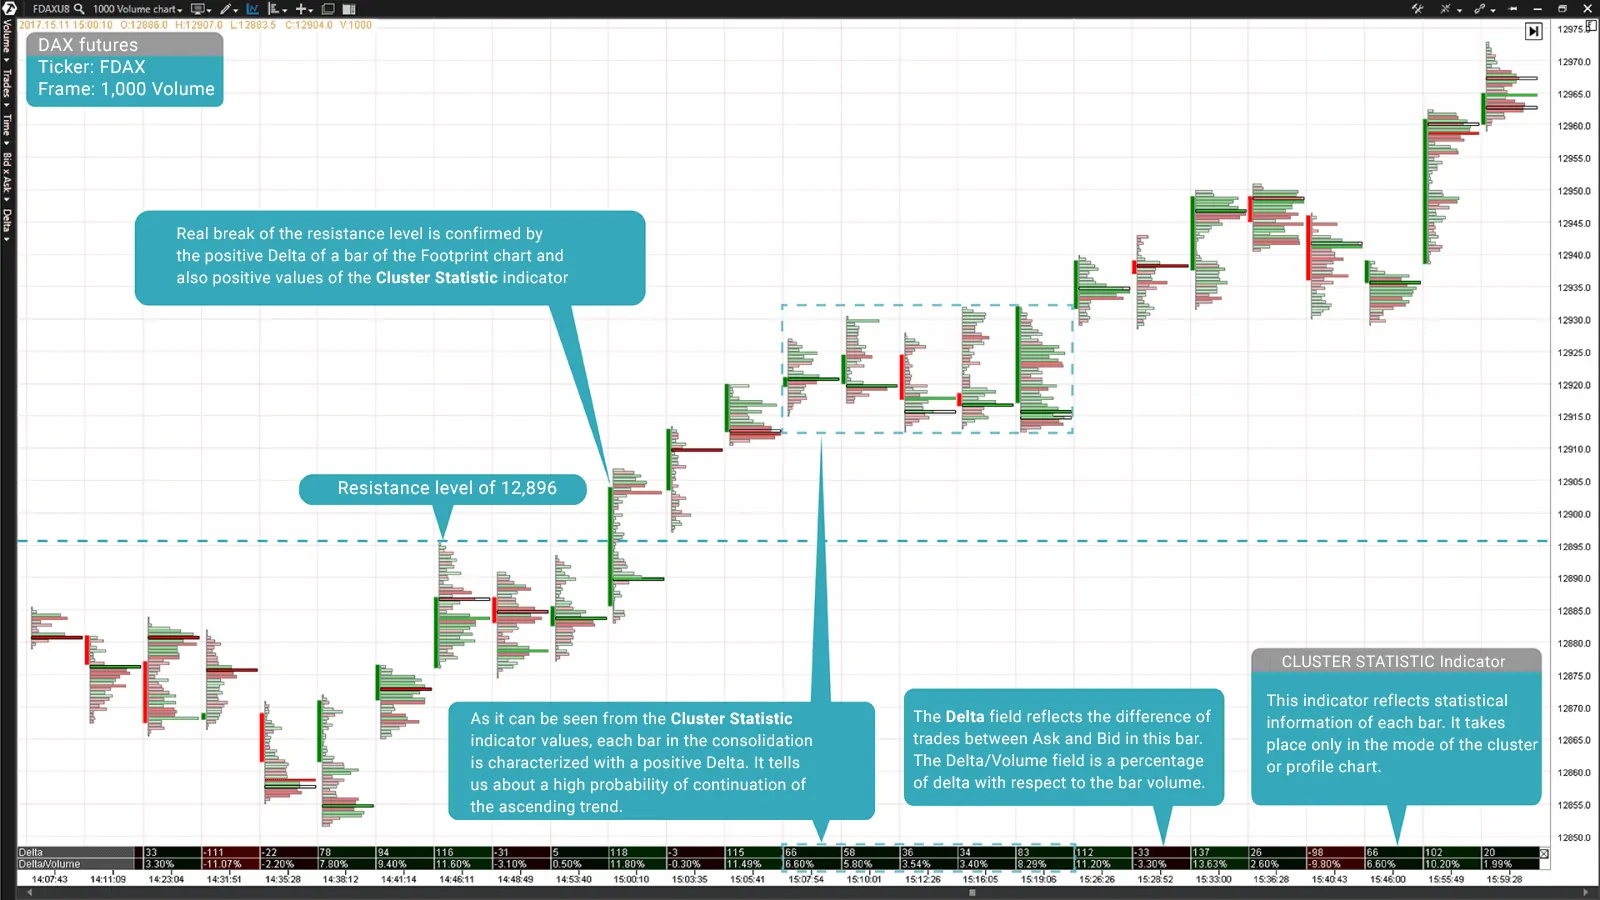
As you can see from the example in Chart 1, the Dax Index futures price had increased after the breakout of the resistance level of 12,896. There was a pause, during which the market started to consolidate, after that in the current tendency. The consolidation area in the chart is marked with a dashed line in the form of a rectangle. There was a small positive overweight of buyers in the market before the price left this consolidation. It is clearly seen from the Cluster Statistic indicator values, according to which each bar in this consolidation was characterized with a positive Delta.
Let’s note that, since the article subject is the trading on breakouts, the issue of building support and resistance levels are not considered here. It is assumed that they could be individual for each trader.
Chart 1. Footprint of a DAX Index futures (ticker: FDAX), built on the volume with the value of 1,000 contracts.
Thus, the Footprint chart helps to detect the quantity of the traded volume and the predominating side in the market before the breakout. This helps to better assess a probability of the genuineness of the breakout.
The Footprint profile chart is a convenient visual presentation of the exchange information. This analytical instrument allows conducting assessment of a probability of the breakout signal processing. The profile patterns allow seeing where high volumes took place in the market, while colour and intensity help to identify predominance of one or the other side of the market. All this information is refreshed in the ATAS platform in real time. This will help you to open trades in time.
As you can see in the above example, the bar deltas might point into the direction of a potential breakout during consolidation. It provides a possibility to enter the market beforehand expecting a breakout. However, you should monitor such trades attentively, since a breakout in the forecasted direction might not take place.
Examples.
Footprint also could help a trader to identify which side of the market predominates in the key area of the breakout – aggressive sellers or buyers. In order to understand the price potential better, one should study the market dynamics and structure, at least, during the current day. It is necessary to get an idea about whether the market was a trend or range one. This could help to identify the breakout probability and also to interpret information, presented by a cluster chart, better.
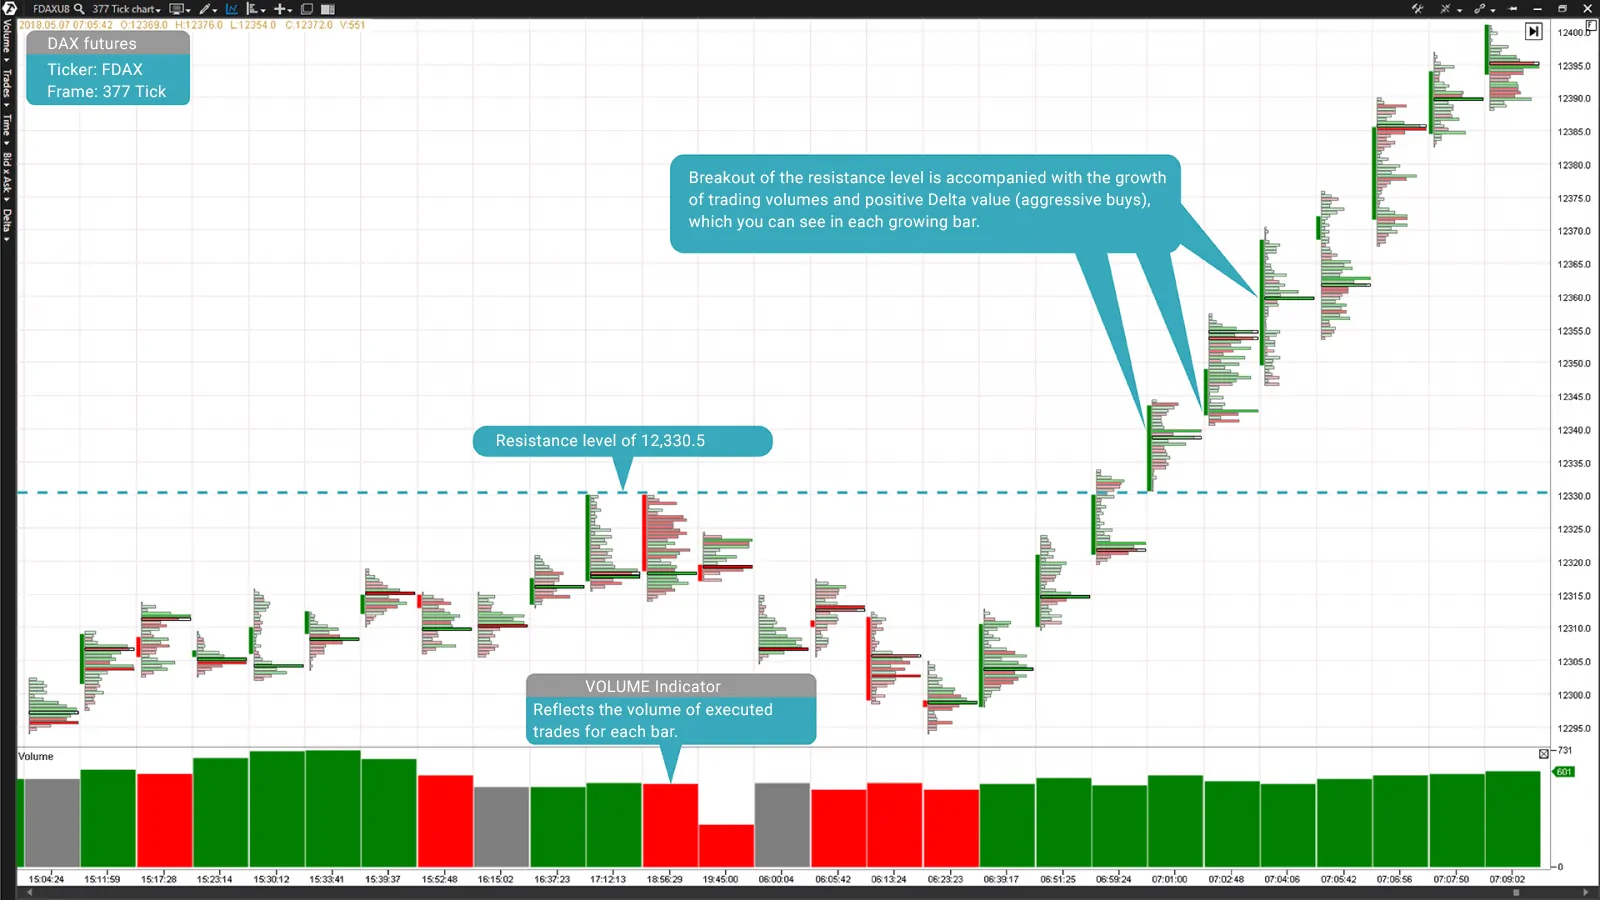
Chart 2 is an excellent example of the ascending Dax Index futures movement. Note how, according to the Volume indicator data, the high volume was preserved at the level of 12,330.5 during the breakout of the resistance level, while the Delta inside the bars was mostly green. All these parameters are signs of a real breakout of the level.
Chart 2. Footprint of a DAX Index futures (ticker: FDAX), built on ticks with the value of 377 contracts.
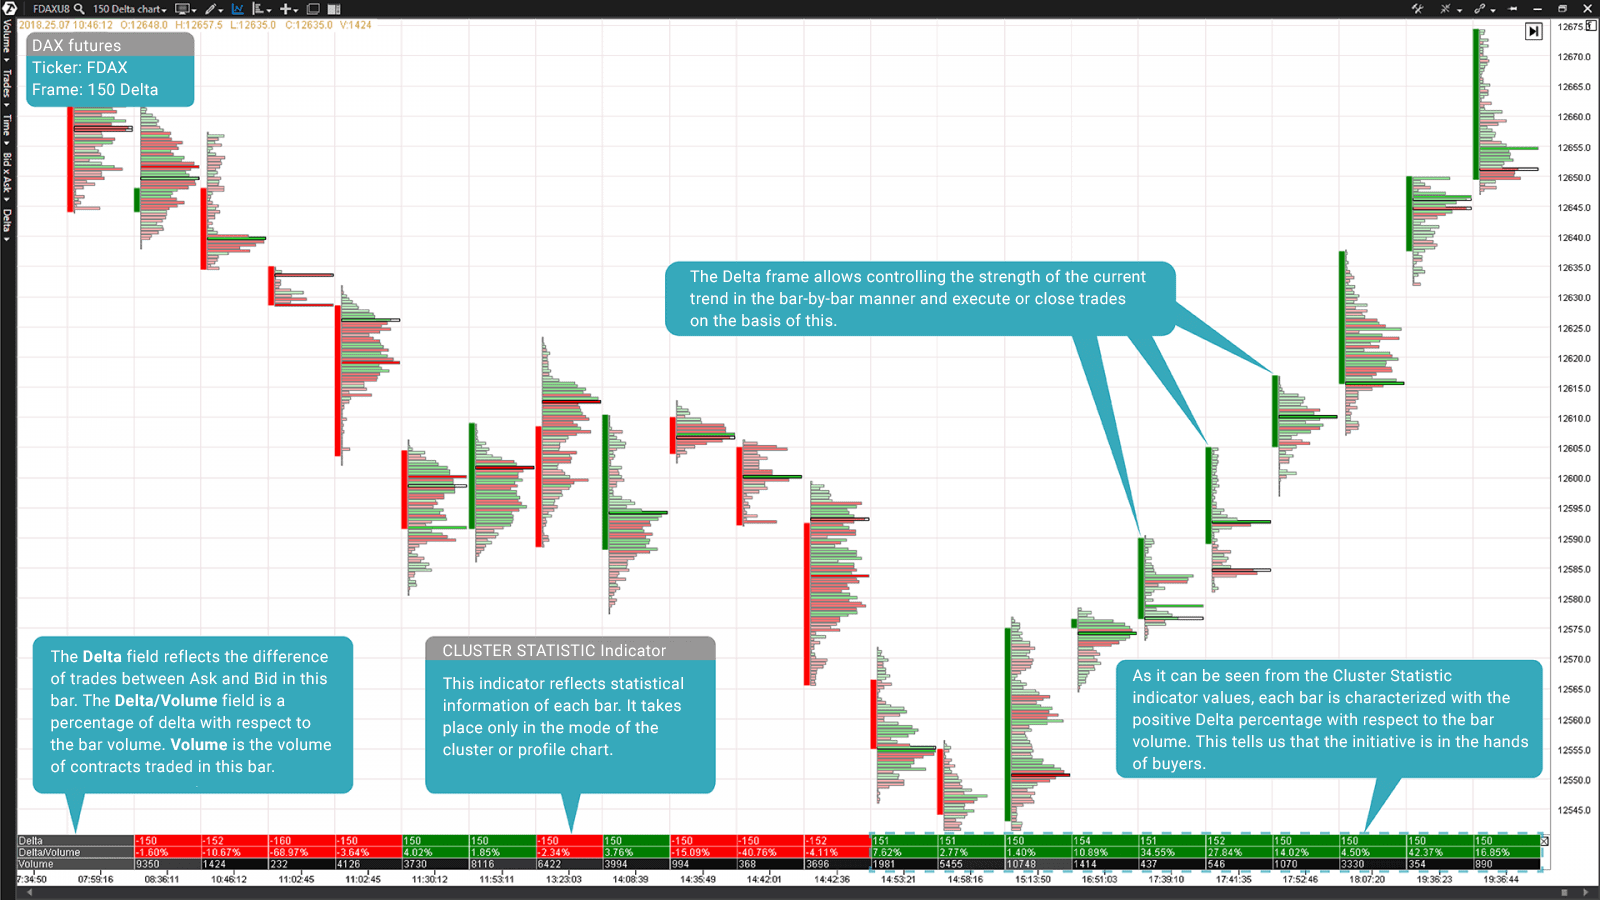
Chart 3 is a frame, which is built by the Delta of 150 contracts. This Delta value is short-term for the Dax market and is good for looking for reversals of this financial instrument and further control of the trend stability. This kind of visual presentation of the exchange data (order flow and trading volumes), available for the ATAS platform users, widens opportunities of their trading and adds confidence when executing trades.
As you can see from the values of the Cluster Statistic indicator, located in the lower part of the chart, each bar of the ascending price movement (in the right part of the chart) is characterized with the positive Delta percentage with respect to the bar volume. This tells us that the initiative is in the hands of buyers. That is why it is vital to take this information into account when analyzing forces of the current trend.
Chart 3. Footprint of a DAX Index futures (ticker: FDAX), built on the delta with the value of 150 contracts. Check out our new publications about the strategies of use of Footprint charts of the trading and analytical ATAS platform. Best of luck!


