It is a specific term, which is used in trading only. In everyday life non-correspondence or inequality is called disbalance. For example:
- improper automobile wheels balance is a disbalance, which results in their non-uniform wear;
- receipts are less than expenditures – it is a budget disbalance, which results in debts and lower life quality.
These examples suggest that disbalance is bad. And what about imbalance in trading – is it good or bad? If you are a trader, you will perceive the imbalance positively, since it opens new trading opportunities.
- Imbalance and footprint;
- How to find imbalance;
- Imbalance settings;
- With what charts imbalances go together;
- Analysis of imbalance for trading;
- Advantages and disadvantages.
All examples in this article are based on the RTS index futures (RIH9) charts.
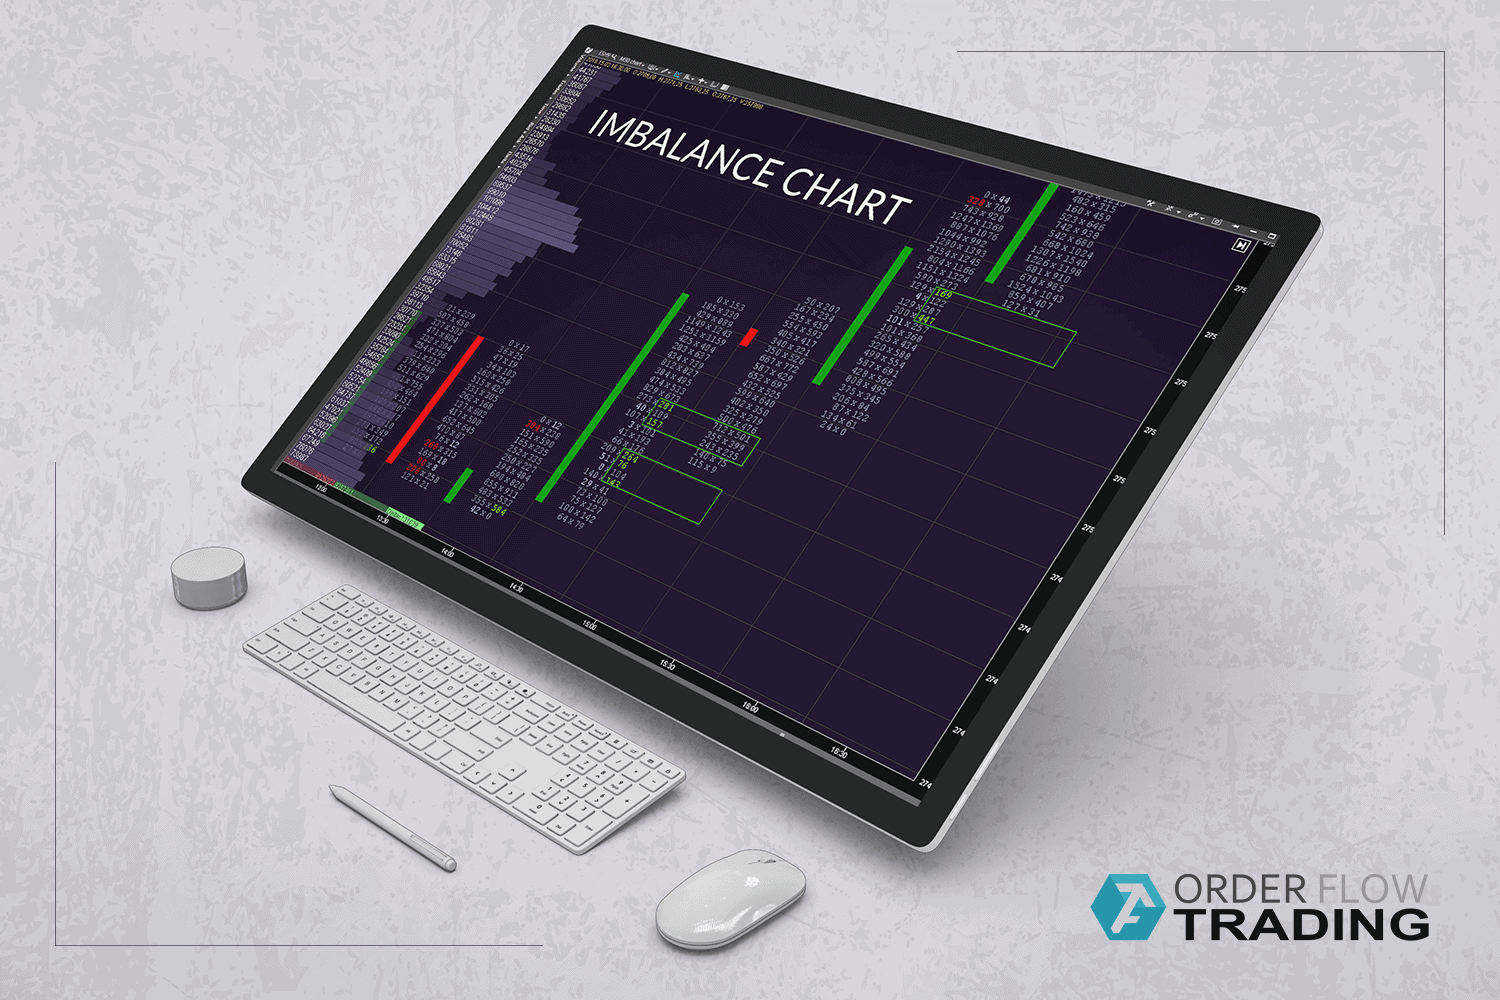
How imbalance appeared in footprint
Imbalance is a variation of a cluster chart or footprint, where a significant excess of bids and asks is highlighted by a color. Why many people do not know about it and ask – what is imbalance? Just imagine, the footprint exists for 15 years only. This is the reason why many traders cannot work with it.Footprint is an X-ray of each bar. It conveniently visualizes a flow of executed trades at each price level in real time.
And imbalance footprint additionally highlights by the color those price levels, where some market participants manifested aggressive behavior.
How imbalances are built
Traditionally, the following ones are at the same price level:- volume, traded by bid;
- volume, traded by ask.
Imbalance compares bids and asks diagonally and shows a significant excess of one over the other. That is, a bid is compared with an ask, which is one level higher, and an ask is compared with a bid, which is one level lower.
Only the left side turns red and only the right side turns green!
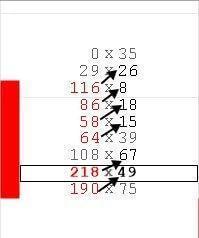
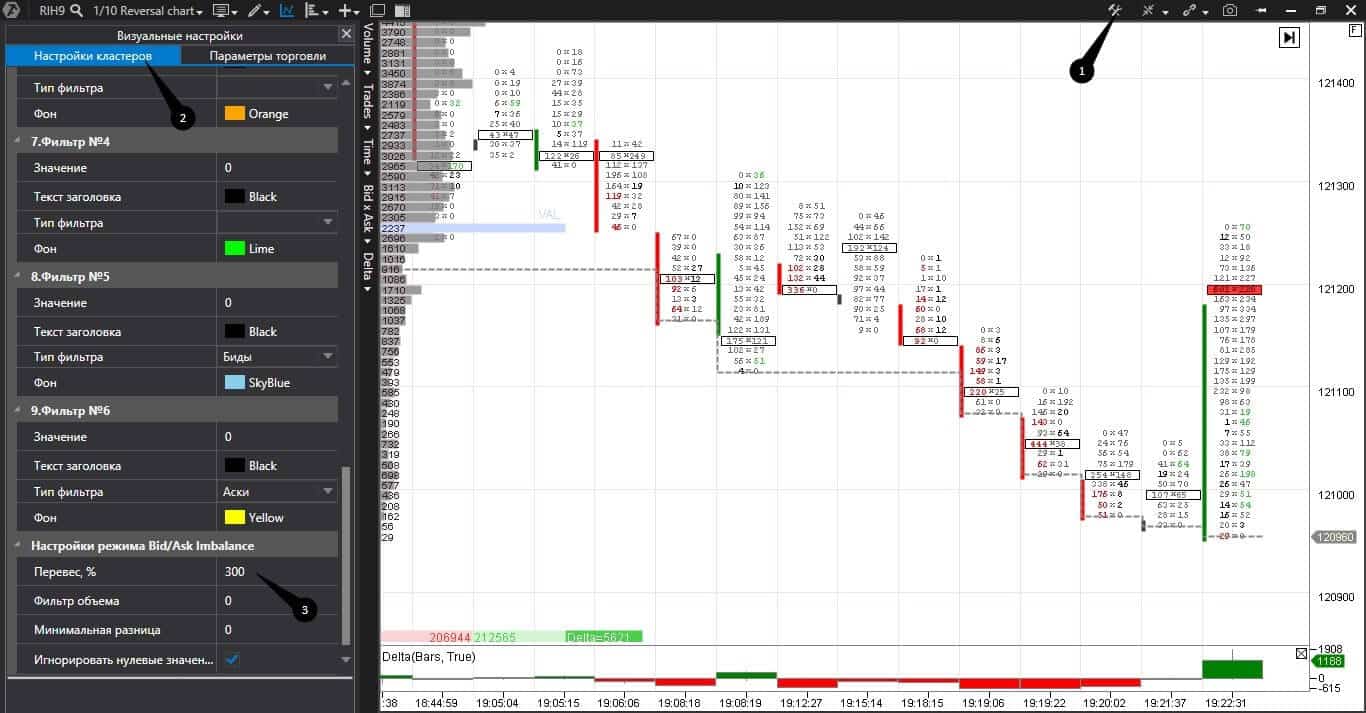
When adjusting the imbalance, you need to set its size in its settings. An optimum imbalance size depends on what instruments and with what timeframe you work with. An example of manual calculation of imbalance of the bar from the picture above is shown in the table below. All bars, which have more bids than asks by 300% and more, are highlighted red.
| Red imbalance 300% | Bids, number of contracts | Asks, number of contracts |
| 446% | 116 (116/26=446%) | 26 |
| 1075% – this level will be the brightest one, since it has the biggest overweight | 86 (86/8=1075%) | 8 |
| 322% | 58 (58/18=322%) | 18 |
| 426% | 64 (64/15=426%) | 15 |
| 325% | 218 (218/67=325%) | 67 |
| 387% | 190 (190/49=387%) | 49 |
The comparison algorithm is based on the order book or Smart DOM operation. Look at the RTS index futures (RIH9) order book before trading started.
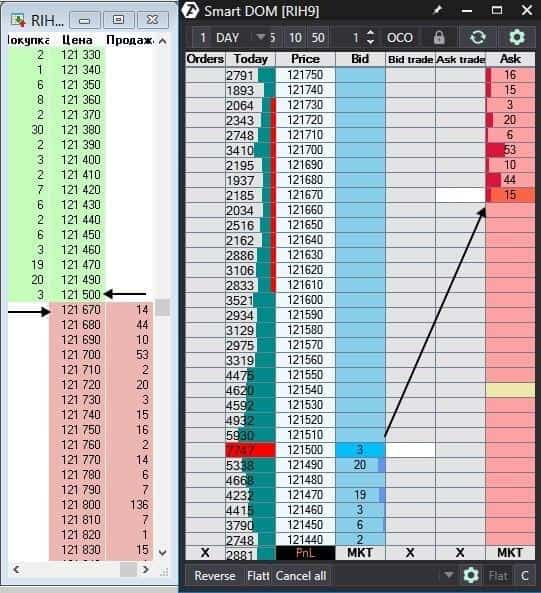
In order to turn your chart into a footprint imbalance, you should:
- launch the trading and analytical ATAS platform;
- select the “clusters” mode of display;
- and select Bid*Ask Imbalance in the Bid*Ask section.
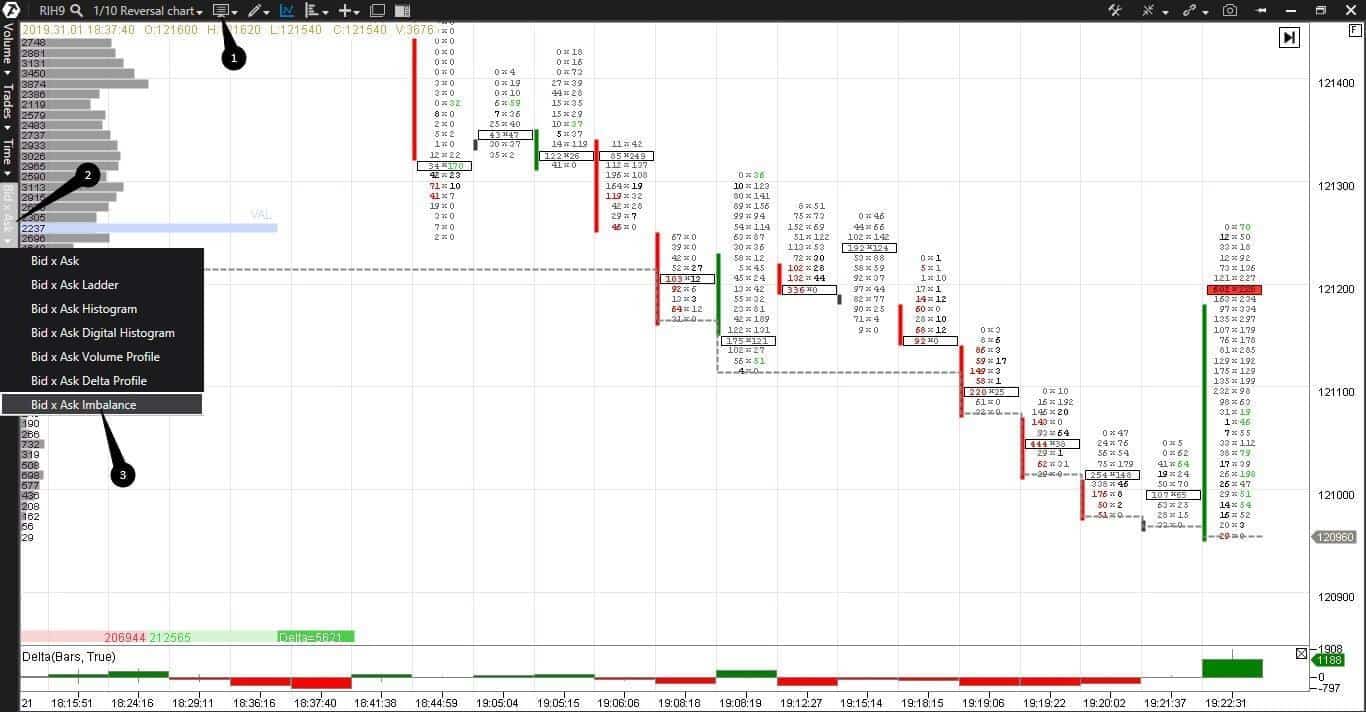
By default, you will see imbalances with the 150% setting. You can change this figure in the clusters settings.
What charts imbalances can be combined with
Imbalances work with all types of charts.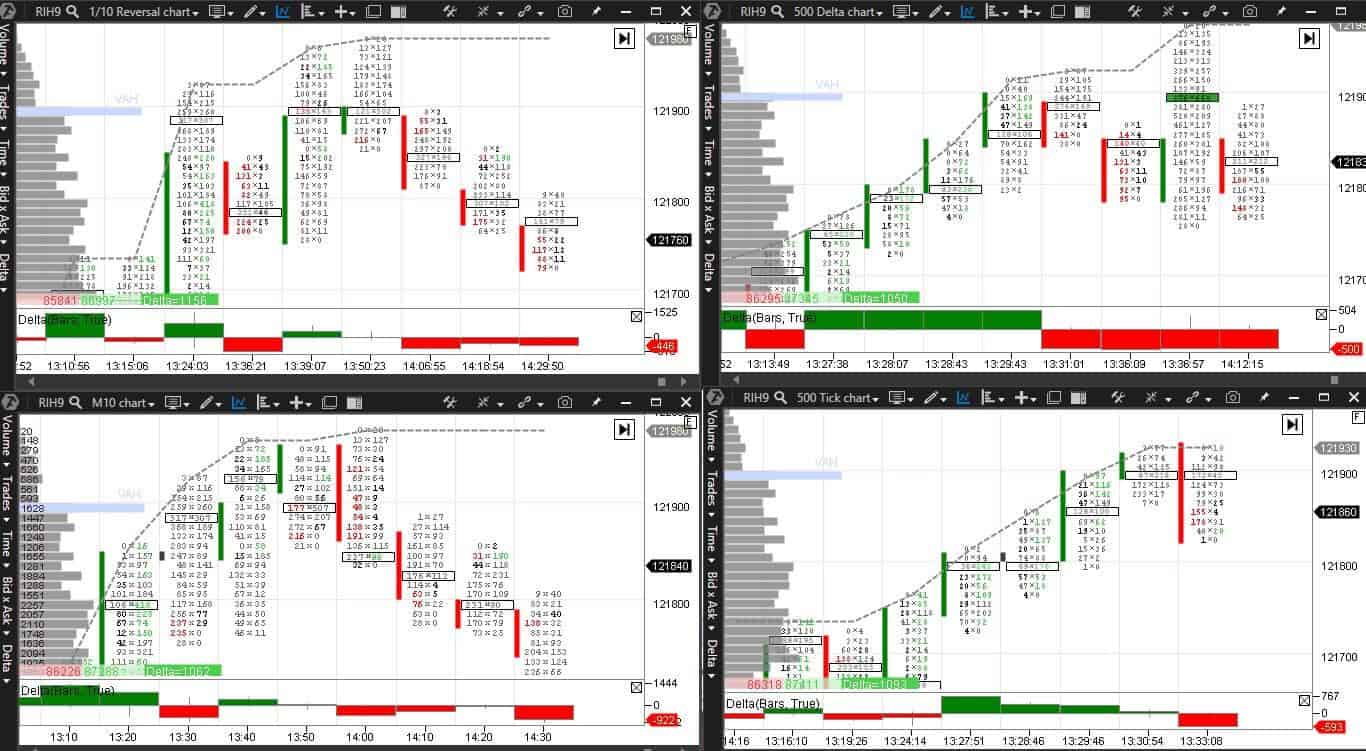
- Top left – reversal (1/10) chart. A new bar is formed when the price passes one tick and pulls back by 10 ticks after that. The reversal chart is not connected with time, it depends only on the price movement. We consider examples using the reversal charts in this article.
- Bottom left – 10-minute chart. A new bar is formed every 10 minutes;
- Top right – delta type chart (500). A new bar is formed when a difference between bids and asks is +500 bigger or -500 smaller. The delta type chart does not depend on time, it depends on the price movement only;
- Bottom right – tick chart (500). A new bar is formed every 500 price ticks. The RTS index futures price tick is RUB 13.12. The tick chart also does not depend on time.
Imbalance analysis
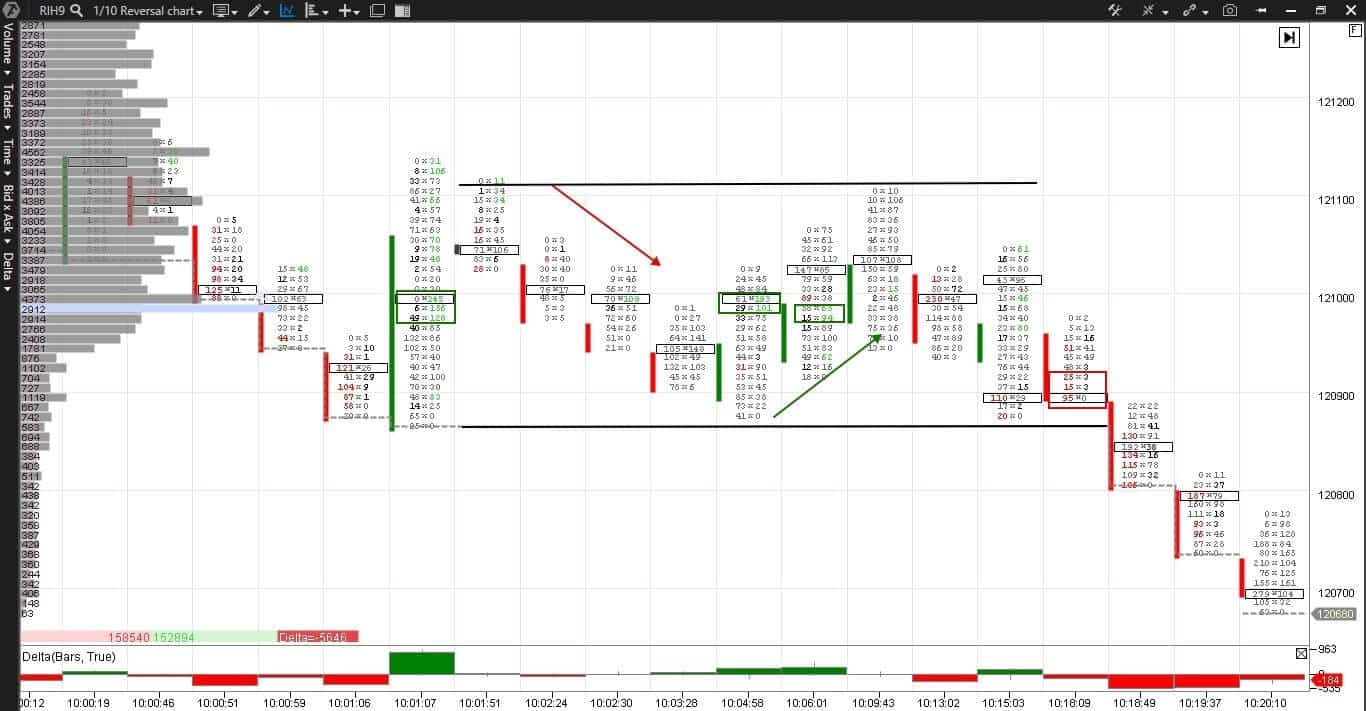
Here we have a pair of charts. To the left – a reversal (1/10) chart with adjusted imbalances, to the right – a Bid*Ask Volume footprint and delta indicator. We consider a situation, which takes place during the session beginning, when the market could be described as especially volatile. This is one of the reasons why we selected such a short-term period. Another reason – in order to find and show imbalances in a more pronounced way.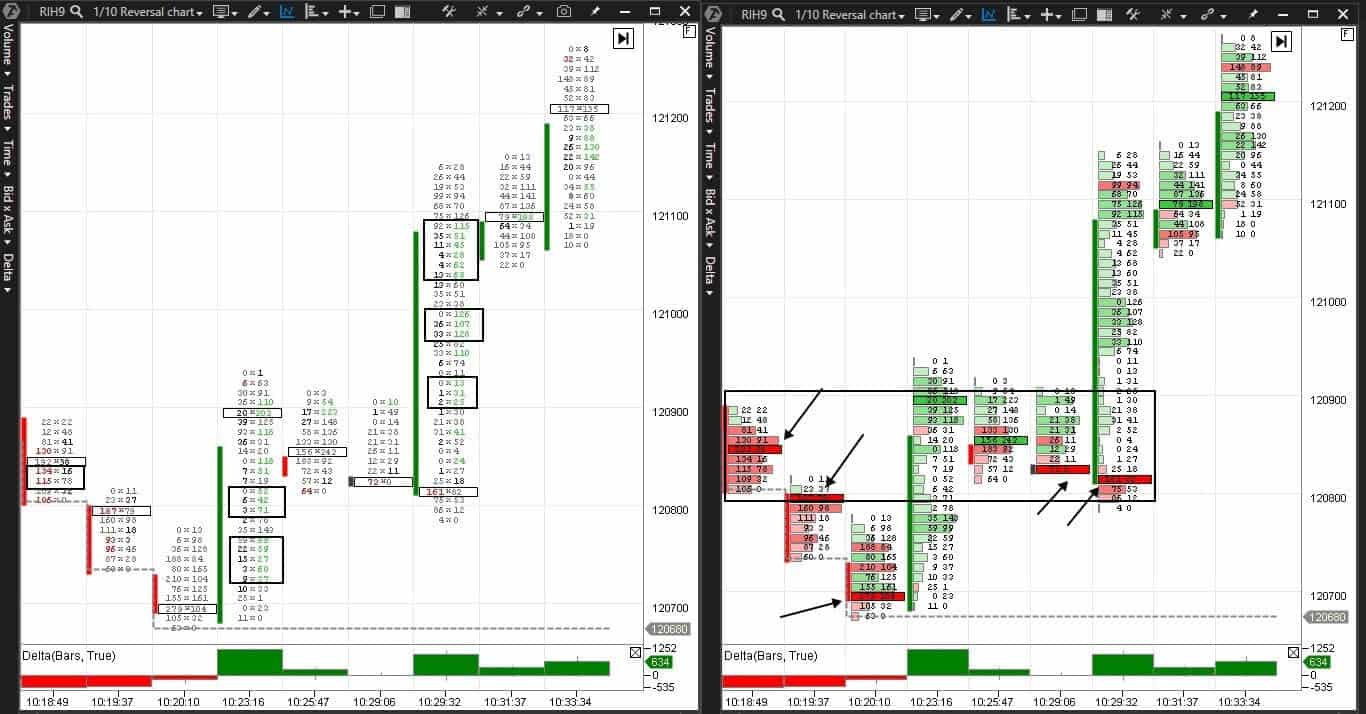
In the beginning, the sellers successfully dominated over the buyers. The black arrows mark the maximum volume areas of each bar under control of the sellers.
- A reversal bar emerges at 10:23 at the day’s low, marked with a grey dotted line. The delta is positive and the buyers have advantage at each price level;
- The next two bars show a not very explicit struggle between the buyers and sellers and the price masters those levels, where there were significant sells and buys;
- The buyers break the level at 10:29:32 and the price rushes up again. The trading situation seems to be obvious in view of the passed time. However, the downward movement of the maximum volume area from 10:23:16 until 10:29:32 makes traders nervous.
To the left – a footprint imbalance of 300% and the delta indicator. Black rectangles mark multiple imbalances, that is imbalances at several price levels in sequence. Further on, these areas create support and resistance levels.
- We can see imbalances of the sellers at 10:18 and 10:19, but there are no sellers at 10:20 at the day’s low any more! The sellers had no kick left;
- Instead, multiple imbalances of the buyers emerge at 10:23. Two imbalances in one bar – from 5 price levels and from 3 price levels. It is very much in view of the overweight setting of 300%. Very many aggressive buyers will prevent the price from falling down and will resist like bricks;
- There are small imbalances on the next two bars, but the price does not go below the level of the most multiple imbalance. Since the price cannot go down, it means it will go up, what we see on the next bar at 10:29:32. Note that there are 6 buyers imbalance levels in sequence!
We considered the same trading situation, but the imbalance analysis adds composure and confidence.
The imbalance footprint was developed specifically for those who had difficulty in working with other footprint types. The trading and analytical ATAS platform has as many as 25 footprint types.
If you have difficulties in perceiving other footprint types, try imbalance. Just look at the color. Much red color in sequence means aggressive sellers. Much green color in sequence means aggressive buyers. Imbalances show who controls the market and what is a current market tendency. Imbalances is a reason of the market price movement and the bigger the imbalance, the greater the movement is.
Imbalances and reversals
The price reversals is an ideal application of the imbalance with a low risk level. Look for reversals at significant levels. These could be the day’s high/low, support/resistance level and boundaries of the Value Area (VA) or Point Of Control (POC).Let us consider an example. We have a reversal (1/10) chart on an RTS index futures (RIH9). The delta indicator shows who is more aggressive – buyers or sellers. The Daily HighLow indicator shows movement of the day’s high and low levels.
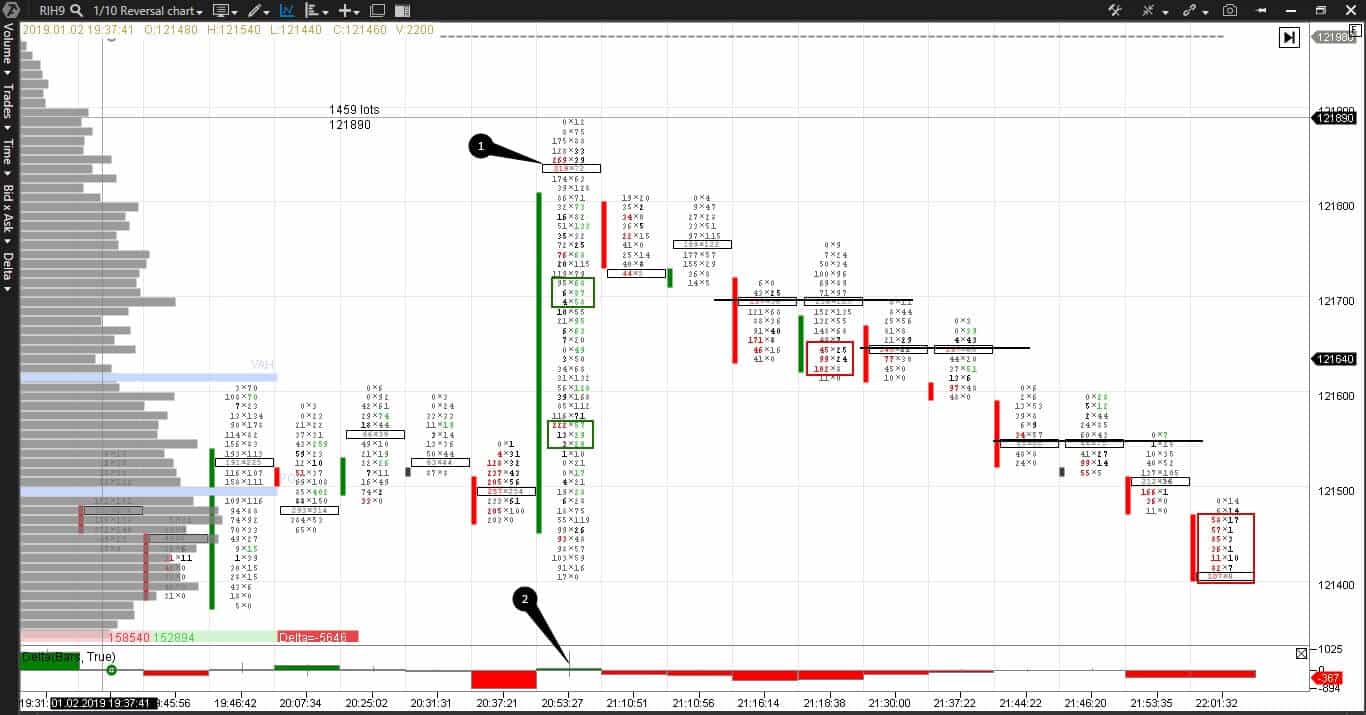
How to analyze imbalance.
Identify signs of a possible reversal at a significant level:- Emergence of an opposite imbalance. For example, a negative imbalance at the day’s high level or positive imbalance at the day’s low level. Multiple imbalances or imbalances, at least, at three price levels in sequence have a bigger significance. They emerge when major players, who cannot post the whole order at one price level, enter the market. Figure 1 marks a negative imbalance on a candle high;
- Absence of imbalances of the same color as that of the previous bars after the trend movement. We can see multiple green imbalances, marked with rectangles, at 20:53, but the next bars from 21:10 until 21:18 do not have even isolated green imbalances;
- Delta with a long shadow. A long green candle was formed at 20:53. Its delta, marked with figure 2, was completely positive in the beginning, but then the sellers entered at the candle high and a long top shadow appeared on the delta. Such a formation tells us about a struggle between a big number of buyers and sellers;
- Movement of the maximum volume area towards the opposite from the existing trend direction. The maximum volume level went below the previous bar level at 21:10. Pay attention to an equal maximum volume level on some neighbouring bars. These price levels are marked in the chart with solid lines. Later, the price can stop at these levels and test them;
- A big volume but no imbalance is a struggle between buyers and sellers.
Trading in a range
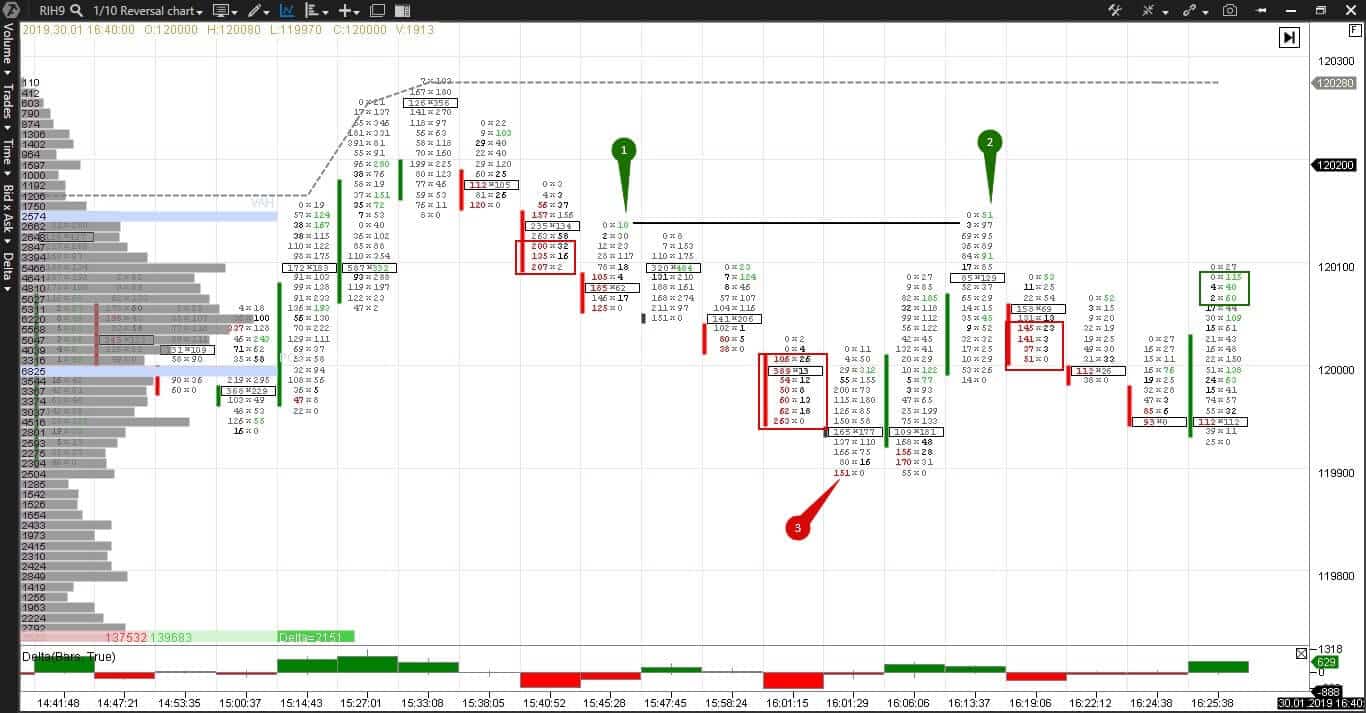
Ranges are formed when the price cannot overcome a significant level several times. These areas are also called price consolidation areas. As a rule, an exit from consolidation takes place towards the previous trend.Imbalances and delta in the consolidation area could show the exit direction. Very often, the POC level of neighbouring bars in a range lines up at one level. Here again we have an RTS index futures (RIH9) reversal (1/10) chart with the Delta and Daily HighLow indicators.
If the price cannot go higher, it means that it will go lower, because consolidation does not last forever. A multiple negative imbalance, marked with a red rectangle, was formed at 10:18:19. A negative delta and a maximum volume level, which went down, send a warning that the price will try to break the range’s low.
Trends
Imbalances produce “fuel” for the trend price movement, because it is an aggressive volume. Imbalances confirm trends and calm a trader’s nerves, allowing him to hold a profitable position as long as possible.Here again we have an RTS index futures (RIH9) reversal (1/10) chart with the Delta and Daily HighLow indicators.
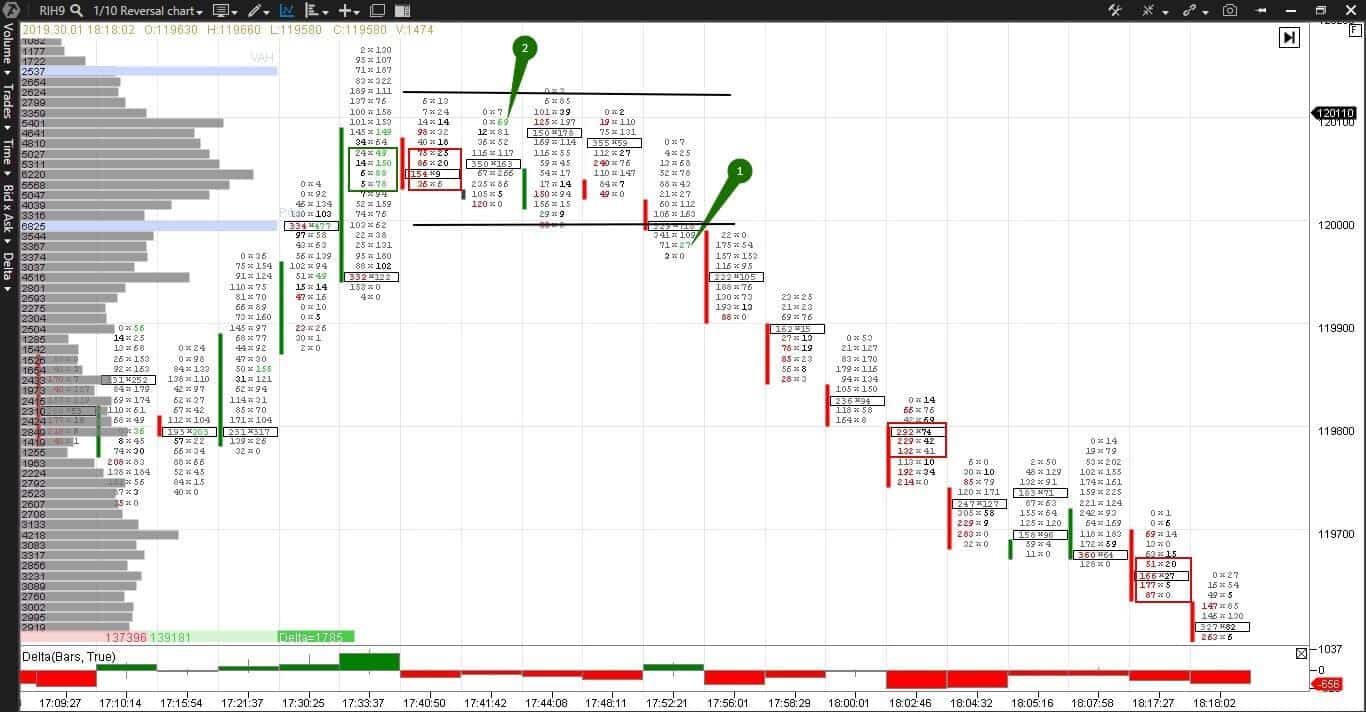
Trend attributes:
- Absence of the opposite color during an imbalances movement. Note that there are only two isolated positive imbalances, marked with points 1 and 2, and both of them take place during the consolidation period;
- 4-5 bars of a focused movement. The bars are closed at the low and below the previous bar low;
- “Thin” bars. Thin bars tell us about a sharp price change. The faster the price moves, the thinner and longer the bar is and the more traders are late to enter a trade. Further on, these thin multiple imbalances become a support or resistance level. Those traders that failed to buy or sell during the initial sharp price change would prefer to enter the market when the price comes back to these levels;
- Multiple imbalances. As we already stated before, the multiple imbalances confirm the price movement, since they show aggressive major buys or sells at certain levels;
- The maximum volume area movement towards a developing trend. The maximum volume levels, marked with rectangles in each bar, gradually move down from 17:48 until 18:05;
- Longs/shorts that got stuck at extremum points. These are the traders who buy on highs and sell on lows. We will consider this situation in more detail below.
Stuck longs/shorts
Corrections and bounces take place during a trend movement. Opposite imbalances on extremum points are longs and shorts that were entrapped during the correction. Traders that do not see a footprint, quite often buy high and sell low. Let us look, for the last time in this article, at an RTS index futures (RIH9) reversal (1/10) chart.
We will tell you how to trade with the help of imbalances and what other indicators to use in the next part of the article.