Footprint charts appeared about 20 years ago, however, there’s still little information on this trading subject on the Internet. And there are no printed books at all, although Footprint is an efficient and modern instrument.
ATAS has 25 variants of cluster charts. They show the number of bids and asks, number of seconds and trades at every price level but with different visualization and details. In order to see the Footprint, you need to increase the chart scale or select the ‘Cluster’ mode in the upper menu.
Basics of the Footprint chart
It is important to understand order matching principles for efficient Footprint analysis, that is why we will remind you the basics. There are market and limit orders. Limit orders are used by traders who want to enter into a trade at a certain price and are ready to wait. Market orders are used by traders who do not want to wait and are ready to enter into a trade at the current price.
A trade takes place at the moment when the market and limit orders meet, that is why market orders are executed at prices of opposite limit orders. That is, a trader with a limit order receives the price he wanted to receive. A trader with a market order receives the closest price which is offered by a limit order.
Limit buy and sell orders are not at one price level, otherwise a trade would have been executed. Limit buys are lower in the order book, while limit sells are higher and there is a spread between them.
If there are many limit orders at some price level, they do not allow market orders to move further. In this case, the price stops and rolls back. If there are not many limit orders at some price level, the market orders move further easily.
Footprint to the left in the picture below shows market sells – a trade is executed at the bid price. There are market buys to the right – a trade is executed at the ask price. They are compared diagonally since the buy and sell prices are not at the same level.
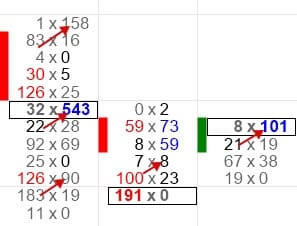
Limit orders are not visible in the cluster chart. However, they could be seen in Smart DOM or with the help of the Depth of Market and DOM Levels indicators.
Detailed presentation of bars in the form of clusters reduces the global picture but allows us to notice important details. The less volatile the instrument, the more convenient it is for working with the Footprint. It could be inconvenient to work with quick and volatile markets, since the bars become too extended.
How to analyse the Footprint chart
The crash course is finished here and we start analysing cluster charts. In this article, we will analyse three specific features, which could be easily noticed in the Footprint:
- Single prints at extreme points. As a rule, single prints are very small amounts of sold lots, for example, from 1 to 9. These numbers could be different for different instruments. Single prints show weakness, since the market cannot move in this direction any more.
- Big trades at extreme points. The ‘big traded value’ is different for different instruments. The amount of 100-200 contracts is much for the Moscow Exchange index futures, while it is little for the Brent oil futures. You may identify a ‘big’ number only based on the experience.
If the price stopped despite availability of big market orders, it means that there are even bigger limit orders at this level. Limit orders create an obstacle on the way to the further price movement.
- Imbalances at extreme points. In simple words, imbalance is a several-fold predominance of market buyers over market sellers (or vice versa). Buys and sells are compared diagonally, and not straightly. By default, ATAS imbalance is 150%, but this setting could be changed.
We wrote ‘at extreme points’ in every item, because you may trade with a minimum risk at these levels. As a rule, a potential profit is much higher than a risk. And understanding that a trade moves against a trader comes much faster.
Extreme points could be different:
- the previous day’s highs and lows;
- the previous day’s Value Area High and Low;
- support and resistance levels of different time-frames;
- local highs and lows of the current trading session;
- Fibonacci retracement levels.
Footprint usage examples
Let’s consider examples on various instruments of the forward and stock markets. Let’s analyse candlestick charts and Footprint-imbalance.
We added the Delta and Open Interest indicators to the 5-minute EUR/USD futures. The Open Interest (OI) data are shown during a trading session only by the Moscow Exchange, that is why we work with the ED futures. If OI increases, it means that traders enter the market with new trades, if it decreases, it means that traders close old contracts.
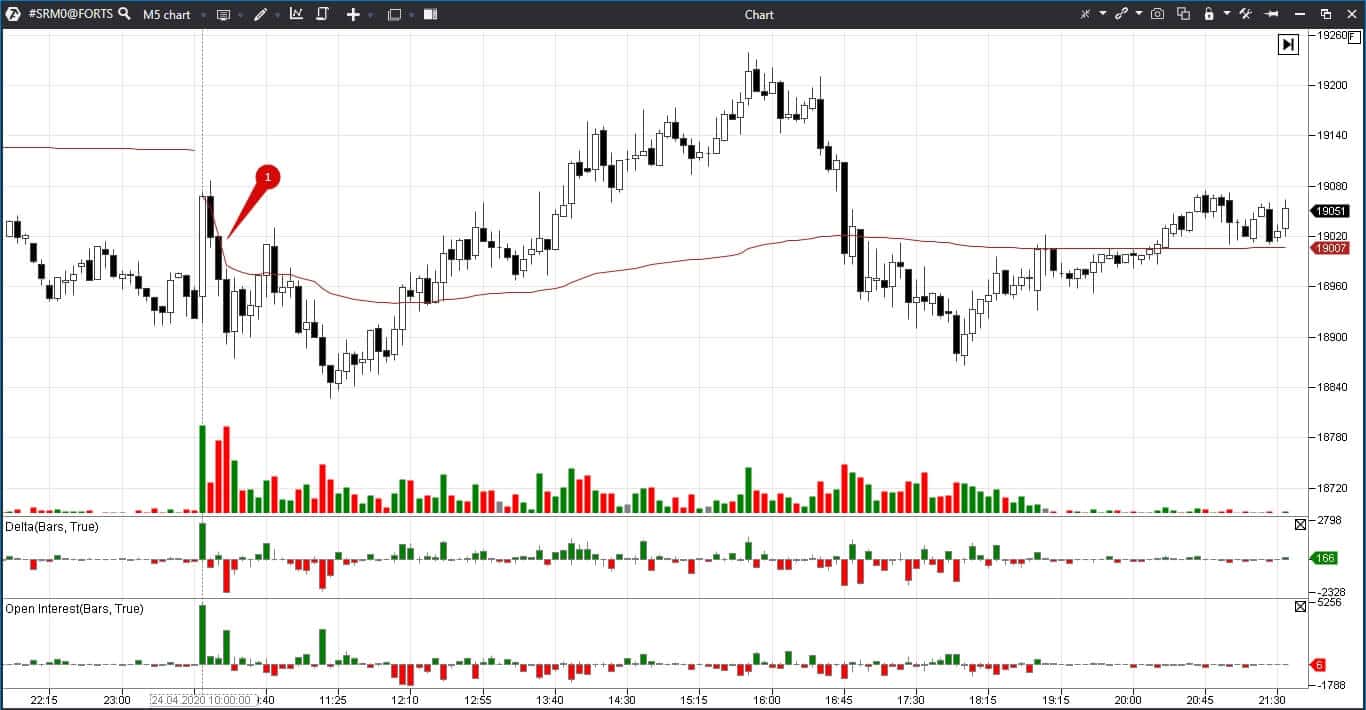
We also added two profiles in the form of TPO (Time Price Opportunity). The previous day’s profile is to the right and today’s profile is to the left. Extreme points could be identified with the help of these indicators. Two black horizontal lines mark the previous trading session’s high and the previous day’s Value Area High.
The price stayed in the narrow range of our levels during the first half of the trading session. That is why it broke these levels in both directions. Volumes were much bigger in the event of the upward breakout.
Let’s see how breakouts and local extreme points looked like in the Footprint chart. We marked interesting candles with red rectangles and numbers.
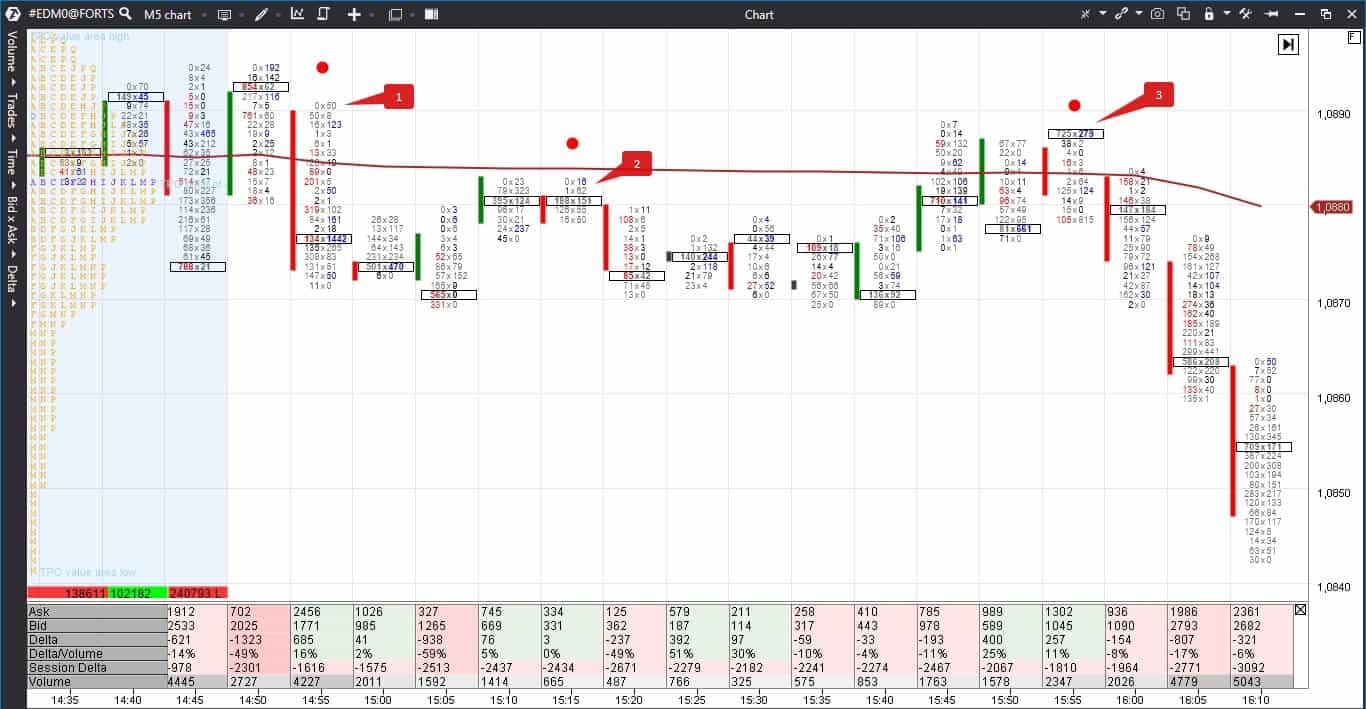
Imbalance in the chart is 400% and we also added the VWAP (Volume-Weighted Average Price) indicator. Institutional investors consider this price to be the asset fair value.
Three bars are marked with red dots in the chart because they could be interesting for opening short positions. As a rule, falling bar highs and growing bar lows are considered when analysing the Footprint.
- Bar 1: only 50 contracts were bought at the latest price level, which means that traders didn’t want to buy at high prices. The volume of this bar is much bigger than that of the previous bars and, despite the positive Delta, the price moves down.
- Bar 2: there are very small buys and buyers’ imbalance at the extreme point. If these are new buyers, they got stuck at the bar high in a loss-making position.
Bar 3: there is an imbalance at the extreme point again, but, apart from that, 279 contracts were bought at the latest price level while only 2 contracts were bought at the latest but one level. It is an example of a big trade at the extreme point – market buyers met limit sellers here and failed to move higher. This bar confirms two previous signals and the short position opening risk here is just several ticks.
Let’s move now several bars further – to the local low of the day.
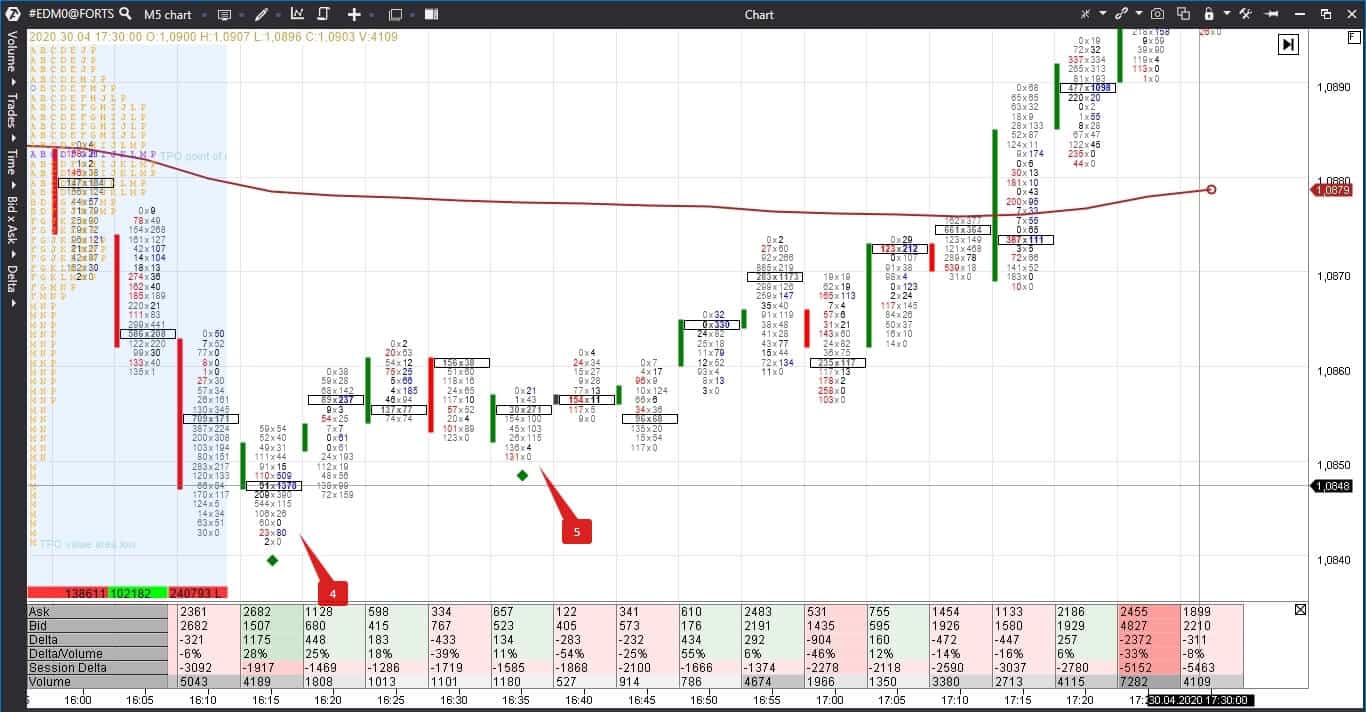
Sellers got stuck at the lows in bars 4 and 5. The Delta of these bars is positive and the volume moves up together with the price. The price doesn’t move below the level of big buys in 1,378 contracts. It made sense to close short positions here and to open long ones since the risk was only 5-10 ticks – till the day’s low or the big buy level.
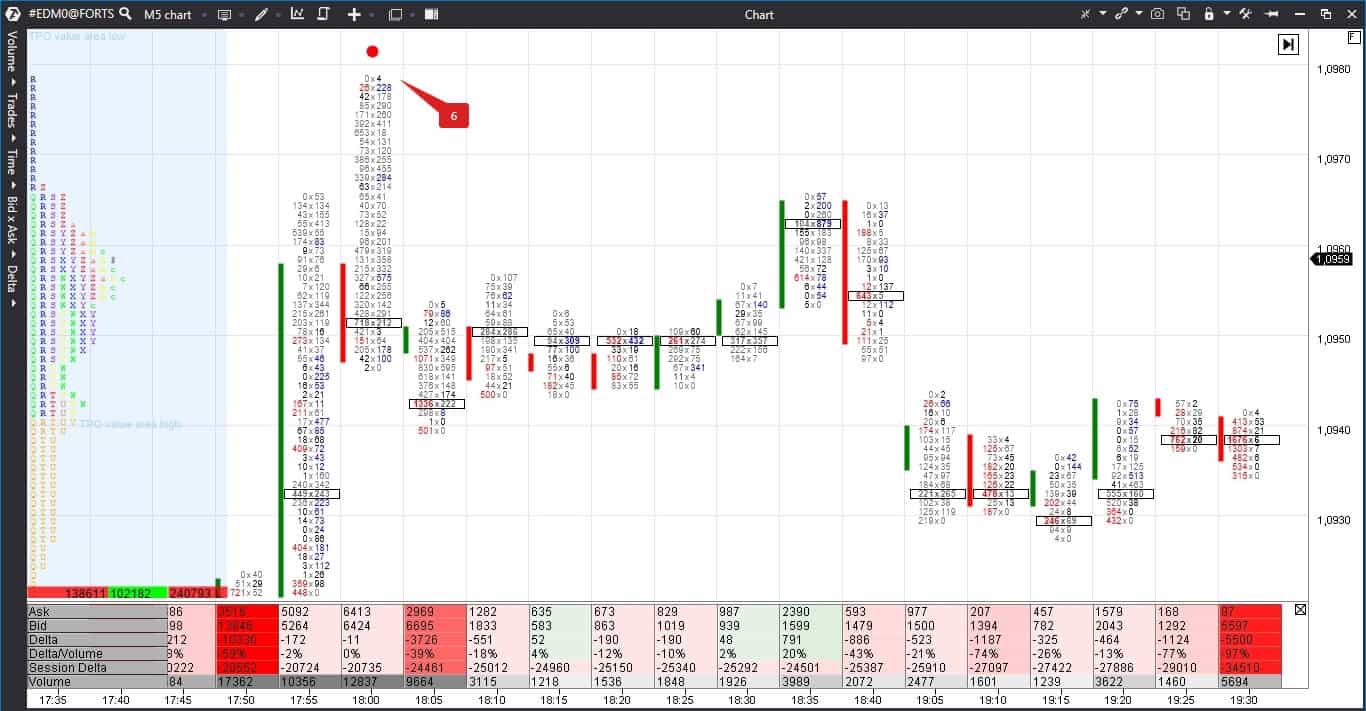
We see a single print in bar 6 – only 4 contracts were bought at the latest price level, while 228 contracts were bought at the latest but one level. A single print in itself shows weakness of buyers. However, this bar also has an imbalance at the extreme point – perhaps, new buyers got stuck in loss-making positions. We add the negative Delta here and make a conclusion that long positions should be closed.
Examples of Footprint usage in the stock market
Let’s consider now how the cluster charts work in the stock market through the example of the Walmart stock. We remove the OI indicator because American exchanges do not show it in the online mode.
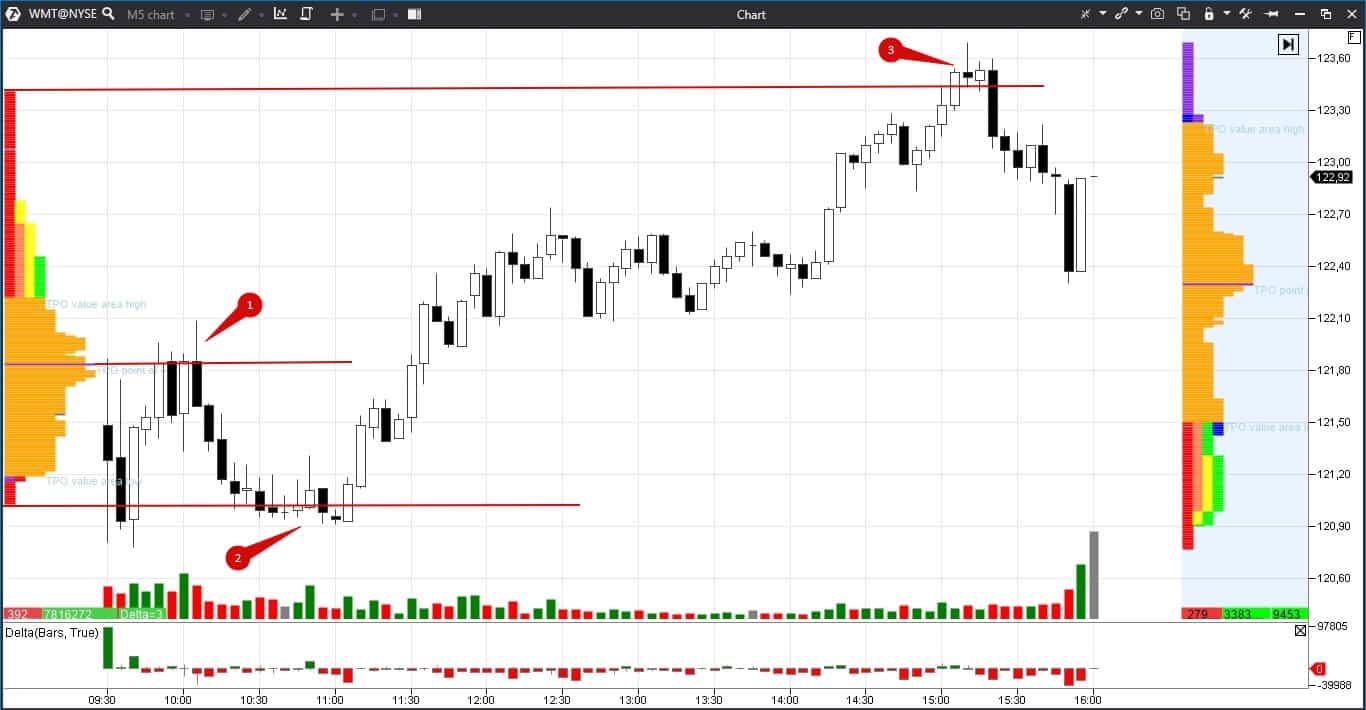
This time we built levels using the high, low and maximum volume of the previous trading session. Bars are long in this chart that is why it is less convenient to analyse the Footprint here. We reduced the imbalance setting to 300%.
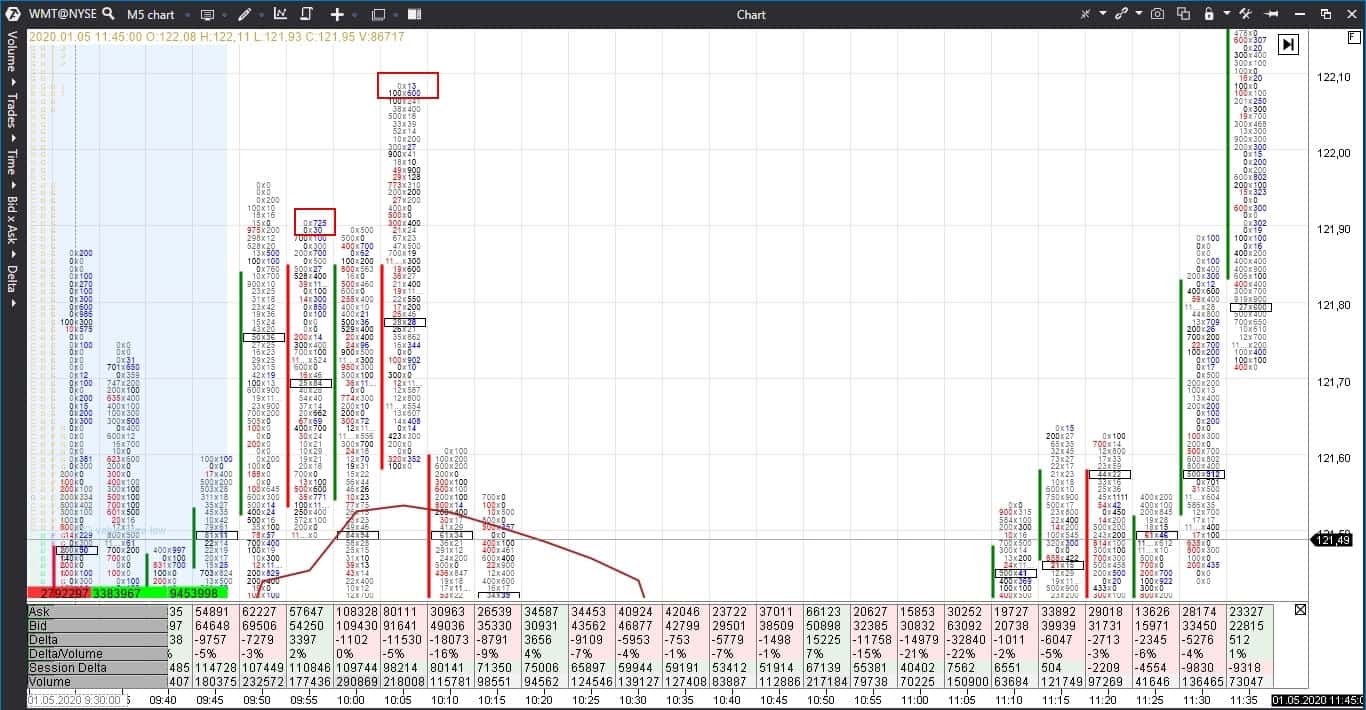
We see the buyers’ imbalance, single print and big volume at the latest price level at the local high in two falling bars. All these signs warn traders that the price may reverse.
However, there is a sellers’ imbalance at the local low of the day at three levels in a row – the red rectangle at 9:40. The price didn’t reach that level.
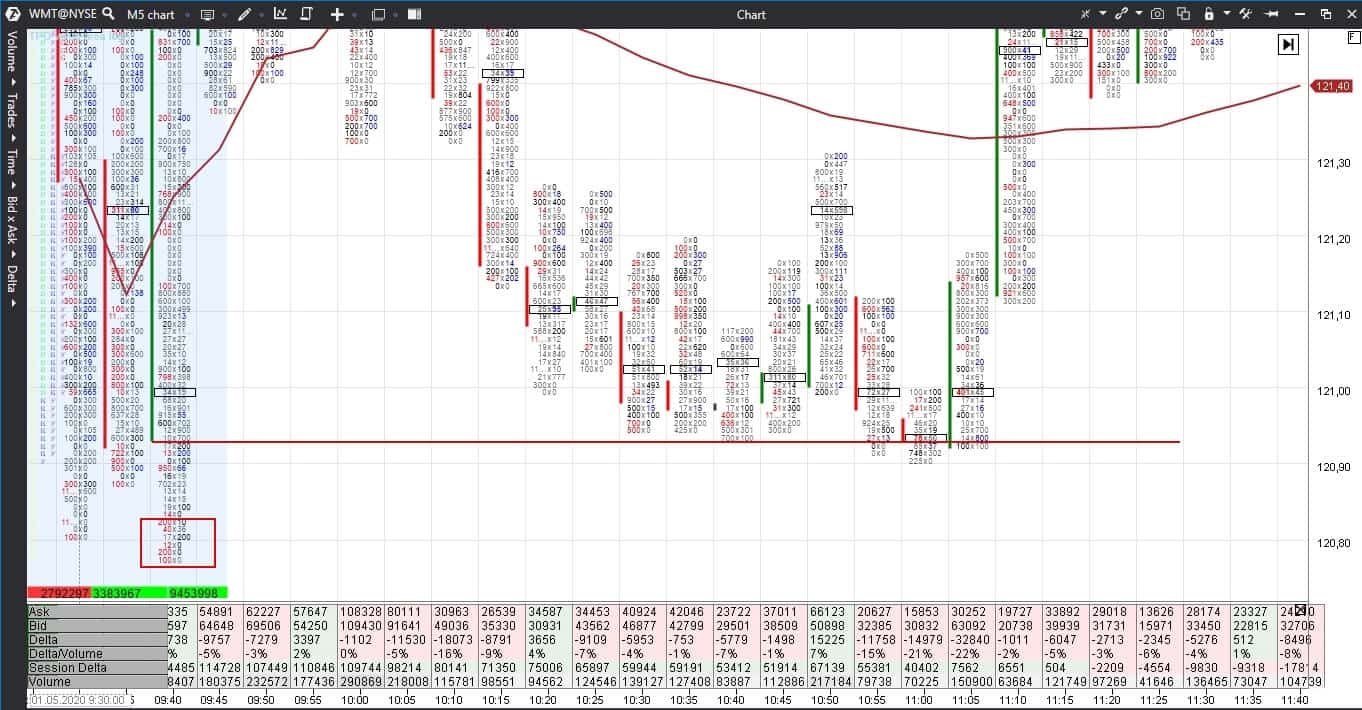
The day’s low was formed from 10:30 until 11:05 and it was higher compared to the 9:40 day’s low and the price started to increase. Let’s have a look now at the day’s high at 15:10.
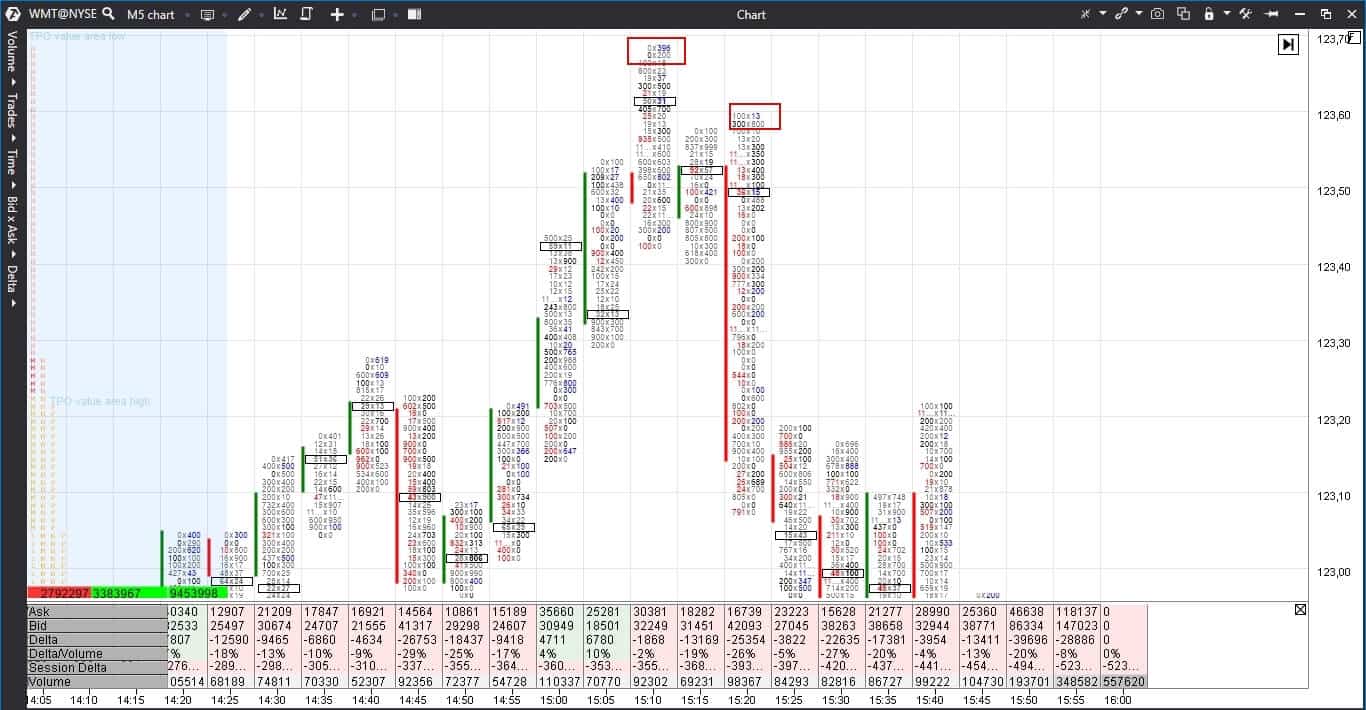
Buyers were blocked at extreme points and a single print is also available here. A lower high of the second red bar and the increasing negative Delta warn us about the price decrease.
By functionality, the Footprint could be compared with the Smart DOM, however, unlike the Smart DOM, the traded volumes are not refreshed every several seconds but stay on the screen for the trader’s convenience.
Footprint is a wonderful instrument for analysis. It confirms reversals at extreme points and shows market weakness or strength. Download ATAS and check how Footprint can supplement your trading strategy in order to increase the number of profitable trades.