How to Use the Initial Balance Indicator?
What is Initial Balance? In simple words, Initial Balance (IB) is the price data, which are formed during the first hour of a trading session. Activity of traders forms the so-called Initial Balance at this time. This concept was introduced for the first time by Peter Steidlmayer when he presented the market profile to traders. We wrote several articles about the market profile and you can read them using this link.
The market profile shows traders horizontal volumes, that is how many contracts or stocks were sold or bought at each price level. Steidlmayer believed that Initial Balance could give a trader many hints in respect of how the trading session would develop. It sets the tone of the trading session. It often happens that activity and volumes of trades during the first hour have the bigger significance than during the following hours.
Nowadays, Initial Balance could be clearly identified for regular trading sessions, for example, for the stock market. Futures markets practically do not stop, making breaks only during week-ends. For example, the S&P index futures contract is traded nearly round the clock and the first trading hour is at night time for Europeans.
That is why, the IB area for futures and currency markets could be identified using different methods:
- depending on activity of traders and trading volumes;
- your own Initial Balance could be identified in different trading sessions. To do it, you may highlight the Asian, American, European and Pacific sessions in the chart with colours using the Session Color indicator;
- you may check how prop-traders identify Initial Balance. For example, IB for the Euro Bond futures is formed from 07:00 until 08:00 GMT, which means from 10:00 until 11:00 Moscow time.
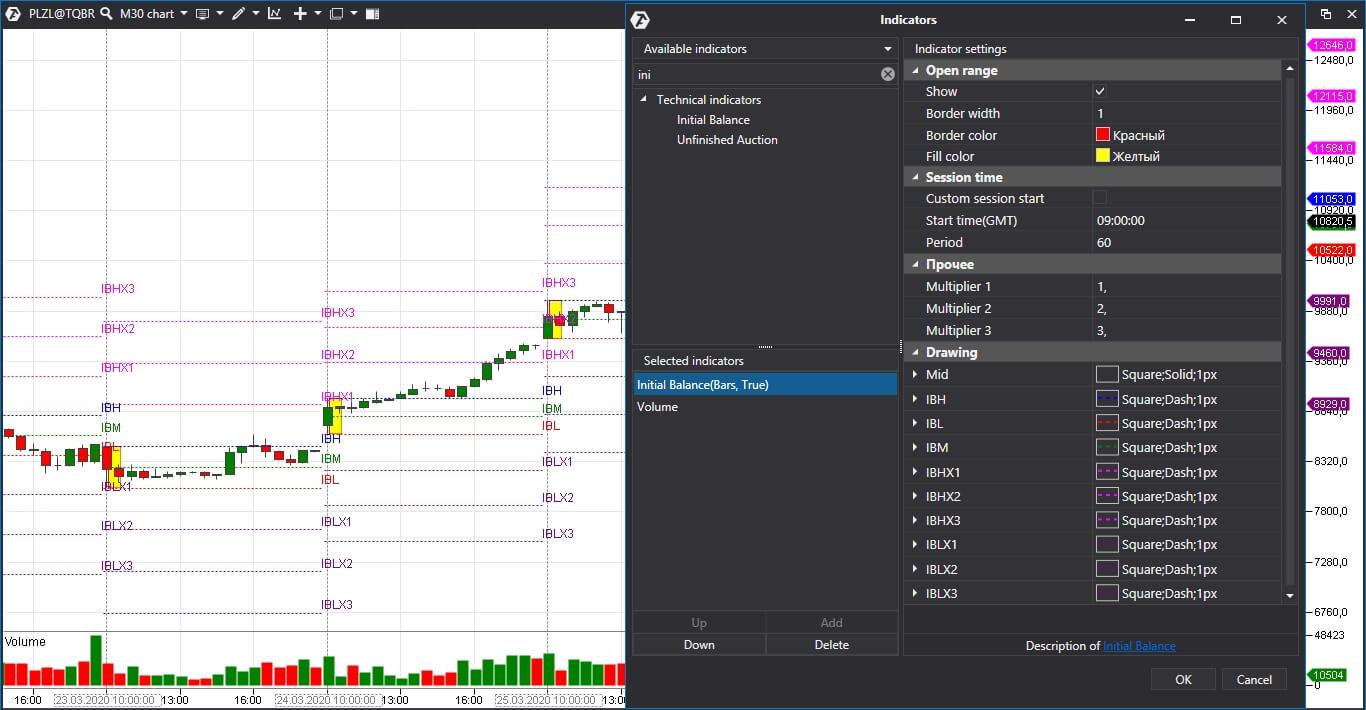
Settings of the Initial Balance indicator in ATAS.
The indicator is in the upper menu and it could also be added to the right mouse button functionality. Initial Balance is highlighted yellow by default. The chart itself could be not only the half-an-hour one but of any other period and type. The system will mark the first hour yellow by default.
Levels are added to the chart for better visualization. A trader may turn them off or change their size in the ‘drawing’ section. In order to set up the user’s beginning of a trading session, you need to check the ‘Custom session start’ checkbox and change the time below. It is important for round-the-clock futures. See Picture 1.
At first sight it seems that the chart is overloaded with various levels, since as many as 8 dash lines of various colours are in one indicator.
However, these levels would help traders to identify the trading day type. Steidlmayer specified the following day types:
- trend day – the balance expands significantly by more than two times. As a rule, the price moves in one direction from the moment of opening. These levels are marked as IBH3 and IBL3 in the chart. They symmetrically expand Initial Balance by three times up and down;
- normal day – Initial Balance practically doesn’t expand or expands insignificantly on such days. As soon as the trader identifies a normal day, he can buy at the lower boundary and sell at the upper one. It is not efficient to trade on a breakout in such sessions. The high and low of the Initial Balance are marked with IBH and IBL levels;
- neutral day – the balance expands both ways because traders do not have a shared vision about the fair price. The market tried to expand and break the IB area but failed. Traders have failed from one side and they try to break the boundaries from the other side. Failed expansions could look like single prints. Traders often use neutral days for trading reversal strategies;
- normal variation day – the balance could expand from several ticks to a double increase. Potential expansion levels are marked as IBH2 and IBL2 in the chart. They also symmetrically increase the initial area by two times up and down.
Example of use of Initial Balance
And now, let’s discuss how traders could use Initial Balance in trading:
- if the Initial Balance is narrow, most probably, the prices would expand it during further trading. Trend days are often formed after narrow Initial Balances. Narrow IB near significant support or resistance levels creates prerequisites for a successful breakout;
- if the balance of the first trading hour is wide, most probably, the asset would be traded within these boundaries during the trading session. Probability of the IB boundary breakout is low;
- if the price opens above the previous value area and the Initial Balance is formed even higher, it is a bullish sign. If below – it is a bearish sign;
- expansion of the Initial Balance could occur during the third half-an-hour – false breakouts, after which the price reverses, occur frequently;
- if prices move with a focus from the moment of opening, these days are called ‘open-drive’. The ‘open-drive’ days often become trend days;
- If more than usual contracts were traded during the first hour, perhaps, activity will dry out during the next hours. In order to identify where the volume is above average and where it is below, you may compare the average volume of the beginning of trades for the previous week with the current trading week. Taking into account the volume, a trader could expect a breakout of the IB boundaries with a higher or lower probability.
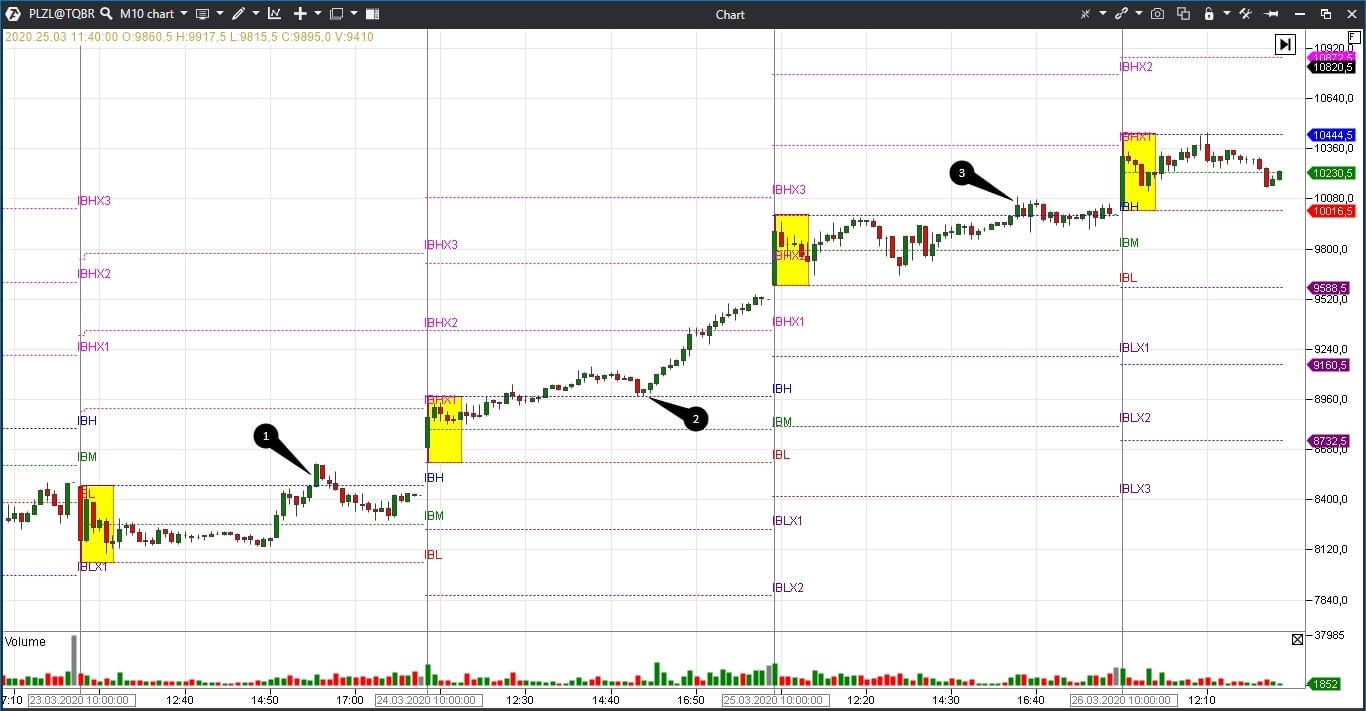
Let’s consider the 10-minute PAO Polus stock chart example from the Moscow Exchange. We use the Initial Balance indicator with standard settings. See Picture 2.
Globally – we have a growing trend, which can be seen even without trend channels. Every yellow rectangle opens above the previous one – it is a very bullish sign. Besides, there are no purely trend days here.
The first and third days look like ‘normal’ ones. The price stays in the yellow area. The day of March 24, 2020, looks like a normal variation day.
- The price tries to break the Initial Balance area in point 1 but fails.
- We see the test of the IB area in point 2.
- The situation in point 3 looks very much like overcoming the resistance level – the prices moved up to the upper boundary and positions are accumulated before the breakout, which takes place on the next day’s opening.
Width of Initial Balance would be different for every instrument. You can identify what a narrow or wide balance means only experimentally.
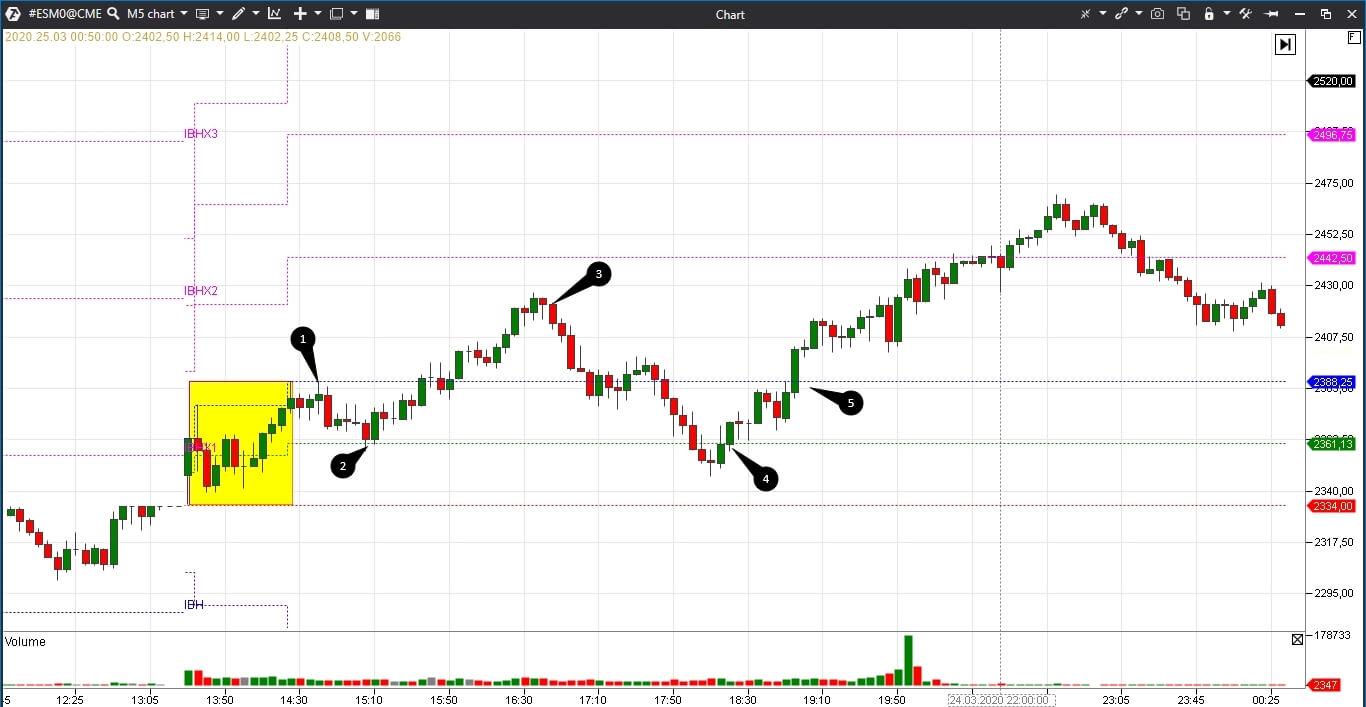
Example of work using Initial Balance in the 5-minute E-mini S&P 500 futures chart. This futures is traded practically round-the-clock, that is why we identified our own period of the trading session for the indicator – there, where high volumes were. Our period approximately coincides with the American session. See Picture 3.
Initial balance is rather narrow, which means that we could expect a breakout. We cannot draw a firm conclusion with respect to the IB size judging by one day – it is necessary to study previous data.
- The price tries to break the IBH level in point 1 but fails. The price moves down to the middle of the Initial Balance area after the failure.
- The fact that the price cannot move further down and reverses allows drawing a conclusion that there would be one more (more successful) effort to break the high of the yellow area.
- And it happens so, although the price doesn’t reach the IBH2 level and reverses in point 3. You can expect that the price would slow down near the previous IBH level and would try to reverse, but the price comes back to the yellow area.
- However, the price reverses again near the middle of the yellow area in point 4.
- Traders see a strong breakout of IBH in point 5 – a wide green candle closes at the high. This time, the price reaches the IBH2 level.
Summary
The IB indicator helps traders to locate potential intraday levels of resistance and support. We could expect the price to slow down here and post limit orders with a small risk level. We could assume, judging by the IB width, which trading strategy would be more efficient and build various trading plans for a day.


