Everything you need to know about Volume profile types
Market profile is a method of display of the market activity as it develops in time.
Peter Steidlmayer was the first who showed the market profile to the world in 1984. He believed that the market develops from a balance to a trend and then to a balance again and this cycle is constantly repeated. A balance could be identified in the chart by a balanced distribution or bell-shaped curve.
Market profile is not a trading system, which could be blindly used in trading. It is rather an instrument of discretion analysis and helps to understand the situation. It is rather difficult to forecast the future with the help of the market profile.
The market moves in a certain direction until it meets resistance. The opposite reaction leads to the price stop or reversal. While analyzing the profile, you should ask yourself two main questions:
- where does the market move;
- and how easy does it do it?
If the market is balanced, buyers and sellers are present in it in approximately similar quantities. If the market is in a trend movement, only one side predominates – either buyers or sellers.
When Steidlmayer presented the market profile, online information about trading volumes was available only to the exchange members. All other traders received reports about volumes only based on the results of a trading session. That is why the classic market profile in the form of TPO doesn’t take volume into account. TPO takes into account time and a number of times the price stays at certain levels. TPO is:
- Time,
- Price,
- Opportunity.
Nowadays, the volume data are available to all traders that is why the classic profile has changed. We can specify two main market profile types:
- Volume profile – value areas and POC are formed on the basis of volume. The time, which the price spends at certain levels, is not taken into account.
TPO – value areas and POC are formed on the basis of time and price. Volumes are not taken into account in this variant.
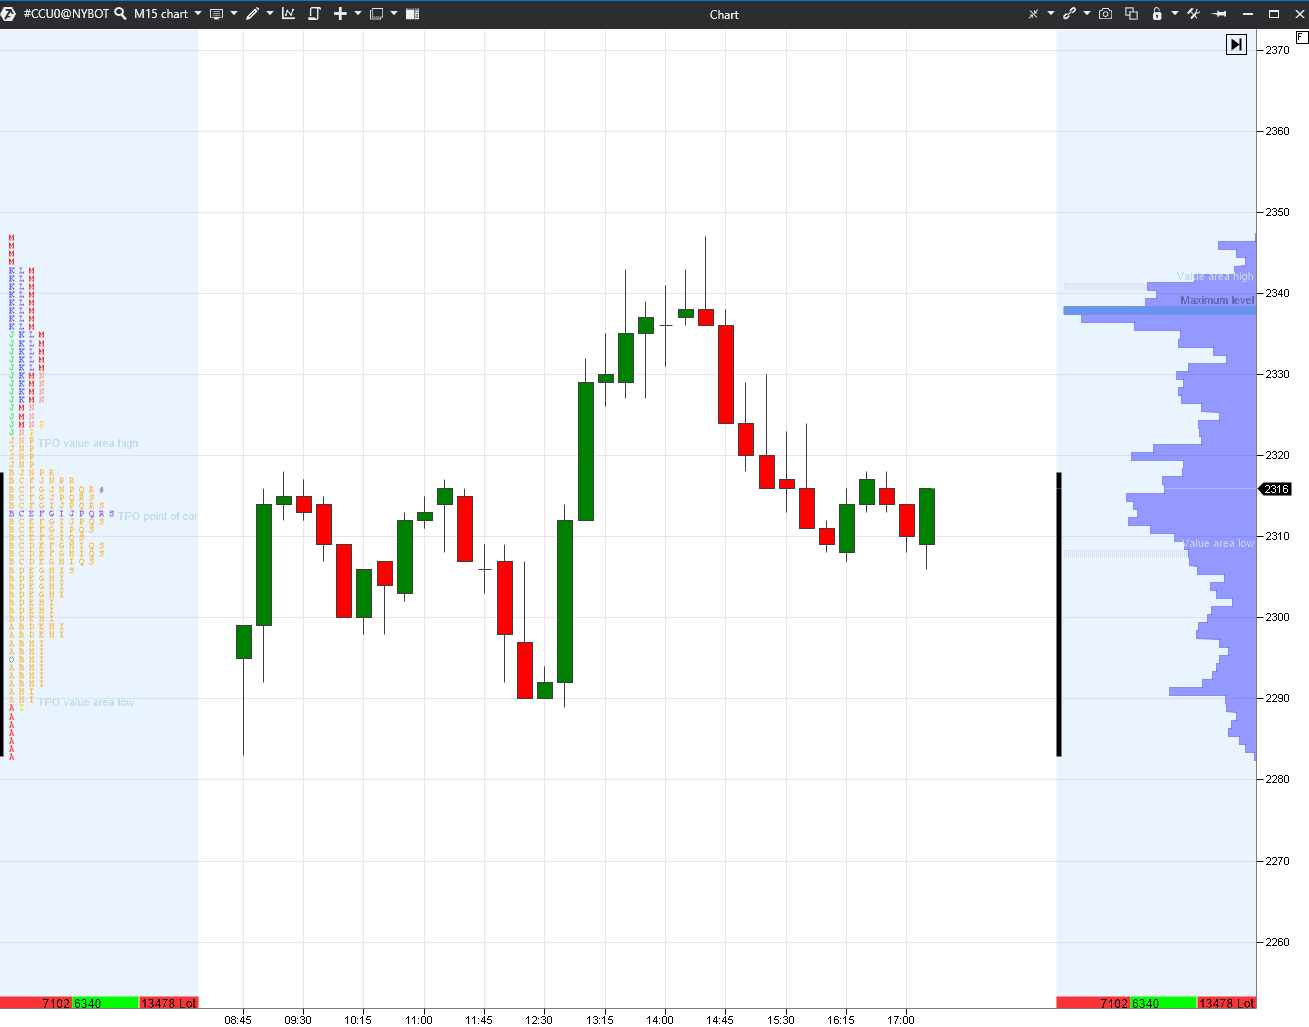
Let’s consider an example in the 15-minute cocoa futures (CC) chart.
TPO profile is to the right and the volume profile is two the left – both are from one and the same session. The black vertical zone shows the Initial Balance range. See Picture 1.
The value area and maximum volume level do not coincide in different profile variants because the left profile takes time into account but doesn’t take volume, while the right profile takes volume into account but doesn’t take time. Both time and volume are very important from the trading point of view, that is why one profile supplements the other.
Profile types
ATAS allows combining the volume profile and TPO in one instrument. Moreover, the wide functionality of the platform allows traders to build a profile not only by volume but also by:
- delta,
- trades,
- time,
- bids and asks.
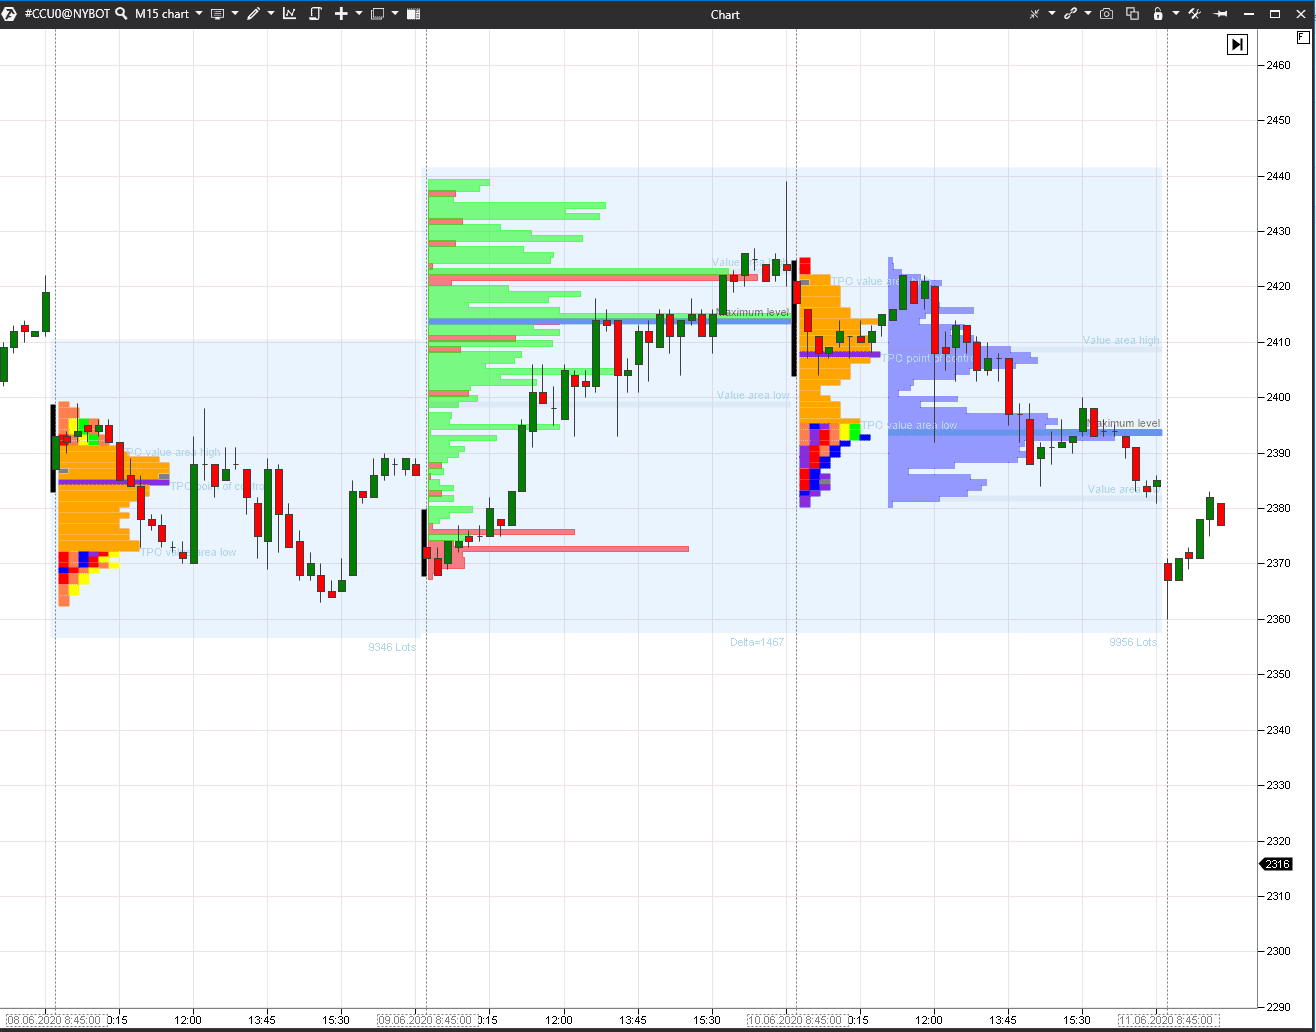
We added different profile types for different trading sessions to the next 15-minute cocoa futures (CC) chart. We used TPO for the first trading session, profile by delta for the second session and combined TPO and volume profile for the third one. See Picture 2.
We used just TPO and profile in this example instead of the fixed profile. This instrument could be applied to any period in the chart – it is in the upper menu.
The market profile provides a possibility to analyse different time-frames:
- daily,
- weekly,
- contract.
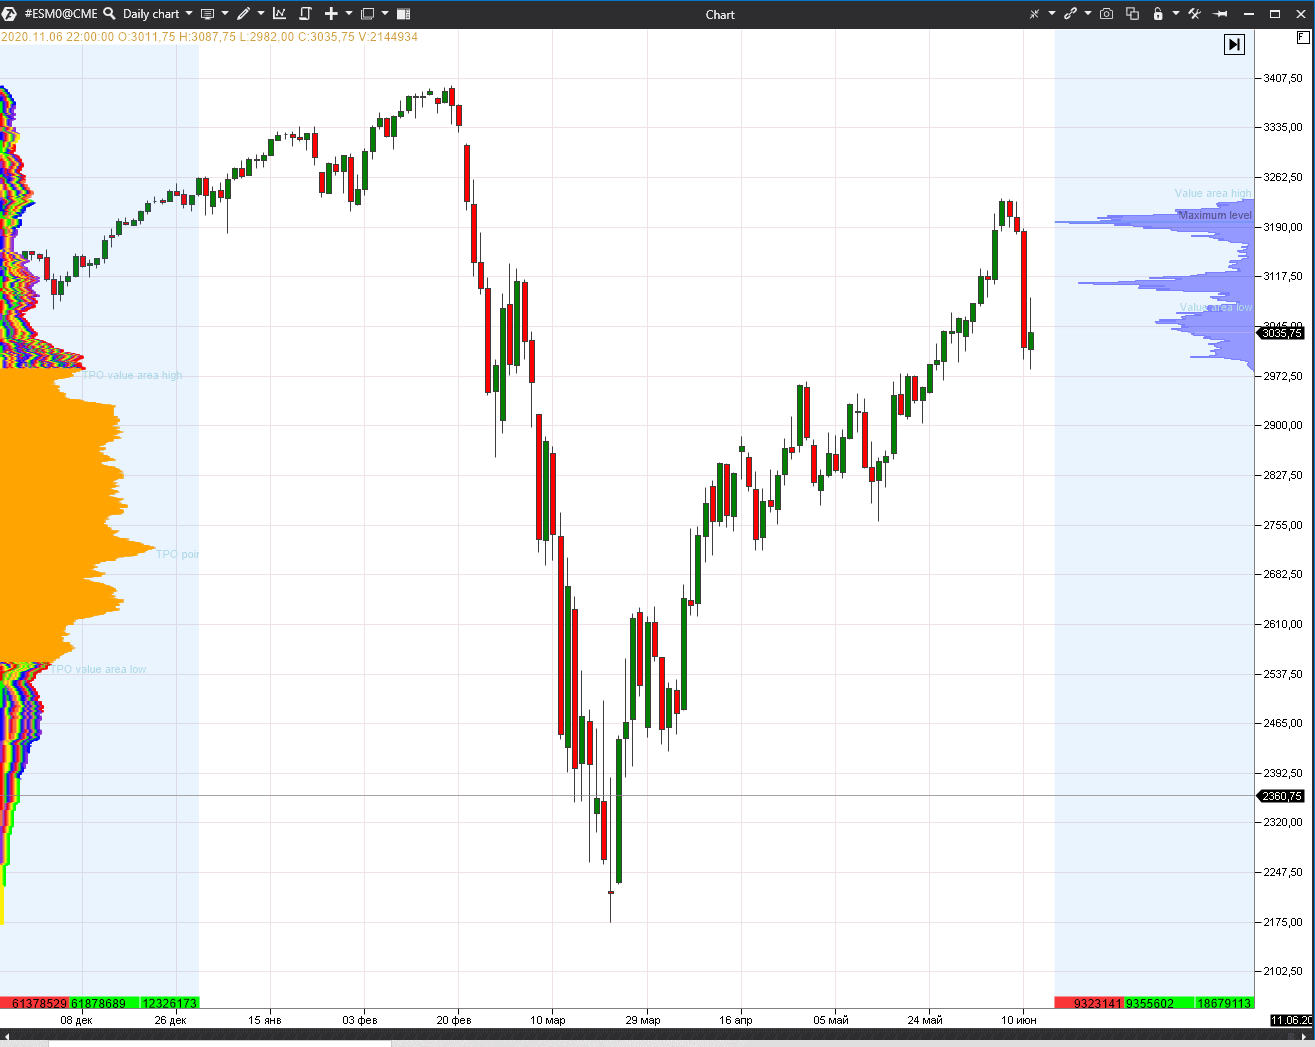
We added the contract TPO in the left side and volume profile of the current month in the right side to the daily E-mini S&P 500 futures chart. See Picture 3.
How to use the profile in trading by various trader types
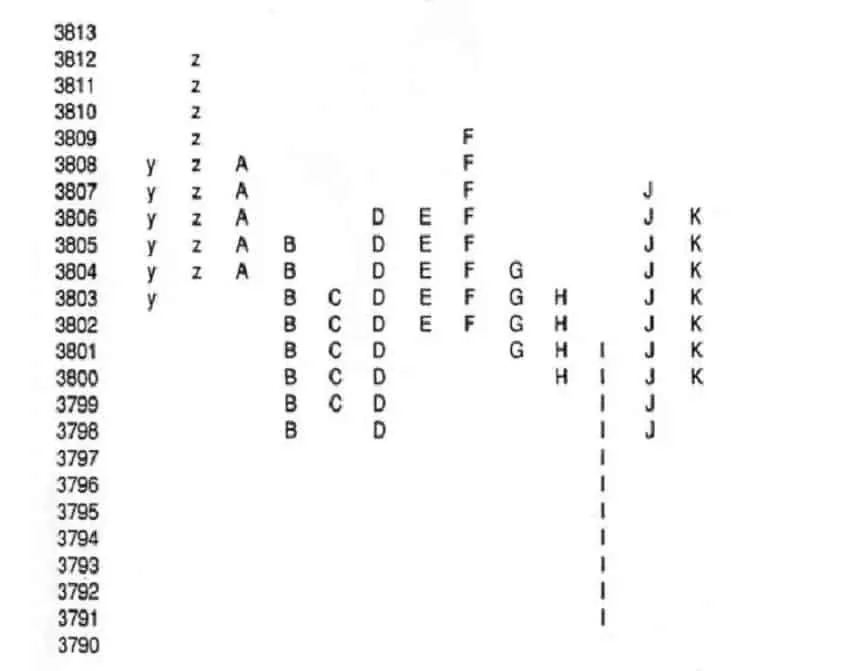
The profile is formed as a trading session develops, that is why it could be successfully used by both intraday and position traders. If it were possible to lay out individual letters and create the ‘running profile’, the day scheme could have been, for example, as in the chart below. See Picture 4.
It is a part of the gold futures profile as of May 2, 1989, from James Dalton book ‘Mind Over Markets’. It could be seen from this scheme that the prints gradually move down. There are tails in ‘Z’ and ‘I’ periods where the price tried to move higher and lower but failed. This information could be used in intraday trading.
How to trade using the profile
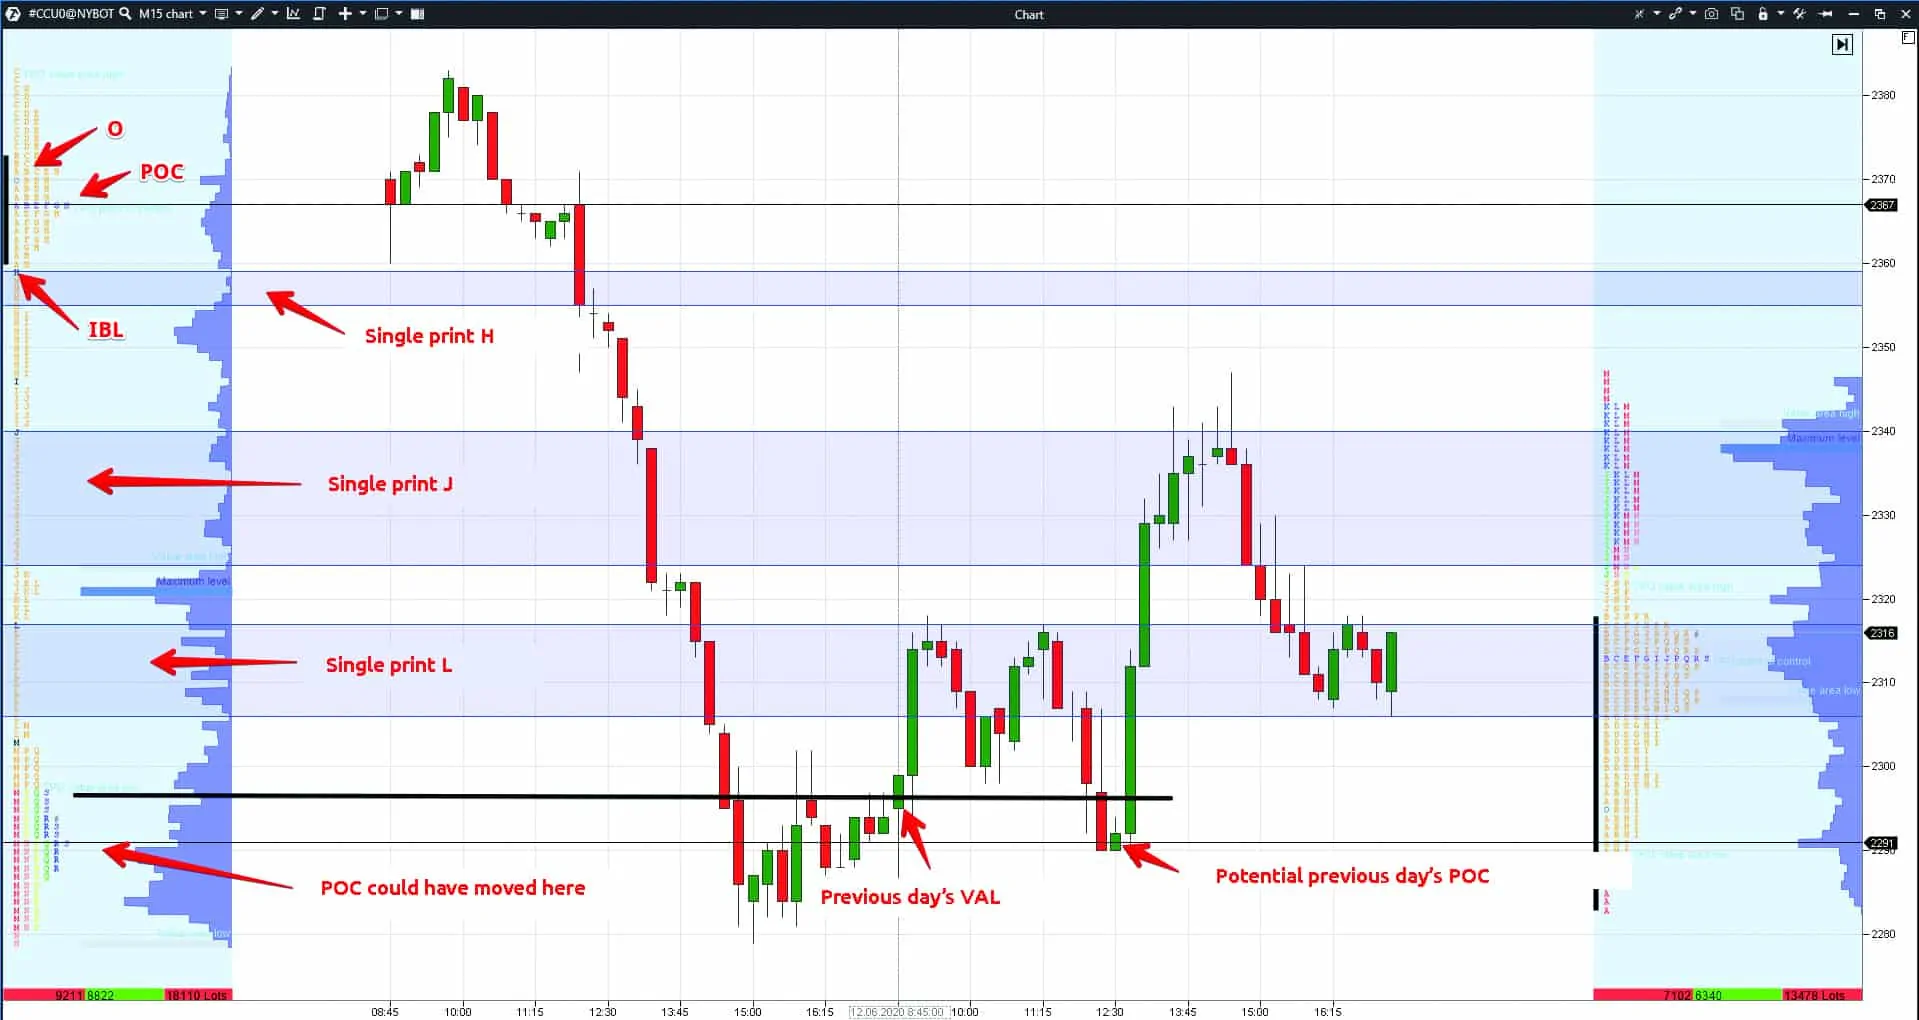
Let’s discuss how intraday traders could work with the market profile. Let’s analyse a situation through the example of the 15-minute cocoa futures (CC) chart. See Picture 5.
There are two trading sessions in the chart – June 11 and 12, 2020. The first day was clearly a trend day and now we will tell you how this could have been understood in the process of trading by TPO.
The first half an hour after the opening (letter ‘O’ in the profile) is a print, which is marked with the letter ‘A’. The price first moved down but closed higher and a tail appeared in the first candle. The price moved higher in ‘B’, ‘C’, ‘D’ and ‘E’ periods, but the high of each next print was below the high of the previous one. In other words, the price failed to move in ‘D’ period higher than in ‘C’ period, the price failed to move in ‘E’ period higher than in ‘D’ period and so on. In fact it means that buyers were losing their strength.
Overlapping of various period prints one over another is called rotations. Rotation could be upward, downward or coincide with the boundaries of the previous print.
If the print’s high and low are higher than the previous one, such a rotation has the value of +2. If the print’s high is higher than the previous one and the low is equal, such a rotation has the value of +1. If the calculation logic is not clear, you can read James Dalton’s book ‘Mind Over Markets’. Rotations mean the movement strength. They could be calculated during a trading session or based on the results of the whole day.
Maximum volume level is calculated in TPO by the biggest number of letters in one row. When prints are added at one price level, the number of letters in a row increases. POC moves during a trading session and its movements could be estimated by a number of letters. The price is ‘attracted’ to POC on the days of standard distribution.
The price moved below the POC level in our chart in ‘G’ and ‘H’ periods and tested the lower boundary of the initial balance. We want to remind you that the Initial Balance is the range where the price is traded during the first hour. If the initial balance is narrow, the probability of its breakout in one or both directions at the same time is high. Our initial balance was very narrow, that is why the breakout probability was very high when the price moved down to the lower boundary in the ‘H’ period.
The price sharply ‘ran’ down immediately after the breakout. The price failed to close the single print ‘H’ in period ‘I’ and was traded below.
The price failed to overpass the previous period in the next ‘J’ period and again sharply fell. One more single print appeared.
The price slowed down in period ‘K’ but failed to close the single print ‘J’ – it means that sellers were very strong. The further price decrease was to be expected. One more single print was formed in period ‘L’.
Single prints tell us that the market is unidirectional. These are the areas where the price doesn’t stay long. If they start to close, it means that the market situation changed. Single prints didn’t close in our example and their number increased – it is dangerous for the deposit to stay on the way of such strong sells.
The price slowed down at the end of the trading session and the ‘N’, ‘P’, ‘Q’ and ‘R’ prints became shorter. A balance was formed in the market in these periods because the profile shape in the lower part resembles a bell and prints are inserted in each other like nested dolls.
Despite the trend day of sells, the maximum volume level stays on top. If the trading session would have lasted for another half an hour, there would have been one more print and POC would have moved down, since the number of symbols in the lower part would have become one symbol bigger than in the upper part.
TPO number above POC shows the strength of sellers – there are 46 of them in the chart. TPO number below POC shows the strength of buyers – there are 192 of them in the chart. It is strange to see such a correlation on a trend day of sells, but remember that POC just lacked time to move.
The number of TPO could be calculated and POC movement direction could be forecasted during a trading session in order to understand who is stronger – sellers or buyers.
The TPO value area is marked orange. The next day, the market opens within the value area, tests the previous day’s low and closes above. There is a new single print, which shows the buyers’ strength. Single prints and the previous trading session levels slow down and reverse the price. These levels could be taken into account in your trading strategy and the number of profitable trades could be increased.
How to use the market profile in position trading
James Dalton also recommends position traders to work with the profile. A report could be drawn up based on the trading day results in order to analyse the price behaviour. See Picture 6.
Dalton provides a report, which consists of the following parts:
- Rotation factor. Each print extension from the high or low side results in +1 point. Each print contraction from the high or low side, compared to the previous print, results in -1 point. To calculate the daily rotation, you need to sum up all the print data. Each print could bring maximum +2 points and minimum -2 points. If print extreme points coincide, the resulting value is 0.
- Extension of the initial balance range from the buyer or seller side.
- Buy or sell tails.
- Overlapping of the value area compared to the previous day.
- Volume change.
- Value area width.
You may expect a certain price behaviour the next day based on these data. For example, a trend day of sells on the increased volume developed in the example provided. The value area was extended and moved below the previous day’s value area. The weak market could balance after such a day and it’s quite probable that the value area would move further down. Long-term sellers would hold short positions.
While conducting such an analysis, it is important not to take a certain position before trading starts, because a certain mood could interfere with seeing the whole picture in general.
Summary
The volume profile and TPO help to assess the market state without emotions and join the stronger participants. Standard software doesn’t include market profiles, which means that not everybody can see the situation clearly.
Use ATAS. Its advanced instruments for professional analysis will help you to act in harmony with the real market mood.
Information in this article cannot be perceived as a call for investing or buying/selling of any asset on the exchange. All situations, discussed in the article, are provided with the purpose of getting acquainted with the functionality and advantages of the ATAS platform.

