The Delta term was introduced into trading in 2002 when the revolutionary Footprint chart was developed. Overall distribution of information technologies and the Internet, which also affected the trading sphere, served as an impulse for it. Namely at that time access to the data about real trading volumes on the exchange ceased to be a privilege of a narrow circle of the market participants and VSA (Volume Spread Analysis) method gained widespread use in the community of retail traders.
As of today, a retail trader who analyzes, for example, Forex price quotes, can confirm his decisions by trading volumes of currency futures (EUR, GBP and others) through the use of the ATAS platform. The advanced, intuitively clear and, most important, accessible for everyone method of visualization of the order flow still continues to help retail traders to get to a new professional level.
In this article:
- Delta calculation.
- Footprint chart.
- Delta indicator.
- Cumulative Delta.
Delta calculation
Delta is the difference between the market buys and market sells at each price (Footprint Delta) in each candle/bar (Bar Delta) or for a period of time (Cumulative Delta).
Delta is calculated through subtraction of the volume of contracts traded at the Bid price from the volume of contracts traded at the Ask price. In the ATAS platform, the trades executed at the Ask price are those trades that were initiated by aggressive buyers. The trades executed at the Bid price are those trades that were initiated by aggressive sellers.
Thus, the positive Delta reflects a higher volume of aggressive buys at the Ask price in the result of trading of aggressive sellers. The negative Delta, in its turn, reflects a higher volume of aggressive sells at the Bid price in the result of trading of aggressive sellers.
Volume of trading at the Ask price – Volume of trading at the Bid price = Delta
To calculate Delta you will need to know the following variables: the Bid price, the Ask price, the most recent price at which the instrument was traded, the volume of the most recent trade and the time of its execution.
For example, imagine that at a certain moment of time the Bid price of a WTI Oil futures is USD 63.50 per barrel and the Ask price is USD 63.51 and a trade for 25 contracts is executed at the Ask price. The Delta value increased by 25 in the result of this trade. Immediately after that the second trade for 10 contracts is executed in the market – this time at the Bid price (USD 63.50). This would result in the Delta decrease by 10. The general change of the Delta after execution of these two trades would be +25-10=+15.
Please, remember that the Delta is calculated as the difference between the volumes of market buys and market sells. It follows from here that the above example assumes that the first 25 contracts were bought by the market order at the price of USD 63.51 and the second 10 contracts were sold by the market order at the price of USD 63.50.
The Delta calculation by market, or as they say aggressive, orders is explained by the fact that namely market orders move the price in the market. If we go deeper into the subject, there is no need to take into account volumes of limit orders for Delta calculation, since, to execute a trade, a market order for buying 25 contracts would need limit order(s) for selling 25 contracts and it makes no sense to duplicate these volumes in the Delta values.
If it seems a bit difficult for you, do not worry. You can study this issue deeper by reading our Market mechanics: What a novice should know about reduction of orders article, in which this aspect of trading is considered in detail.
Footprint chart
The Footprint chart reflects the positive and negative Delta values inside each candle as it can be seen in Chart 1. A Footprint cell with a positive Delta is coloured green and characterises a positive order flow, in the result of which buyers were more aggressive at a specific price level. A Footprint cell with a negative Delta is coloured red and characterises a negative order flow, in the result of which sellers were more aggressive at a specific price level.
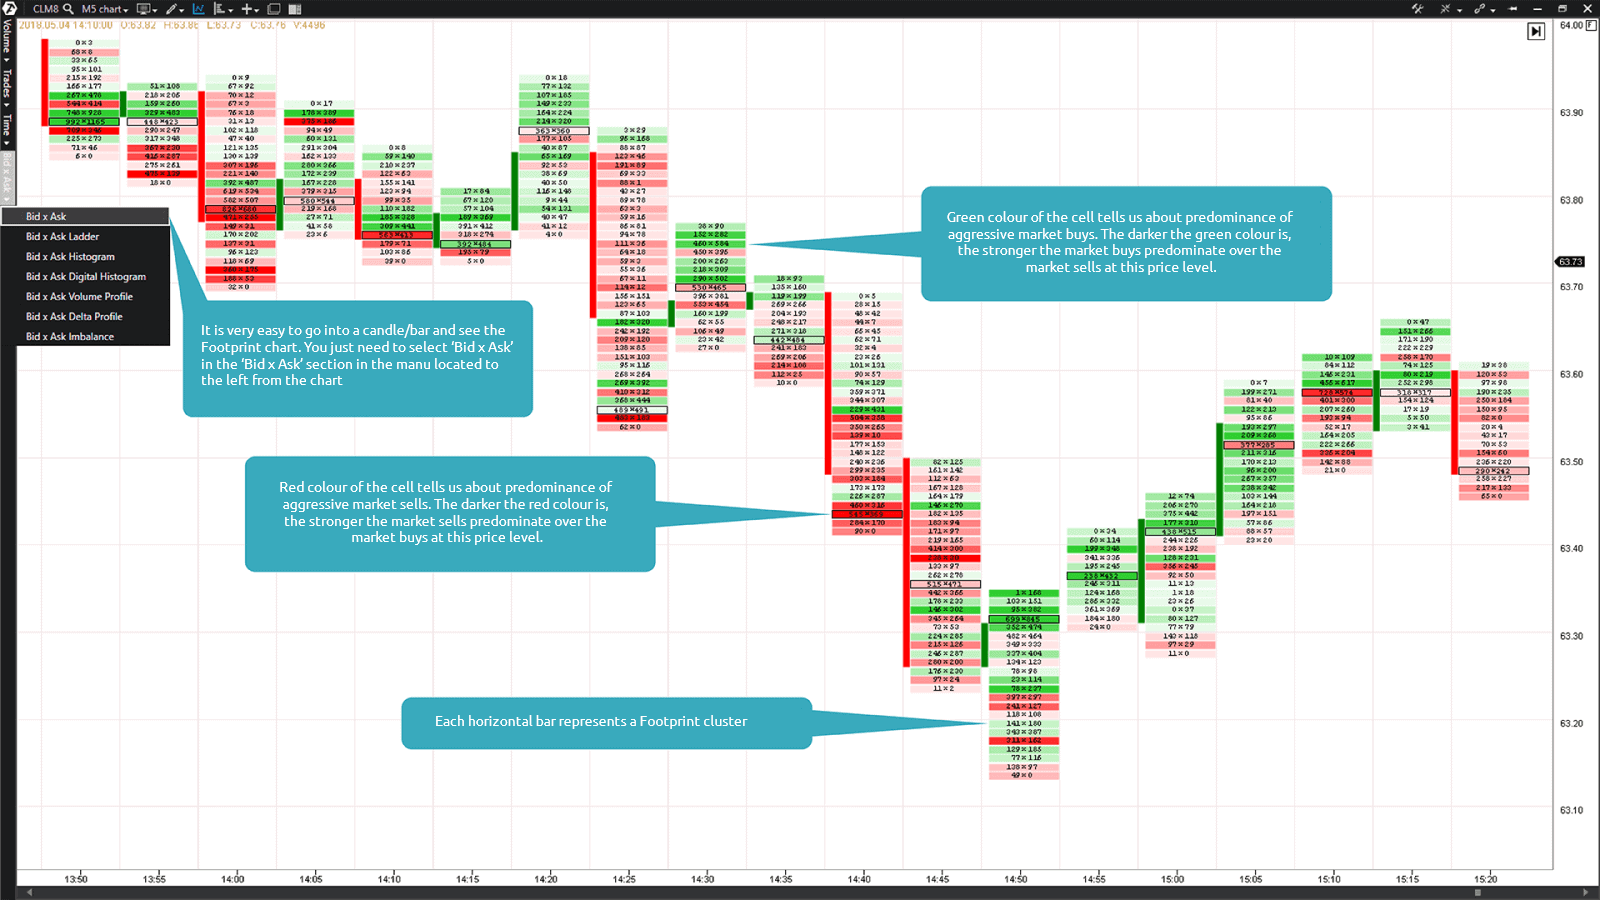
There is a high degree of correlation in the market between the price movement direction and the order flow. Namely for this reason the Footprint chart of the ATAS platform can become a valuable instrument of analysis of the current market situation for perceptive traders.
Delta indicator
This indicator shows the total Delta value for each candle in the form of a vertical bar chart in the lower part of the chart, moreover, it is not important what type of a chart (frame) you use.
The Delta indicator bars could be both positive and negative. The positive Delta is marked with green bars and is typical for the positive order flow, in the result of which buyers were more aggressive in a specific candle. The negative Delta is marked by red bars and is typical for the negative order flow, in the result of which sellers were more aggressive in a specific candle.
One of the advantages of the Delta indicator bars of the ATAS platform is that they allow a trader to switch attention from the analysis of the Footprint chart candles, inside which the Delta is distributed by price, to the total order flow of these candles. We can find a good use for it through comparing the colour of the Delta indicator bar with the Footprint chart candle direction and find inconsistencies. Perhaps, you might have a question – can a growing bullish candle have a negative Delta and vice versa – can a falling bearish candle have a positive Delta? Yes, it is possible and is quite frequent.
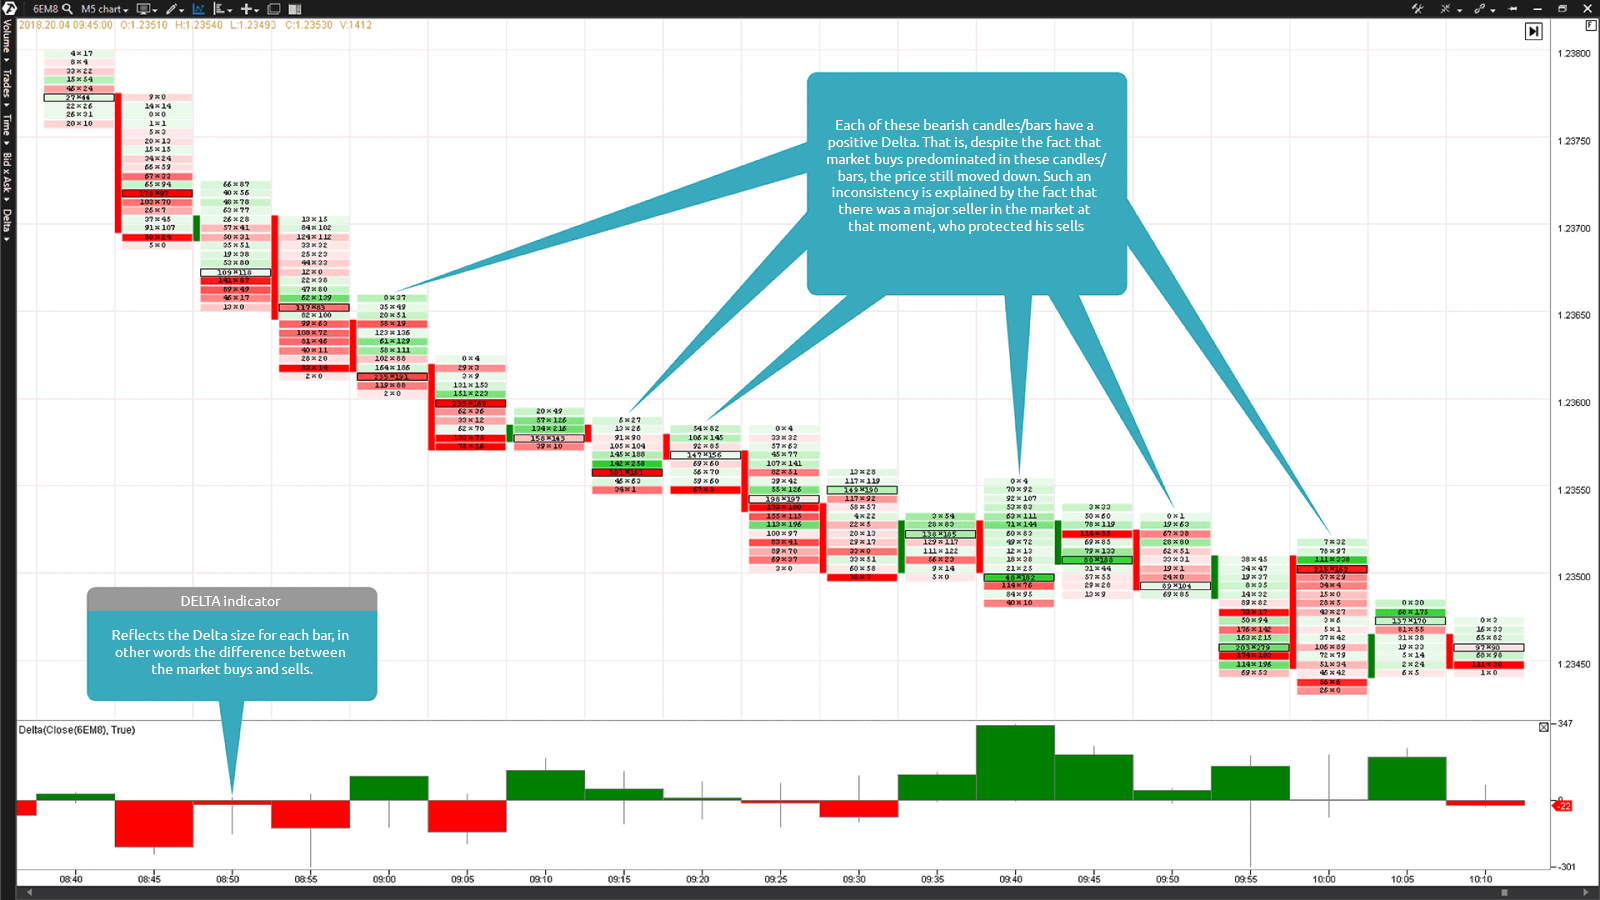
Chart 2. 5-minute timeframe of a EUR futures (ticker: 6E). The Bid x Ask Footprint chart and Delta indicator in the lower part of the chart.
Note that some bearish candles have a positive green Delta in Chart 2. That is, despite the fact that market sells predominated in these candles, the price still went down. Such an inconsistency is explained by the fact that a major seller, who opened his market sells and protected them by sell limit orders, was present in the market at that moment.
In the result of these actions, all buys, which took place at that time on behalf of aggressive buyers, who tried to resist the downward price movement, were executed on protective limit orders of the major seller. Acting in such a manner, the major seller didn’t have to open big market sell trades in order to push the price in the profitable direction.
His sells were opened, to a significant degree, on protective limit orders, which completely absorbed all market buys. It should be noted that the price continued to go down also because the buyers, in their turn, didn’t try to protect their market buys by the buy limit orders or posted them in an insufficient amount for controlling sellers.
If you find detection of such inconsistencies in the general flow of market information difficult, the ATAS platform will be able to maximally simplify this task. Chart 3 of an E-mini S&P 500 futures shows how the Delta indicator values are built with the use of two filters: the bar direction is bearish and the Delta type is positive.
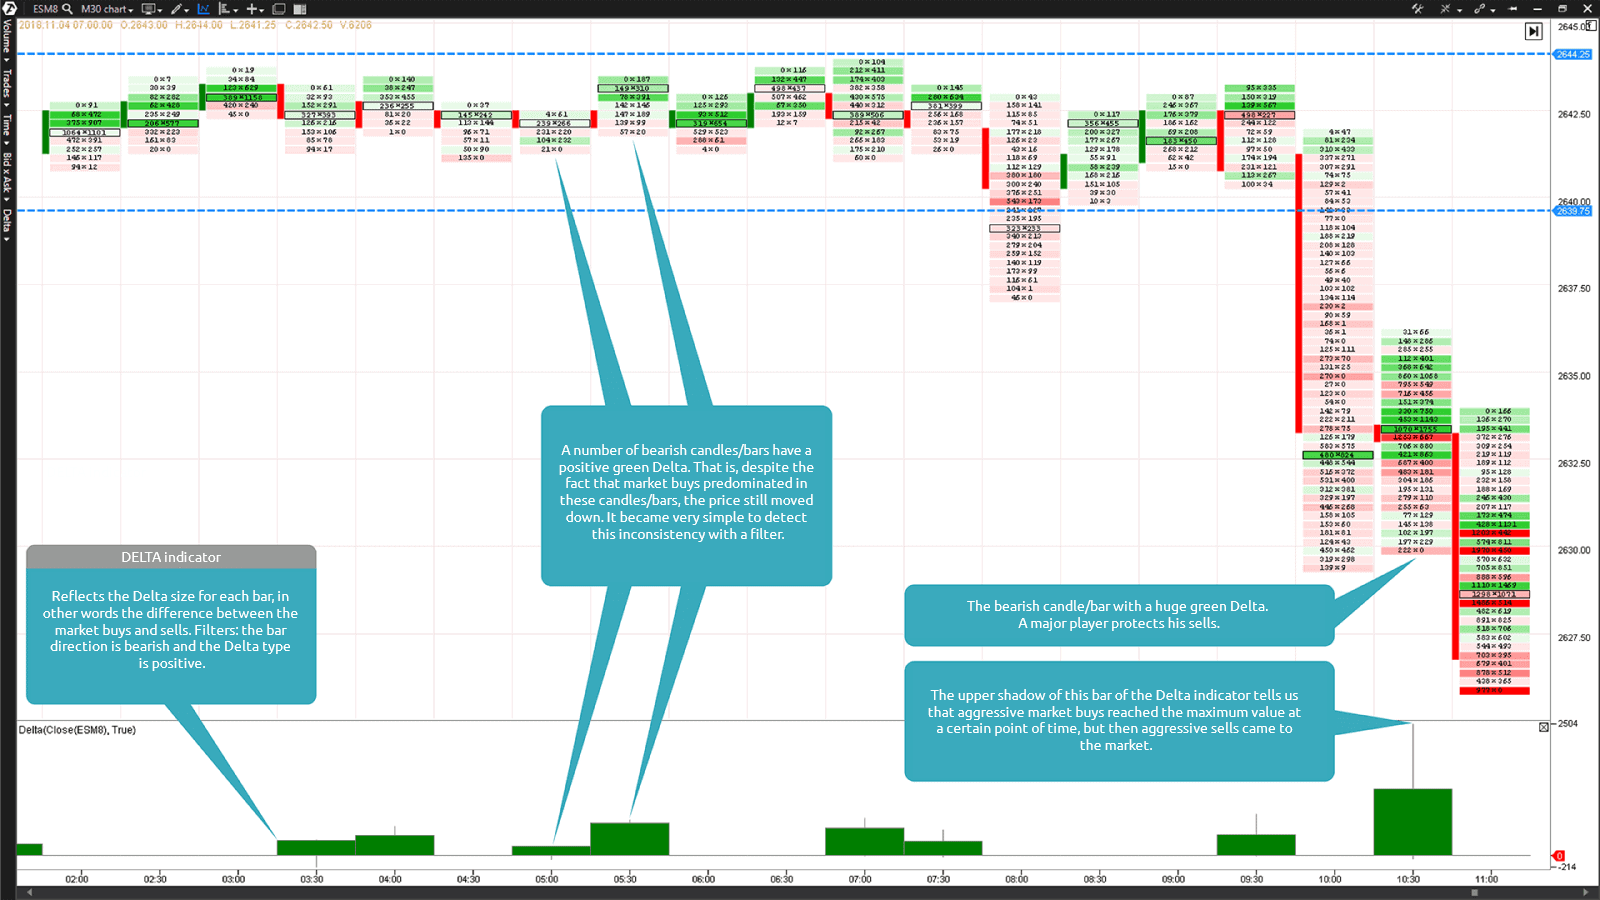
The Chart 3 example clearly demonstrates activity of a major seller during the market consolidation within the range of prices from 2,639.75 to 2,644.25 and the Delta indicator, due to the filters, significantly simplifies detection of inconsistencies.
In this example, the major player didn’t let aggressive buyers above the level of 2,644.25, holding them with his sell limit orders. A number of bearish candles with a positive Delta tell us about it. All market buys were absorbed by limit orders located at the upper boundary of the consolidation.
When you observe such situations in the market, remember that they often testify to the presence of a major institutional player. As you may already know from our previous articles, only a major player, unlike retail traders, possesses sufficient financial resources for protecting his open positions. These two examples already demonstrate a huge advantage of trading with the use of advanced instruments of the order flow analysis of the ATAS platform.
Cumulative delta
Cumulative Delta is the Delta which was accumulated during a certain period of time. If a standard Delta, which we considered above, shows the difference between market buys and sells for each candle/bar, the Cumulative Delta reflects the whole dynamics of the balance of market buys and sells starting from a certain moment of time (from the beginning of a trading session or contract).
Thus, the Cumulative Delta allows seeing a wider Delta picture, since it can cover a trading session or a whole day. That is why it makes no difference what frame or period you use for building a chart. The Cumulative Delta indicator of the ATAS platform computes the accumulated Delta and shows its current total value in the lower part of the chart.
Apart from that, the Cumulative Delta value, as well as other Delta numeric values, can be shown in the chart with the help of the Cluster Statistic indicator. This indicator will show the Cumulative Delta values in the Session Delta line.
The Cumulative Delta can be both positive and negative. A positive Cumulative Delta is coloured green and characterizes a positive order flow during a trading session as a result of more aggressive behaviour of buyers. A negative Cumulative Delta is coloured red and characterizes a negative order flow during a trading session as a result of more aggressive behaviour of sellers.
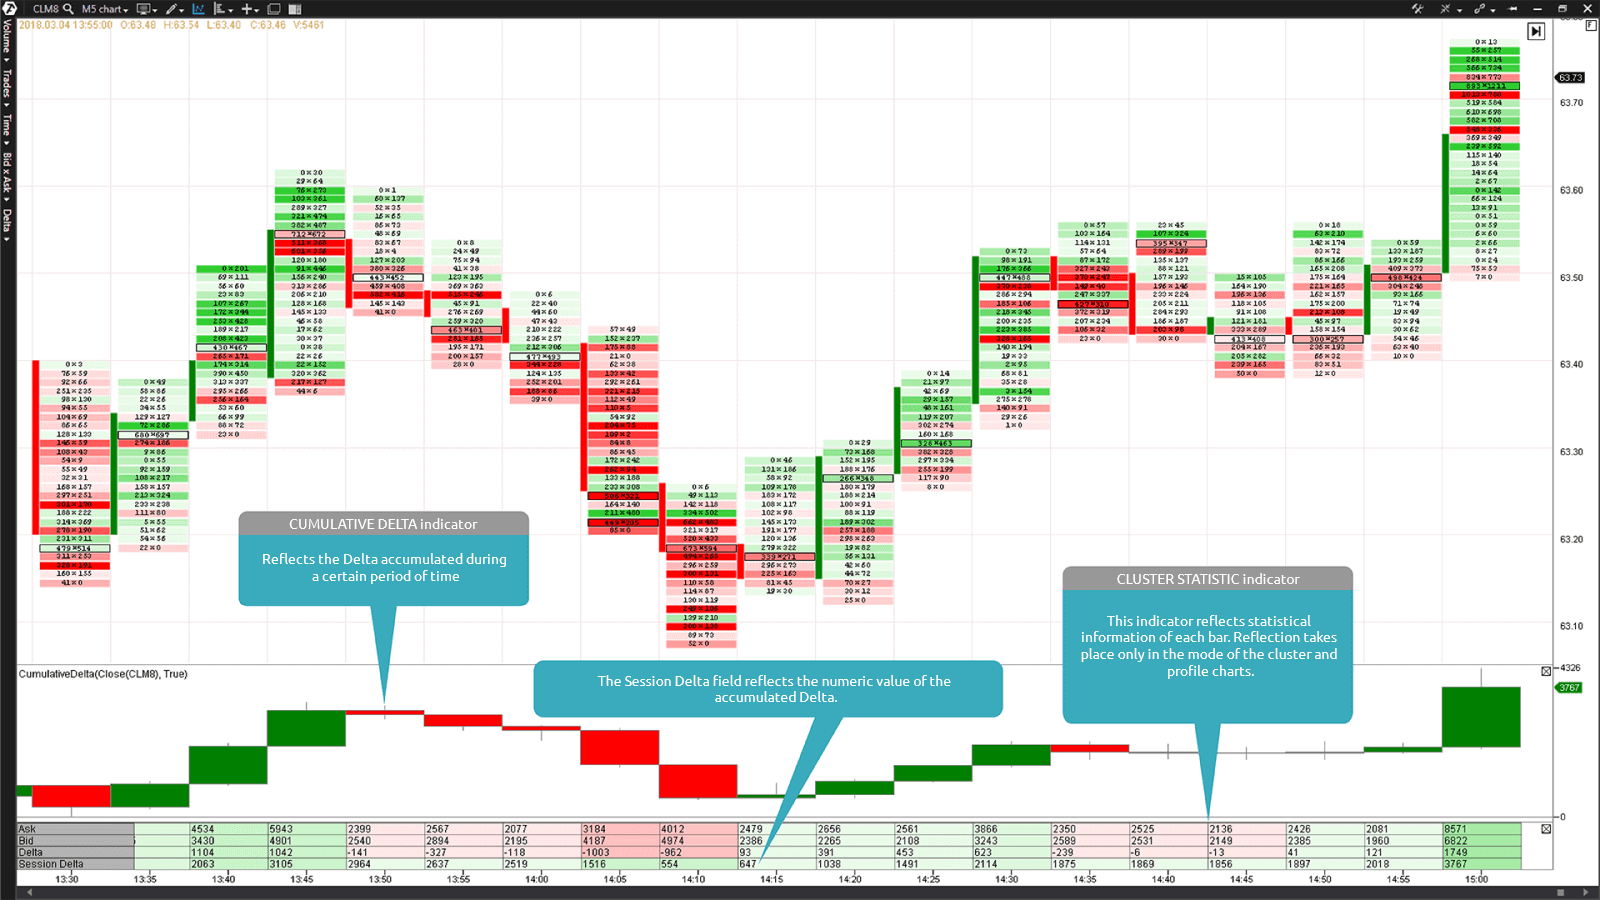
Chart 4. 5-minute timeframe of a Light Sweet Crude Oil futures (ticker: CL). The Bid x Ask Footprint chart and Cumulative Delta and Cluster Statistic indicators in the lower part of the chart.
One of the strategies of application of the Cumulative Delta lies in its use for identification of the trade execution direction. If the Cumulative Delta is positive, it tells us about domination of aggressive buyers during a trading session. And vice versa, if the Cumulative Delta is negative, it means that aggressive sellers dominate during a trading session. It is a very useful analytical tool for confirmation of the price movement direction.
It should be noted in the end that the Delta, despite all its strengths, should be used only in combination with other trading elements of your trading strategy.