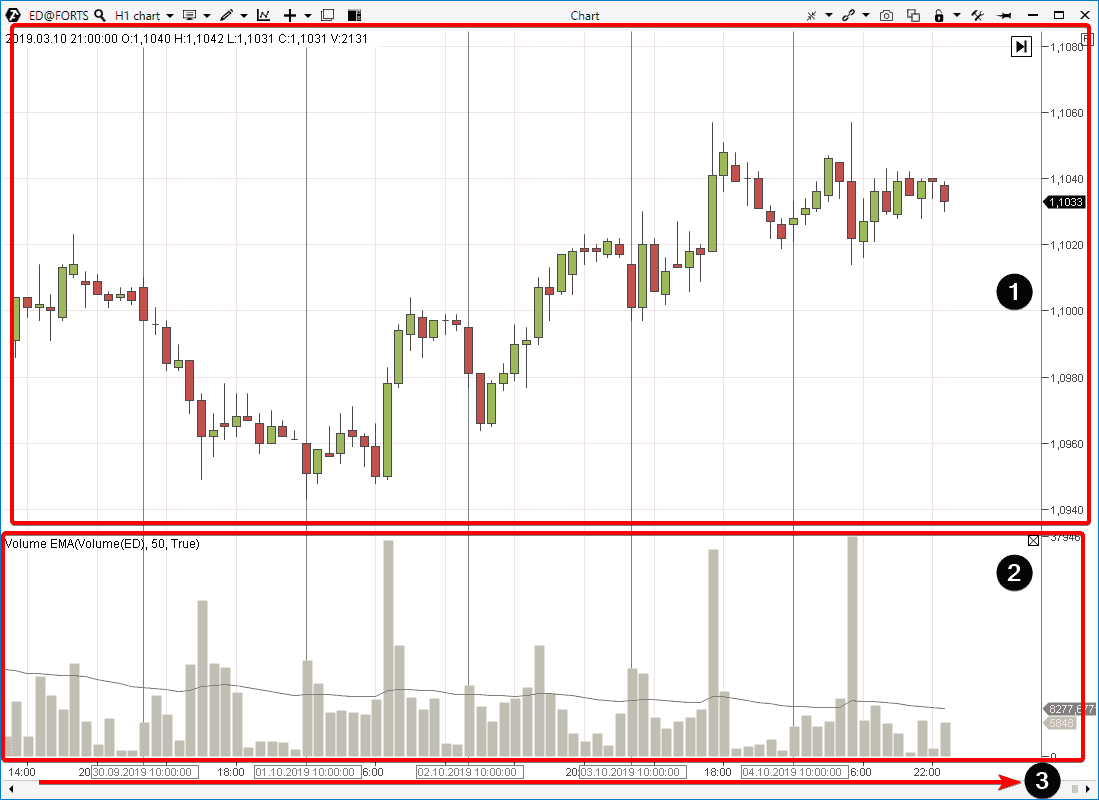
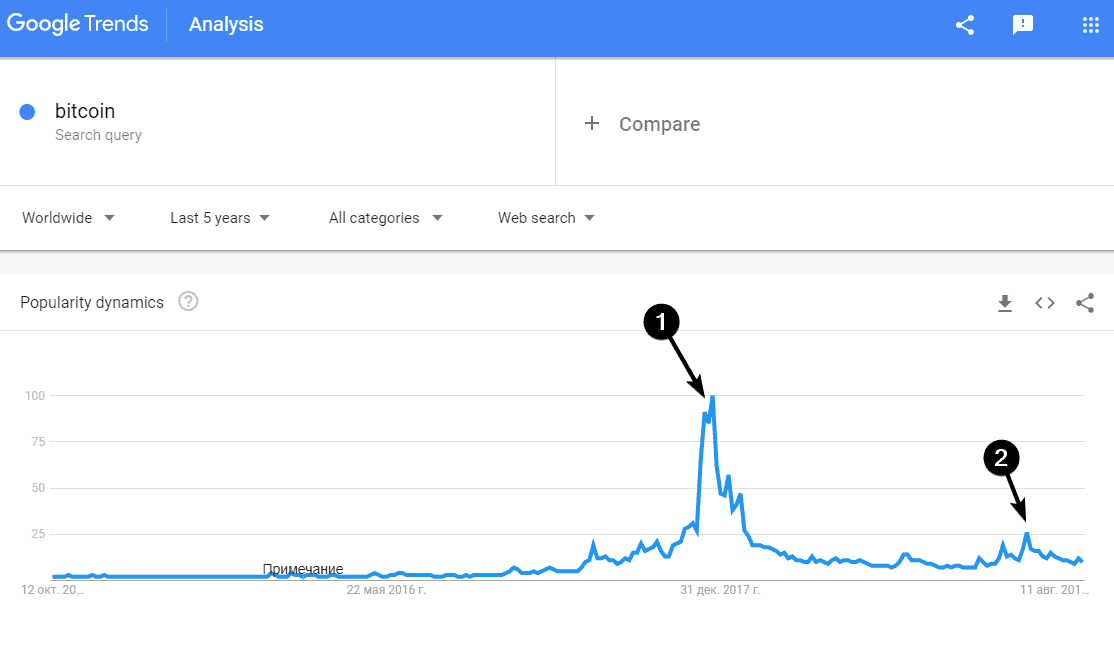
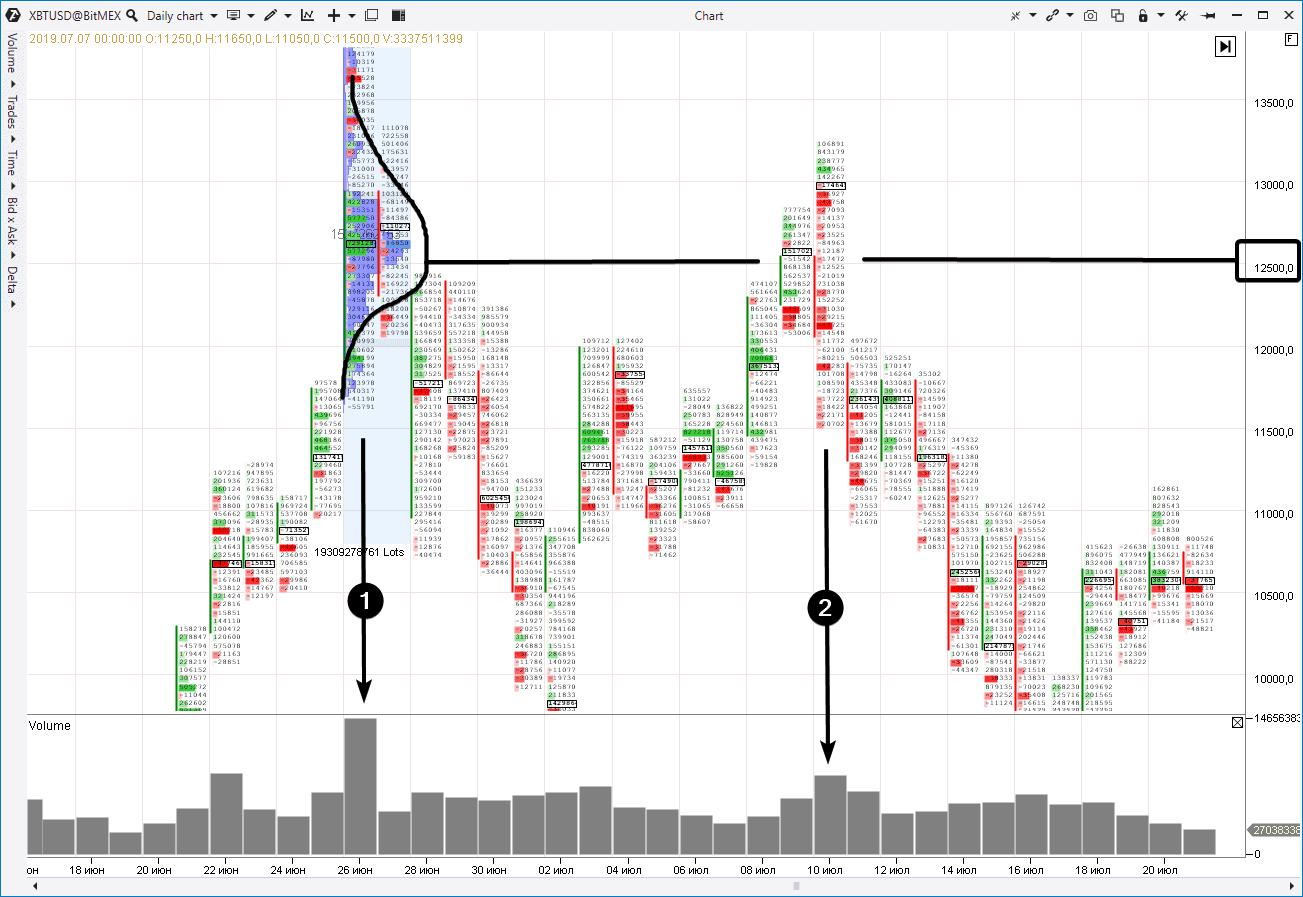
The idea of the trading volume analysis is reduced to the search for the most probable answers to the following questions:
- Why did the price move up (down) and the volume increased (decreased)?
- How much did the volume increased (decreased) when the price went up (down)?
- Why does the volume increase and the price doesn’t move?
- How did the delta (the difference between buys and sells) change?
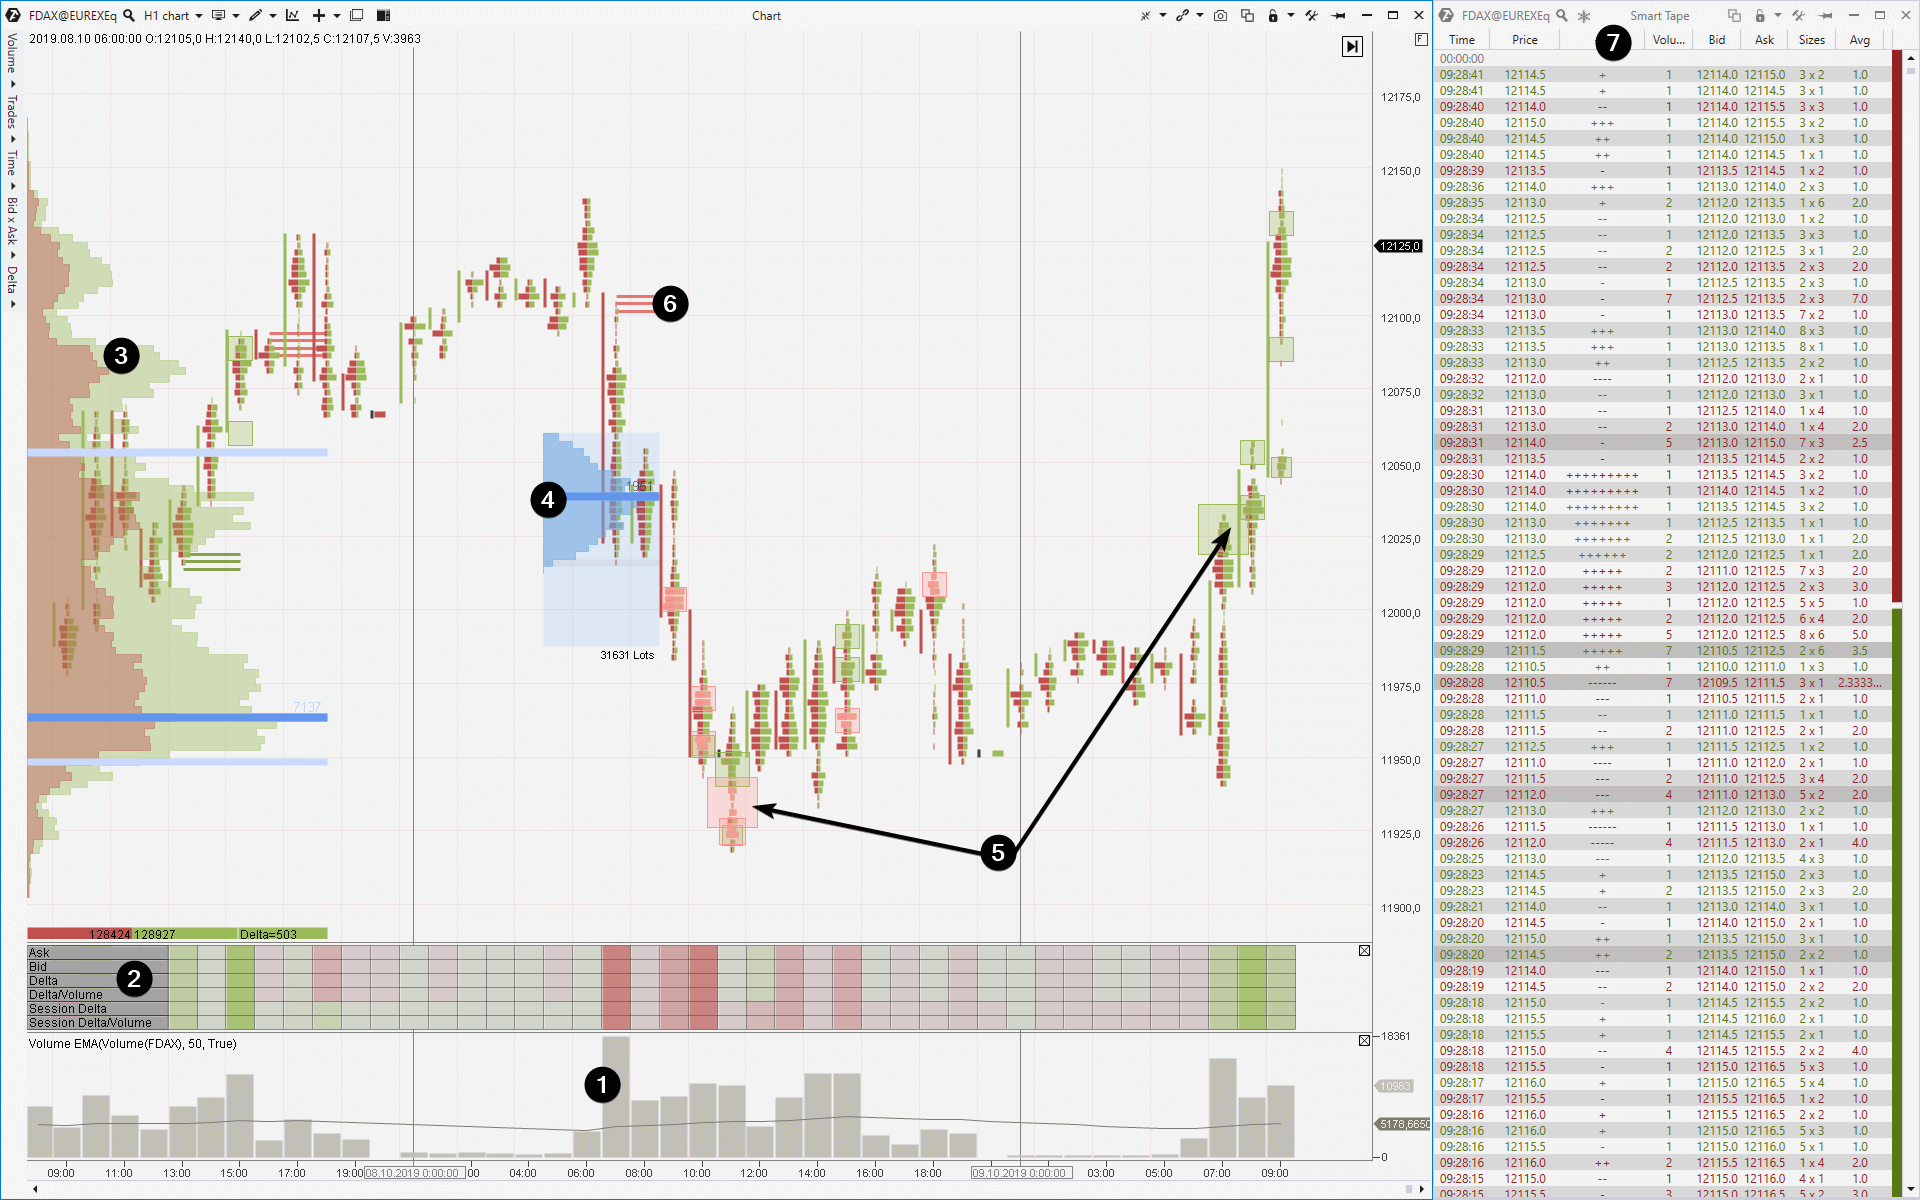
- How did the price behave when an abnormal volume emerged?
- What happened after an abnormal volume emerged?
- and so on.
Thus, analyzing the volume and its interrelations with the price, a trader forms his own opinion about the change of the demand and supply balance. Figuratively speaking, he ‘reads’ the dynamics of confrontation between buyers and sellers from the chart in real time.
Consequently, well founded trading ideas are developed.
For example:
- The price grows slowly on falling volumes to the resistance level. The strength of buys is exhausted. It is a deficit of demand. A signal for selling since the current price is, most probably, higher than the fair one.
- The price falls slowly on falling volumes to the support level. The pressure of sells ‘dries out’. It is a deficit of supply. A signal for buying since the current price is, most probably, lower than the fair one.
- The price refuses to grow despite a big volume of buys. It means that a major player sells out the asset using sell limit orders. It is a signal for selling.
Here we touch the subject of the market rationality. Followers of this theory believe that the current price is always fair and the market automatically takes into account all factors of influence on the price.
However…
The Wall Street business is financing corporations and selling securities. The public has a comparatively weak understanding of their real value.
Richard Wyckoff
The market prices are formed in the minds of human beings and Errare humanum est (everyone makes mistakes). You will be able to understand that the price is far from being fair in the pivot extreme points if you study price and volume charts, especially the moments of buying and selling climax patterns.

