
Why are oil prices negative?

Dear friends! A historic event took place on April 20 – the May WTI oil futures traded at negative prices, reaching the level of minus USD 40. Yes! The oil price was MINUS FORTY dollars.
Buying oil at such a price in real life would mean that you receive money for taking oil from the seller. If you have difficulties in trying to imagine such a situation, we will give you an analogy. It is a usual practice in developed countries that if a person wants to get rid of an old car, he has to pay for the car to be taken away. It means that, in the moment, the oil value is equal to the value of an old car, which is taken away for disposal.
We will analyze in this article what happened to the May futures on CME with the help of the volume analysis instruments of the ATAS platform.
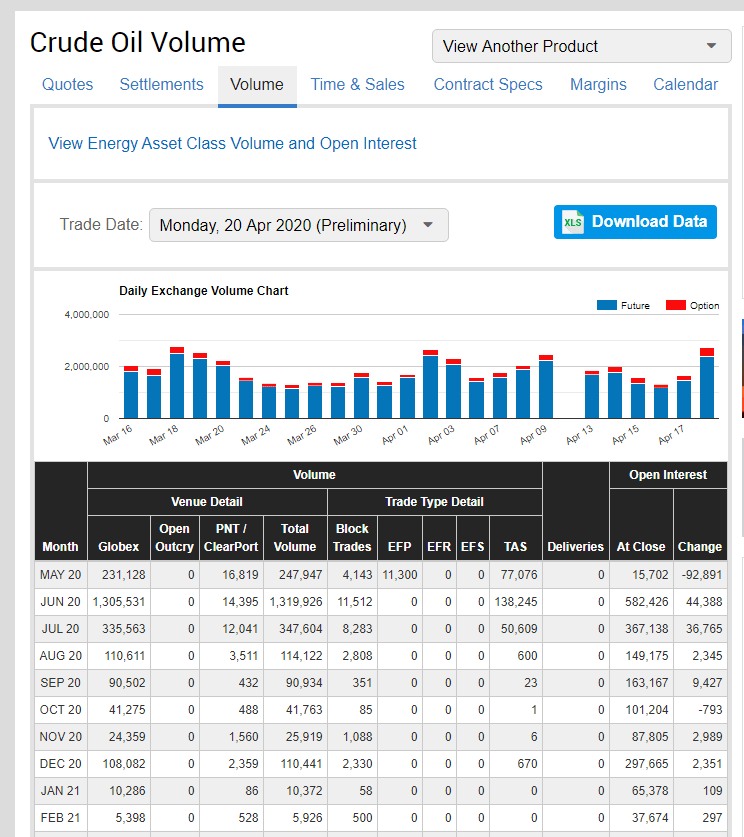
Let’s visit the CME Group web-site and check specifications of oil with CL ticker. First, we should say that most of the oil traders started to trade the June contract on Friday – April 17. We can see it from the traded volumes of the June contract. In other words, those traders could have suffered who had chased after the easy money. They should have realized the risks of trading a non-liquid instrument one day before its expiration.
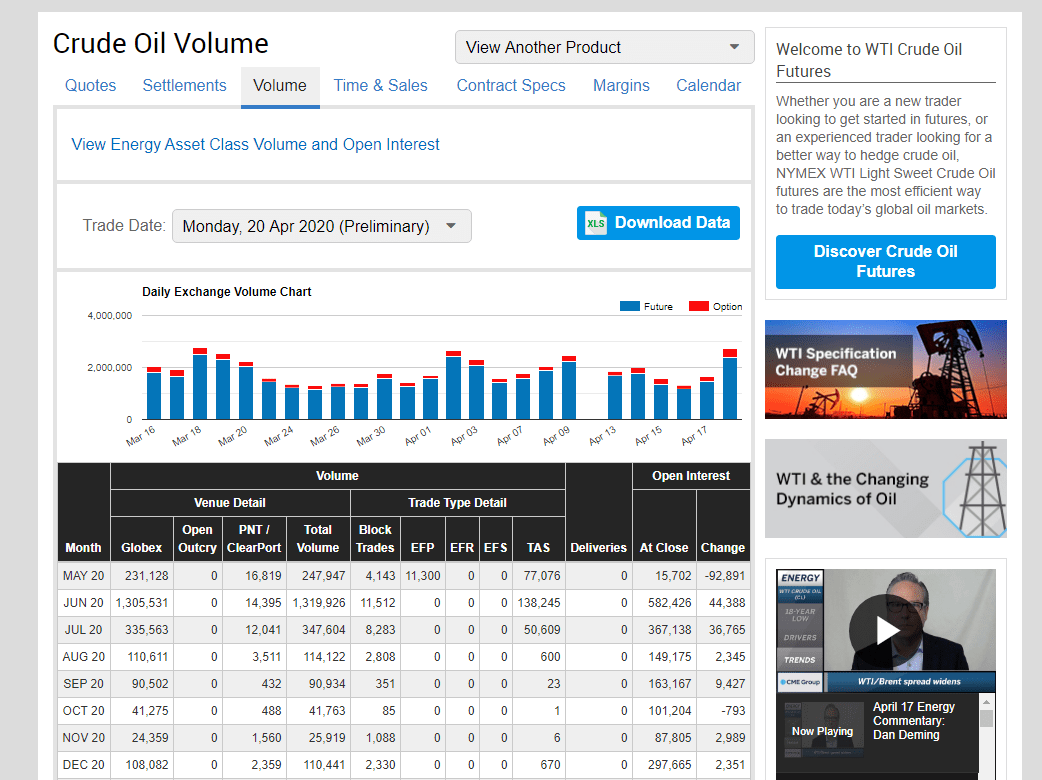
If you trade oil futures, you know the unspoken rule – stop trading the contract at least 2 days before its expiration date.
The charts below show the most recent 4 contracts before the May one. Analysis of volumes confirms this rule. Trading risks sharply increase and movements could be unpredictable. You can use the Continuous contract in ATAS for the automatic transition of the chart to the most liquid contract. Those, who traded oil in ATAS, most probably, traded the June contract, which didn’t show anything extraordinary.
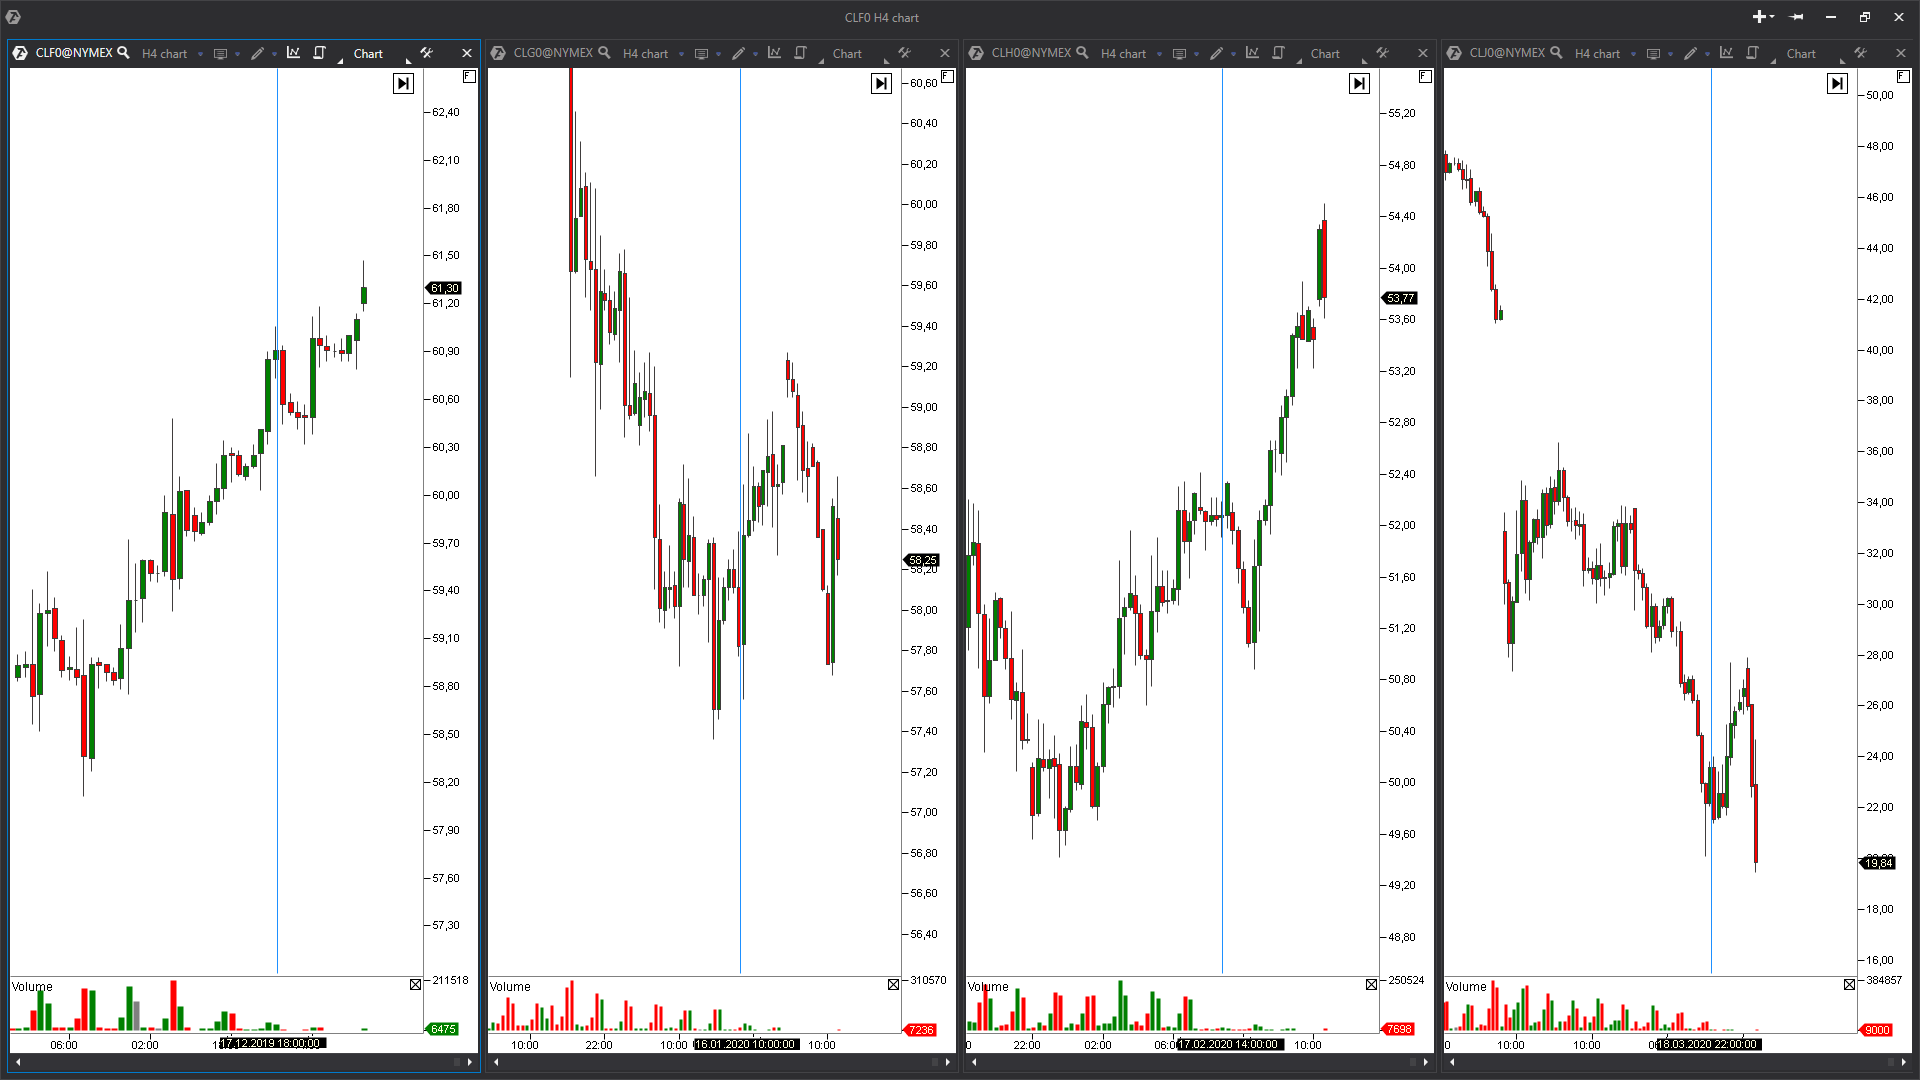
As you can see, impulse movements take place on futures during the last days before the expiration. The same situation, but on an astronomical scale, took place on the May contract.
One more important thing. CL futures on CME is not a delivery contract, which means that buys at negative prices didn’t guarantee payments from the seller to buyers. We can speak here only about the registered profit or loss in USD.
Such a situation resulted in a halt of the WTI oil trades on the Moscow Exchange. The Moscow Exchange informed their customers about it on its web-site.
Let’s see what happened in reality at the moment when the price moved below the USD 0 level. To do it, we would need the footprint chart and visualization of the Cumulative Trades Smart Tape.
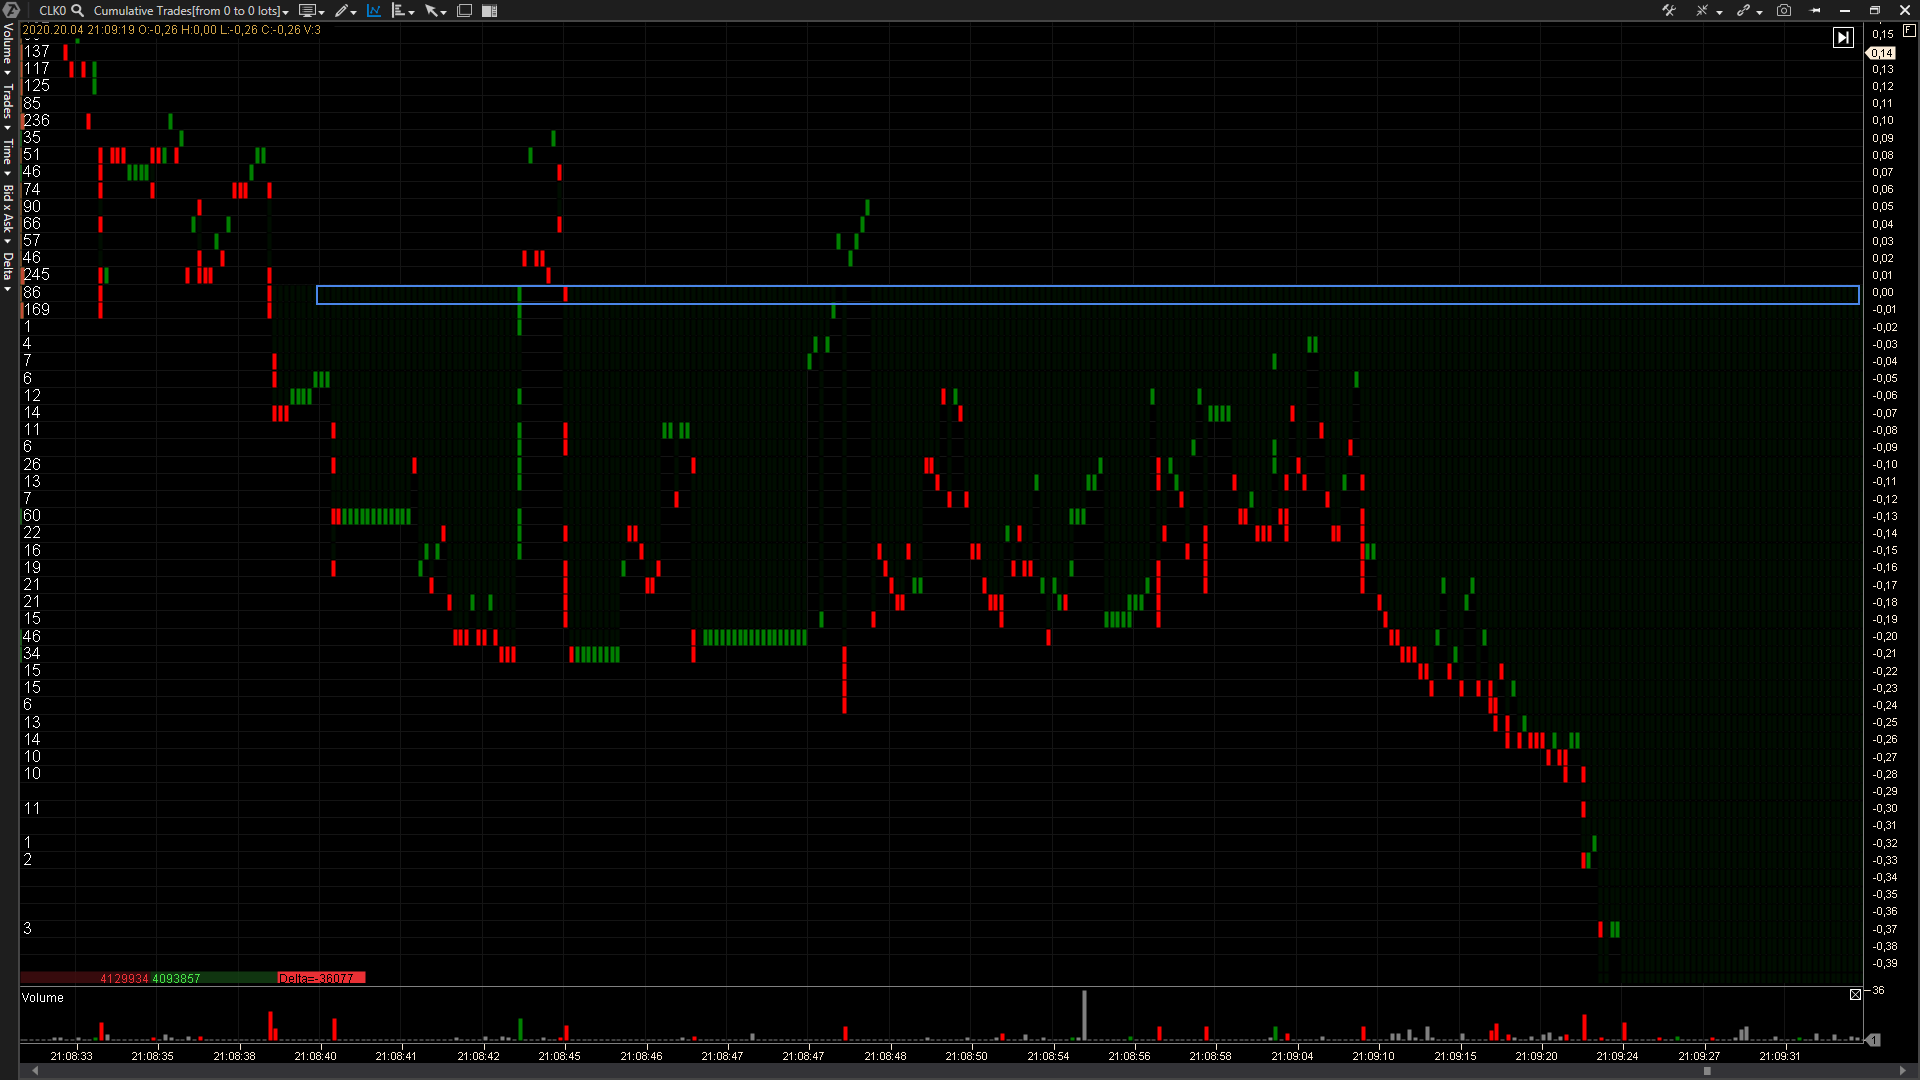
Footprint in the BidAsk Ladder mode is loaded in the M15 chart. The chart scale of 60 ticks is also set in the chart, so that we could see all clusters in one chart.
We see a significant predominance of the market sell orders when approaching the zero price. However, the price moved relatively slowly during, minimum, an hour and a half. It means that there was no single very big market order, which would have reached negative values very quick within the limits of low liquidity in the order book.
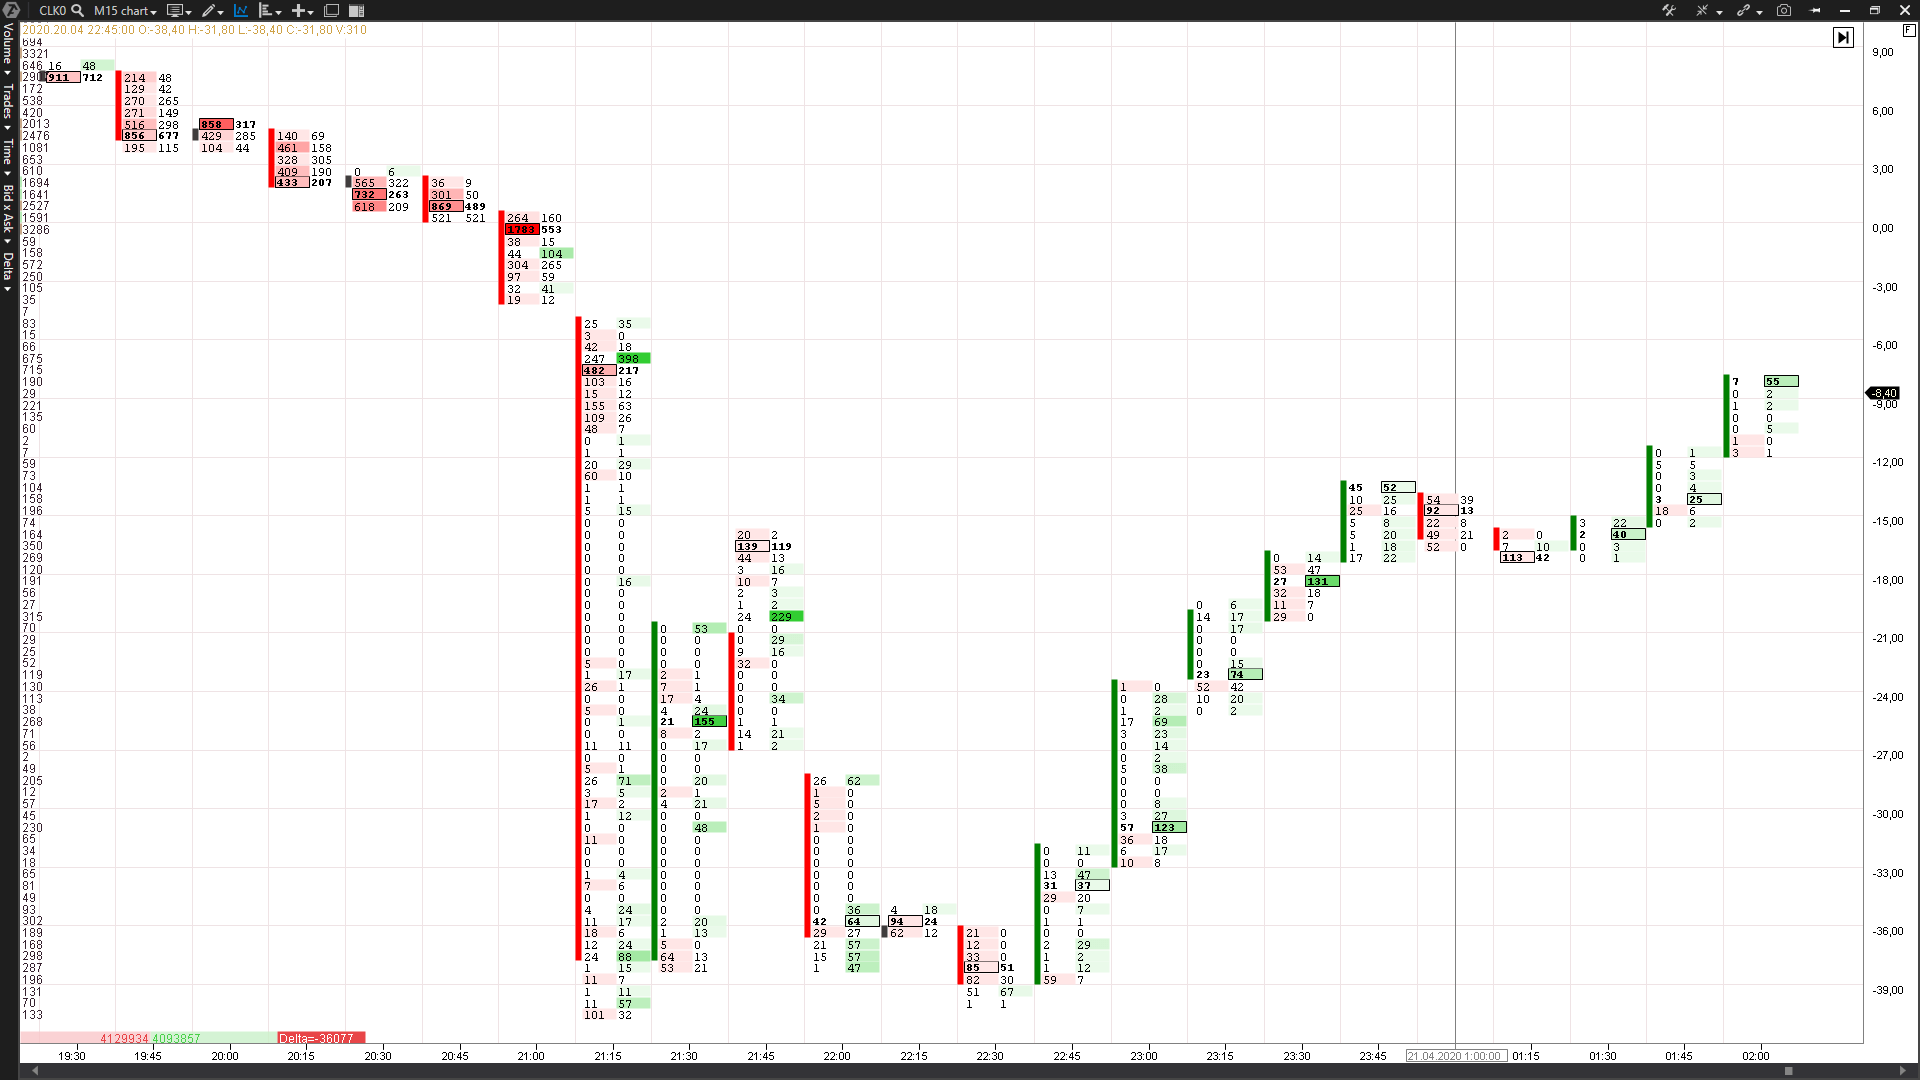
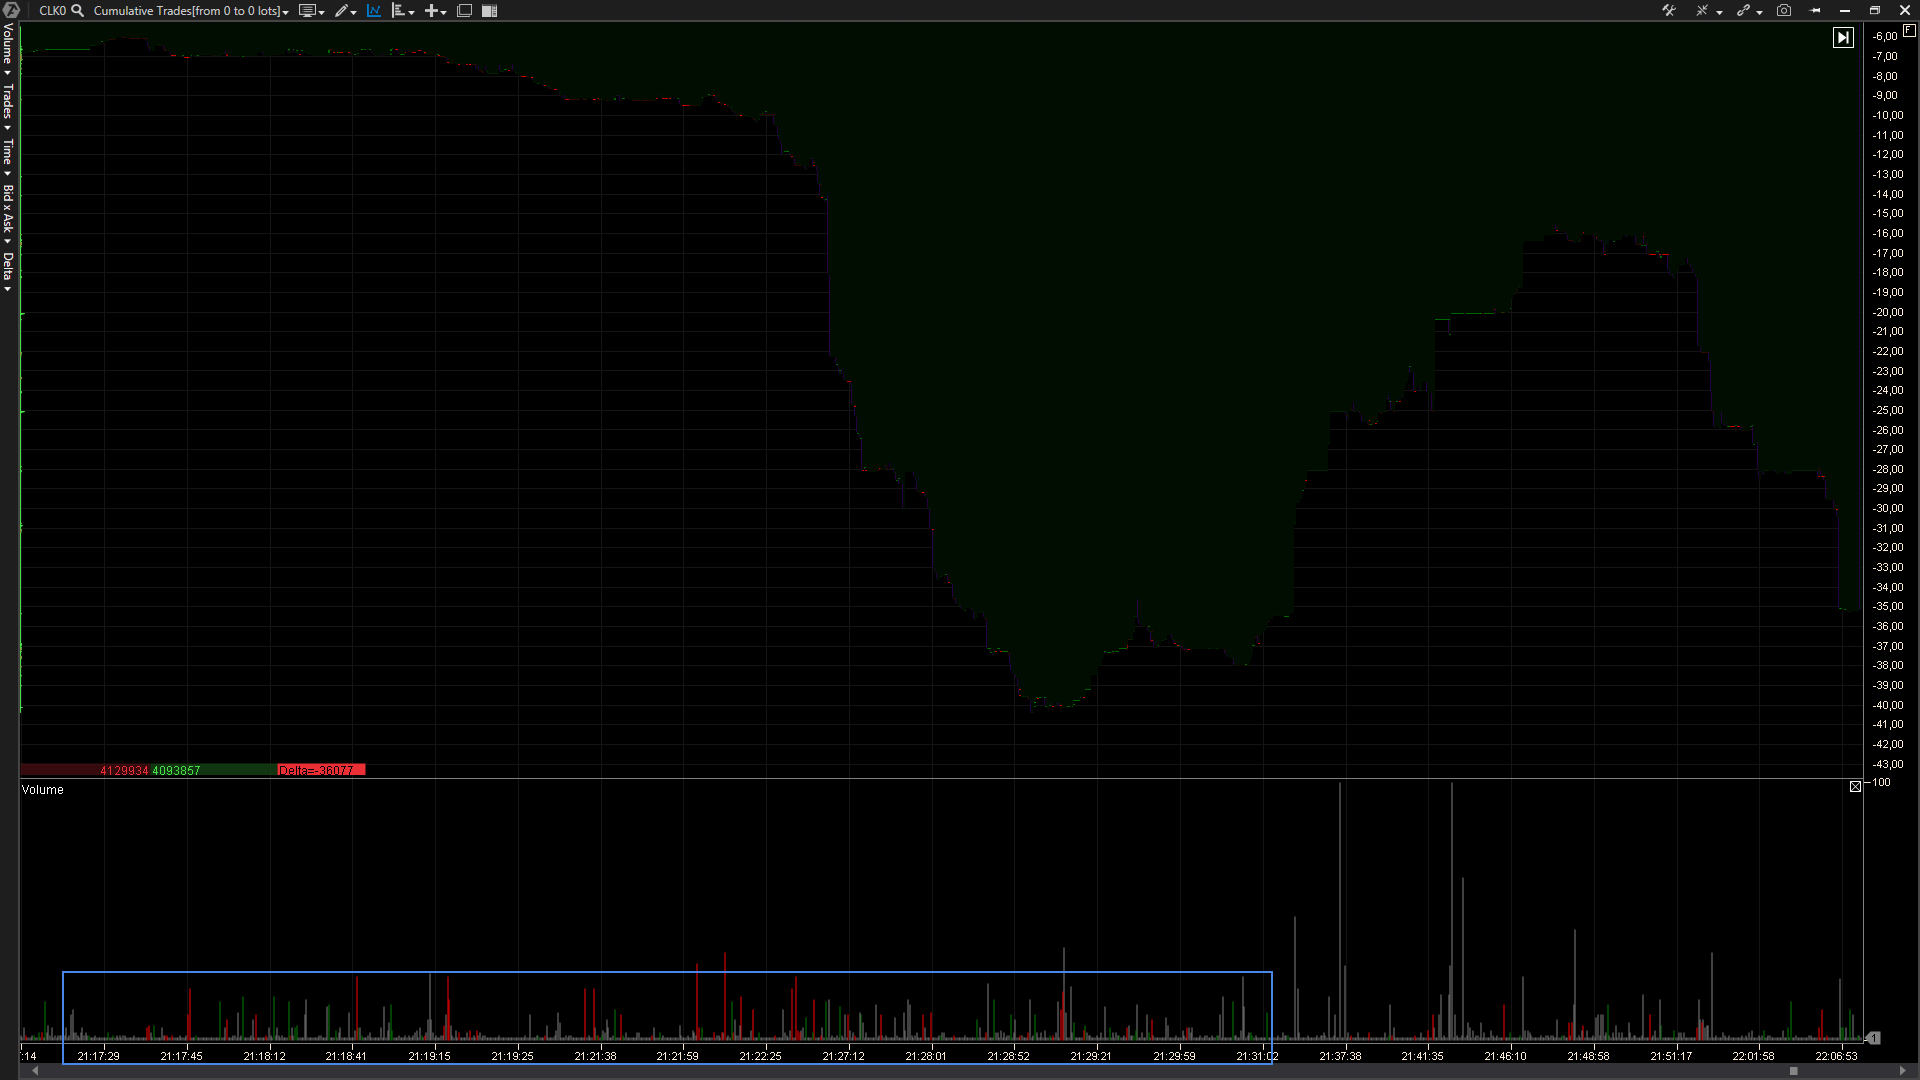
High activity of aggressive sellers gradually reduced the price. We see a cluster with a big negative delta before the zero level has been passed. It might seem that there was one big sell order there, but it is not so. We will see it if we move to the Cumulative Trades tape chart.
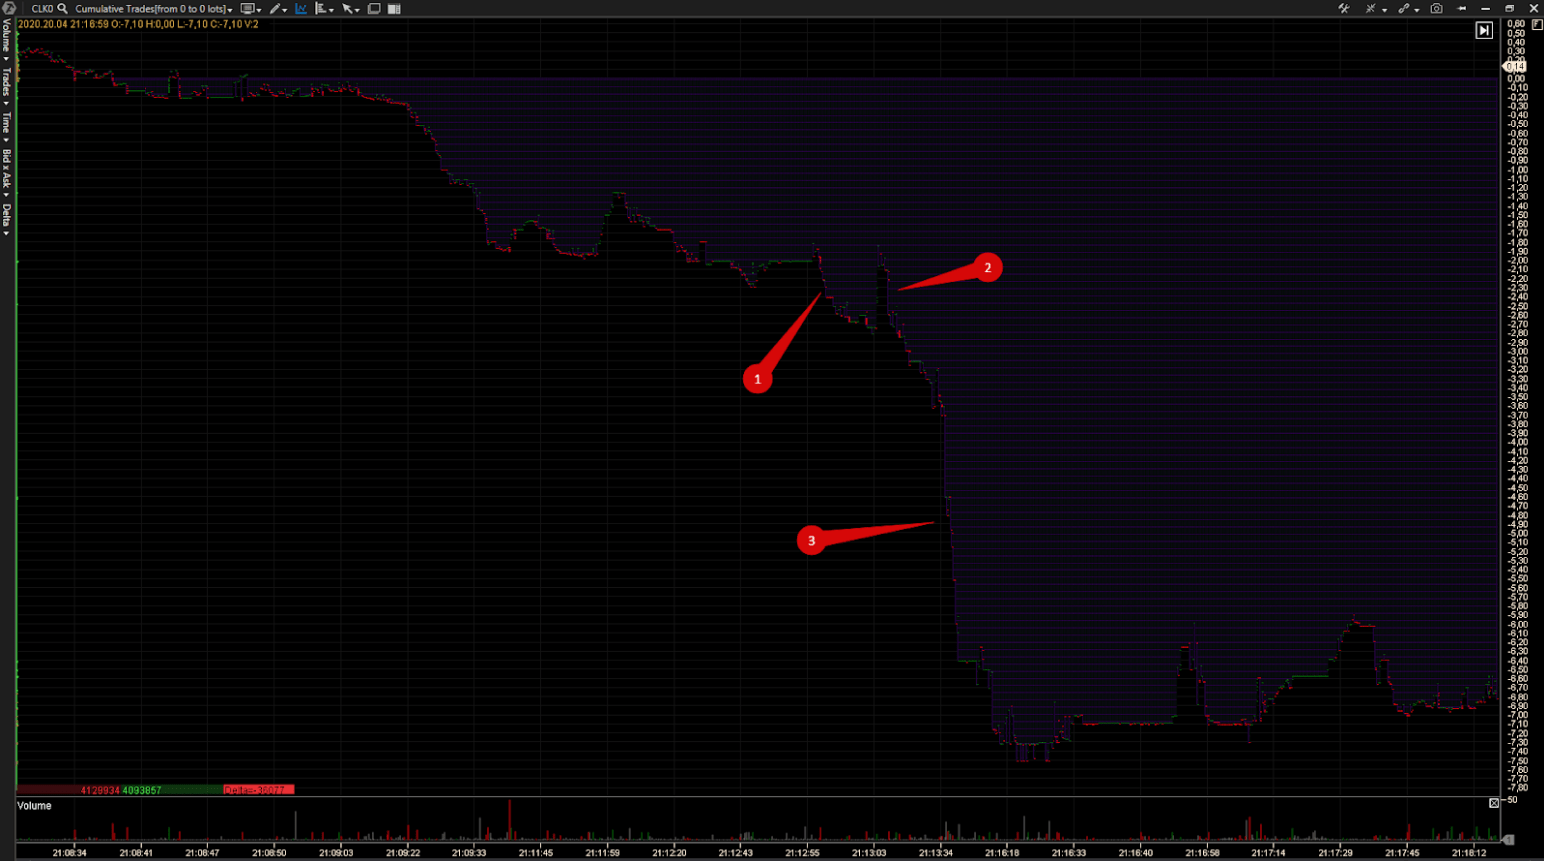
We can see from this example what happened at the moment of testing the zero price. There were very fast trades and they were in a small volume, but they were rather regular. Sells alternated with buys but a gap between buys and sells testifies to a very big spread in the order book. There was liquidity, but it was minimal. Usually, robots trade at such speeds. However, it might be that traders executed trades manually, but, most probably, the percentage of such traders was minimal. In other words, it was ‘a fight of robots’.
At a certain moment, they just prevented the price from consolidating above the level of USD 0. It lasted for about 25 seconds, after which the price started to fall at breakneck speed towards negative values. It is yet another confirmation that robots controlled this fall. Although, not many people would think in the moment that the price would move further down and there should have been more traders there who wanted to buy.
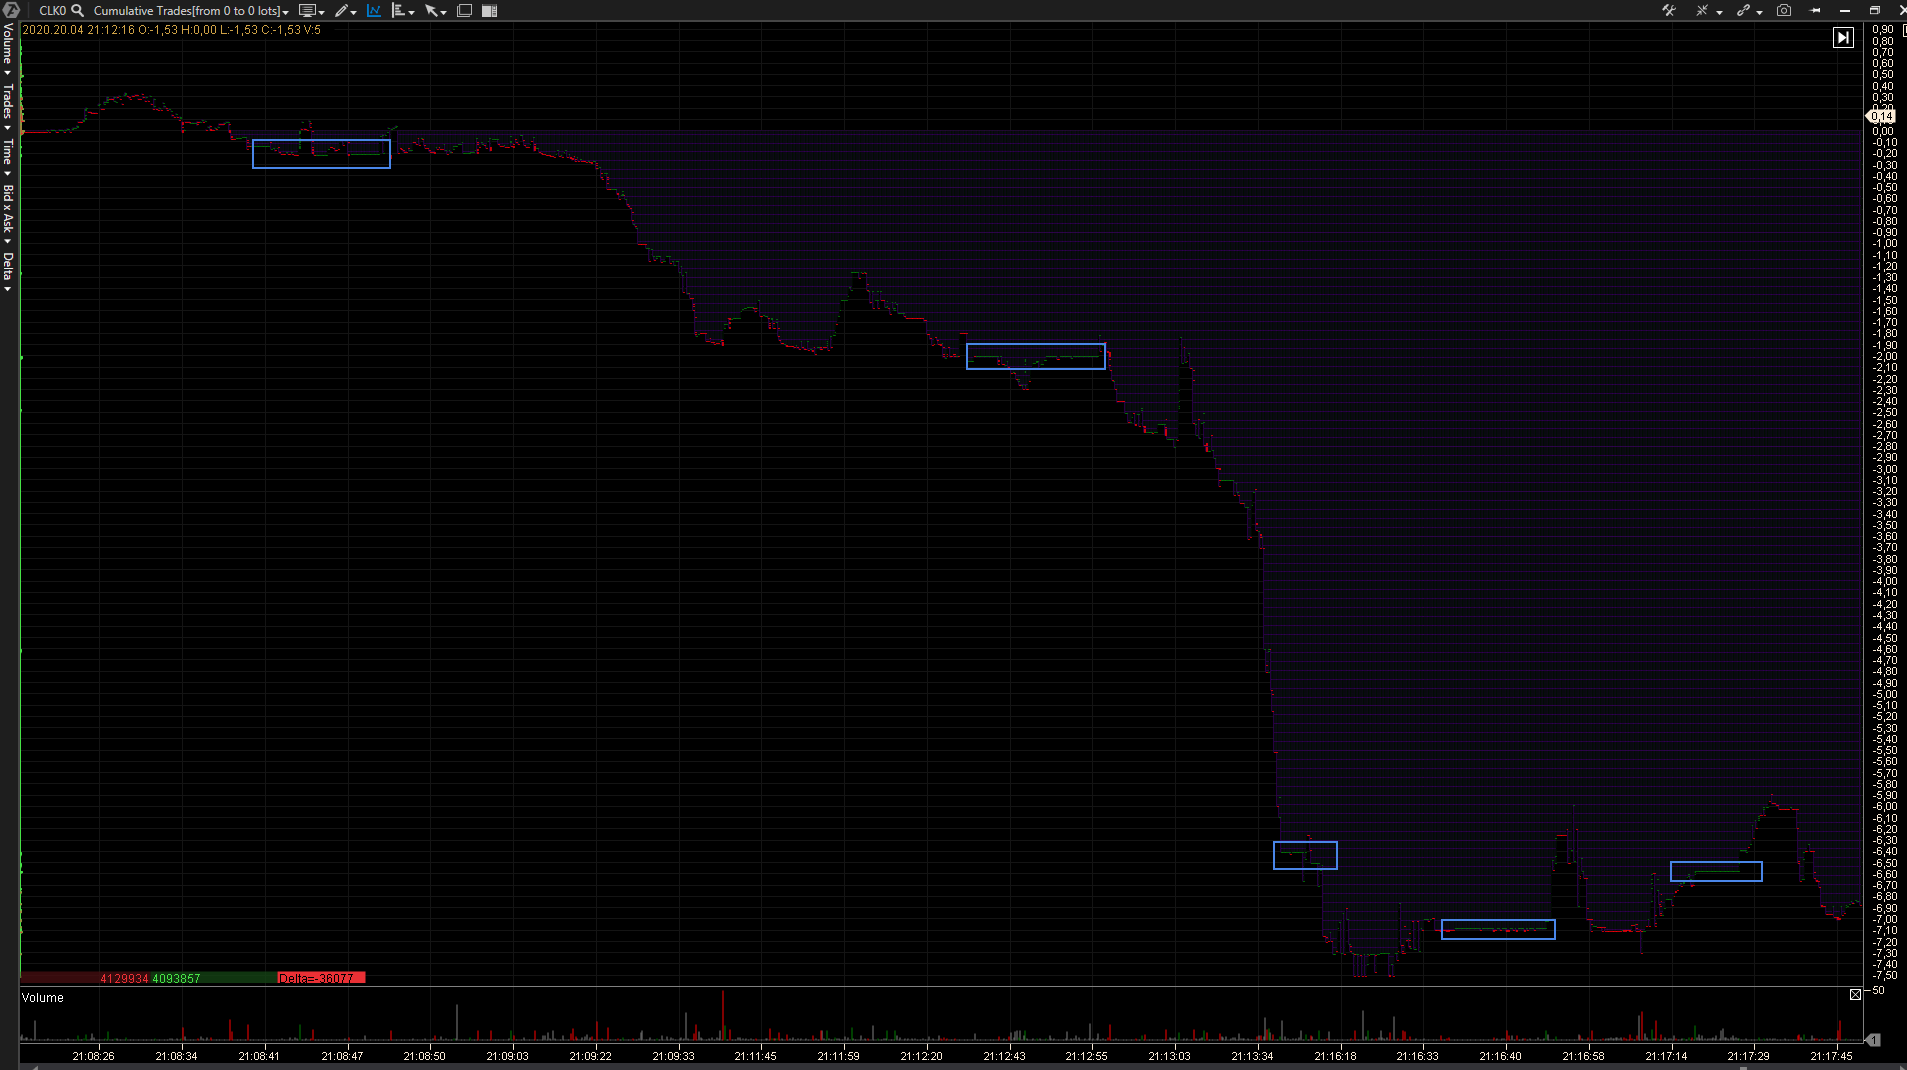
We see a sharp deficit of liquidity on bids and gaps in prices between the sell trades during the first wave of decrease. The price moved down with the breakneck speed.
The situation was much better (if we can say so) with the sells in the order book. We observed a series of engulfing initiative buys before strong downward impulses after the first signs of the price holding below the zero level.
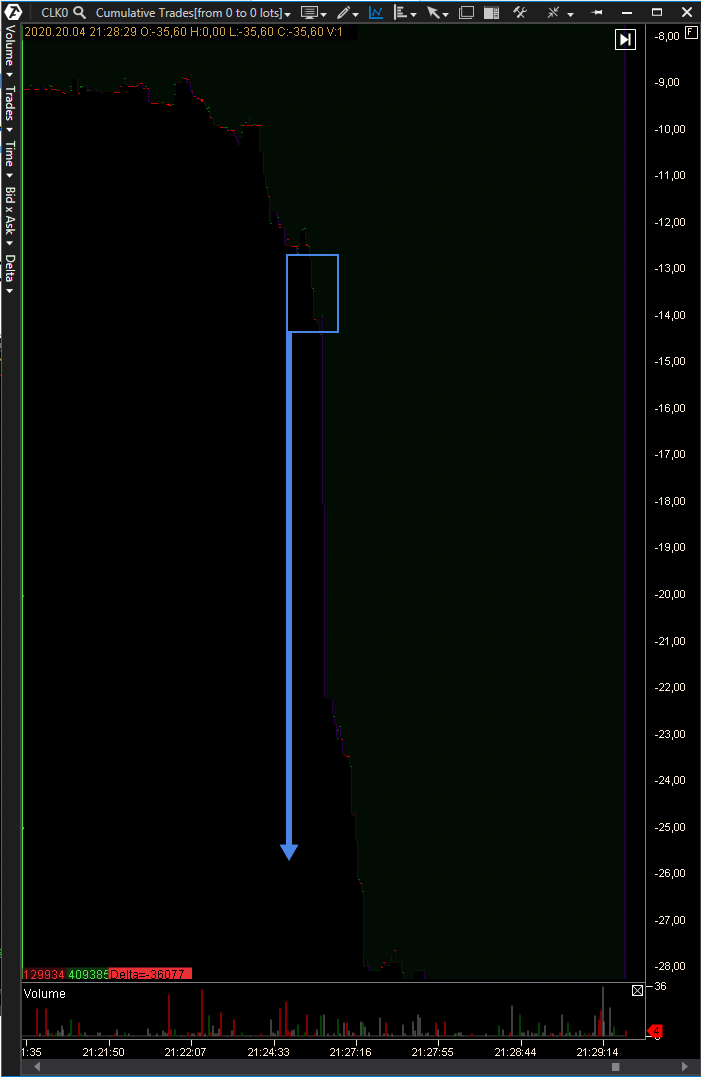
At a certain moment, liquidity completely disappeared and we saw a lightning-fast movement from USD 13 to USD 34.
The market microstructure tells us several things at this fall:
- The buyers tried to resist at the beginning of the zero price breakout. We noticed efforts to hold the price with the limit buy orders.
- There was an obvious fight of robots with explicit signs of engulfing initiative buys before the main fall. The seller acted with a focus, not allowing the buyer to bring the trading back to the reasonable price range.
- The main lightning-fast fall took place during 4 minutes with short stops.
- There were no big volumes at the end of the down movement – the whole down movement was on approximately equal volumes. In other words, an assumption that the price was reduced deliberately, in order to ‘squeeze’ some specific position of the buyer, doesn’t look very realistic.
- The market received the market buy orders during the whole decrease. Perhaps, some robots hunted other ‘weaker’ robots.
Having analyzed this situation, we can draw a conclusion that this moment was caused by a colossal influence of the trading high-frequency algorithms in the modern markets. Most probably, we will watch a documentary soon, in which they would offer an explanation of the situation.
In reality, we witnessed the situation when the exchange didn’t plan to stop trading despite the fact that the price of the May contract lost 100% of its value and moved far below the explained value.
Drawing the conclusion, we want to recommend several important things to traders:
- Trade only liquid futures contracts using the universal Continuous contract in ATAS.
- Do not open trades 2 days before the expiration date and monitor the calendar attentively.
- As you can see, the MM rules might not have saved the buyers in this situation, but the posted stop loss would help to avoid superlosses.
Best of profits and see you in our next articles.

