What a trader should know about round numbers
From time to time we acquaint you with interesting analytical articles of foreign authors. Earlier we published a study of Jan Firich about breakouts of the initial balance and today we will discuss the meaning of round numbers in trading with currency pairs and futures.
This article is based on materials of Carol Osler, a professor who studies currency rates since 1986. Her studies are interesting for traders since they contain important statistics about the price actions at certain levels.
Carol Osler asks the following questions:
- Does the technical analysis forecast the price movement with the help of the support/resistance levels?
- Do the traders post a bigger number of stop-loss and take-profit orders at the round price levels?
- Do the stop orders, accumulated at one level, strengthen trend price movements?
- Does the liquidity influence the price movement rate?
Briefly speaking, all answers are positive. We will not analyze the Osler’s methods and specific features of her calculations in detail. Those, who are interested in mathematics, can check the original source (you will find links at the end of the article). We will focus on practical issues. Namely, how to use this knowledge for making profit in own trading strategies.
The article shows the importance of round numbers in trading, which is proved by Carol Osler’s studies.
Does the technical analysis forecast the price movement with the help of the support/resistance levels?
Resistance and support levels are the levels, at which the price has a tendency to slow down and reverse without breaking this level (this is what Wikipedia says).
Technical analysis is used for identification of these levels. Broker companies, news and analytical agencies and private experts conduct this analysis. They send out the identified support and resistance levels to their clients, publish them on popular websites and in social networks.
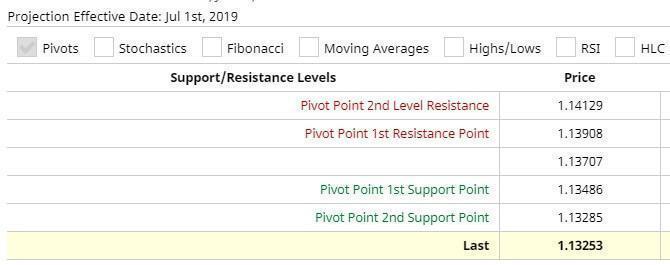
For example, here are resistance/support levels of the EUR/USD currency pair as of July 1, 2019, according to one popular resource.
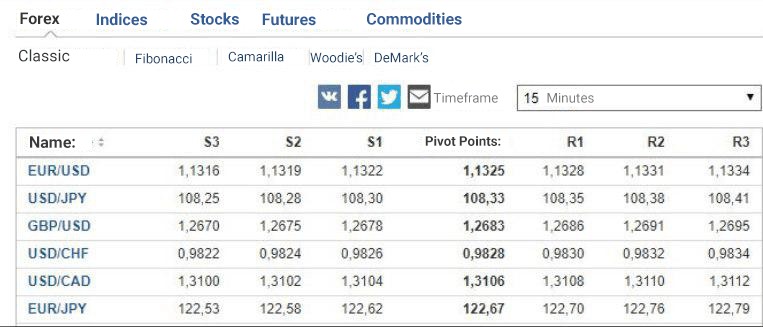
Here are data from another news resource.
How significant are these levels for their application in trading? Carol Osler conducted a study in order to find an answer to this question.
She assessed resistance and support levels using three currency pairs: USD/JPY, USD/GBP and USD/DEM*. The following data were used:
- reports of 6 commercial and investment banks;
- information of news agencies and exchange brokers;
- exchange trades for the period from 1996 until 1998.
* Since Carol used the results of her study also after the uniform European currency (EUR) was introduced, she used USD/EUR instead of USD/DEM in her later studies.
For testing, Carol Osler compared:
- price movement when reaching the published support/resistance levels;
- price movement when reaching the randomly selected support/resistance levels.
If the price bounces from or breaks the published levels more often than the randomly selected ones, it means that the published levels have a forecasting power.
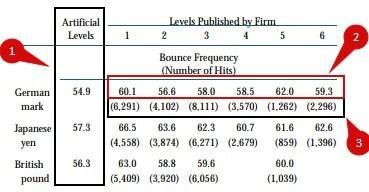
The study results are shown in the following table:
We marked random levels with number 1 and black vertical rectangle. We marked percentage indicators of bounces/breakouts of DEM with number 2 and red horizontal rectangle. Osler tested the data of each of the firms separately and got six columns of data. We marked the number of trades with number 3 and black horizontal rectangle.
We can make a conclusion from this table that bounces/breakouts of the resistance and support levels worked more efficiently with the JPY/USD pair. But what’s interesting … More than 70% of the resistance and support levels ended at 00 and 95% of them ended at 00 or 50 – these are so-called round levels.
We marked the published level’s statistics with a black rectangle, and we marked the artificial or accidentally found levels statistics with a red rectangle.
As you can see, numbers in the last column tend to 100. It means that round numbers psychologically attract traders as a magic magnet. We will come back to this regularity in the later sections.
According to Osler’s calculations, 75% of levels would be used again the next day. The majority of them act efficiently for 5 more days.
Osler writes that the technical analysis works because the orders of different traders are accumulated at certain levels. The support area is a concentration of demand and the resistance area is a concentration of supply. Round numbers work as technical trading signals. Stock and commodity orders are also concentrated at numbers, which end with 0 and 5.
Are the majority of stop-loss and take-profit orders posted at round levels?
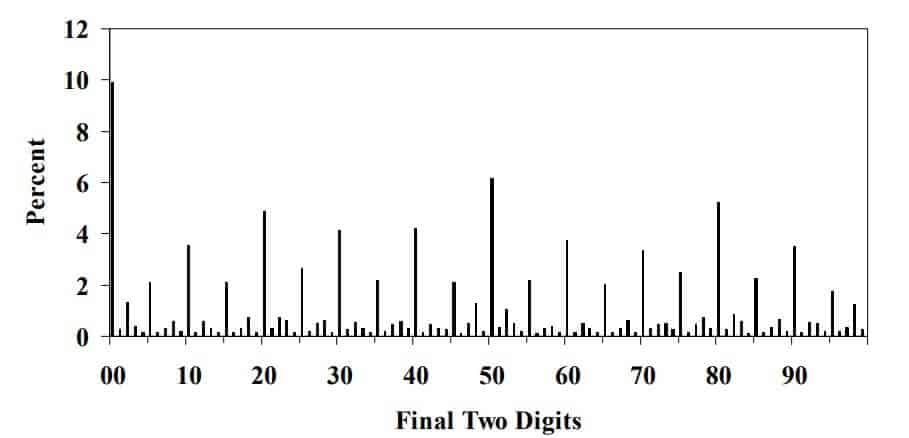
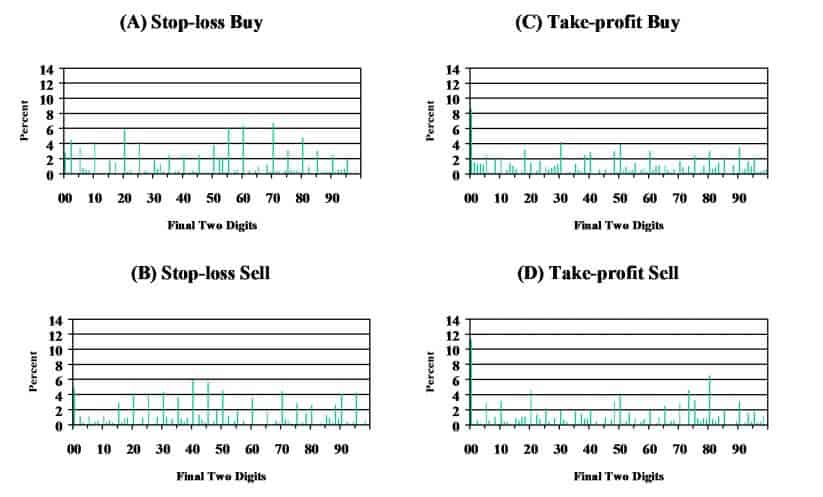
The next chart shows the percentage of distribution of stop-loss and take-profit orders depending on the price ‘roundness’. The horizontal axis is the price scale and the vertical one is the percentage of orders.
The majority of orders fall at those price levels, which end with 00 and 50. When we say ‘majority’, we mean the biggest splashes in the bar chart. The grouped stop-loss orders may strengthen the trend movement because they are focused in the same direction. The grouped take profit orders cannot strengthen the current trend since they are focused in the opposite direction.
For example, the EUR/USD pair grows. Those traders make profit who are in long positions. The traders, who are in short positions, make losses. As soon as the traders, who are in short positions, start closing losses, they will buy (you need to execute a buy order to close a short). Buys will strengthen the already existing growing trend.
When the traders, who are in long positions, start registering profit, they will sell (you need to execute a sell order to close a long). Thus, the take-profit trades would be directed against the existing growing trend.
Osler gives separate statistics for stop-loss and take-profit orders.
Traders post take-profit orders more often at the levels that end with 00, and stop-loss orders at the levels that end with 50. Accumulation of these orders in large part explains the resistance levels or technical barriers, which we discussed above.
In the picture above, the take-profit buy orders at the level of 00 take nearly 8%, while the take-profit sell orders at the level of 00 take nearly 12%. Statistically, these levels are much more important than all the other ones.
There are no such explicitly important levels for the stop-loss buy and sell orders. They are grouped near 50, that is in the range of 40-70.
Does the liquidity influence the price movement rate?
When the price enters an area, where a big number of pending stop orders have been grouped, the cascade effect starts. Execution of a big number of stops at one level pushes the price one tick further, where also a big number of stops are located.
Do the stop orders, gathered at one level, strengthen trend movement?
According to Osler’s data, significant cascades take place not more than once a week. And only stop-loss, not take-profit, orders could result in a cascade or wave price movements. Moreover, a massive activation of stop-loss orders would surely produce tails or spikes. Stop-loss orders, which are grouped at the same levels, strengthen trend movements and influence the price during a longer period of time than take-profit orders.
ATAS examples.
The theory and studies are great. But it is even better if they could be applied in the trading practice.
In this section, we will tell you how to use round levels in trading.
Round levels work not only for currency pairs, but also in the stock and forward markets. Quite often beginners take stop-loss for new orders, join the movement and … get into traps. How to avoid it? ATAS instruments increase understanding and transparency of the market situation.
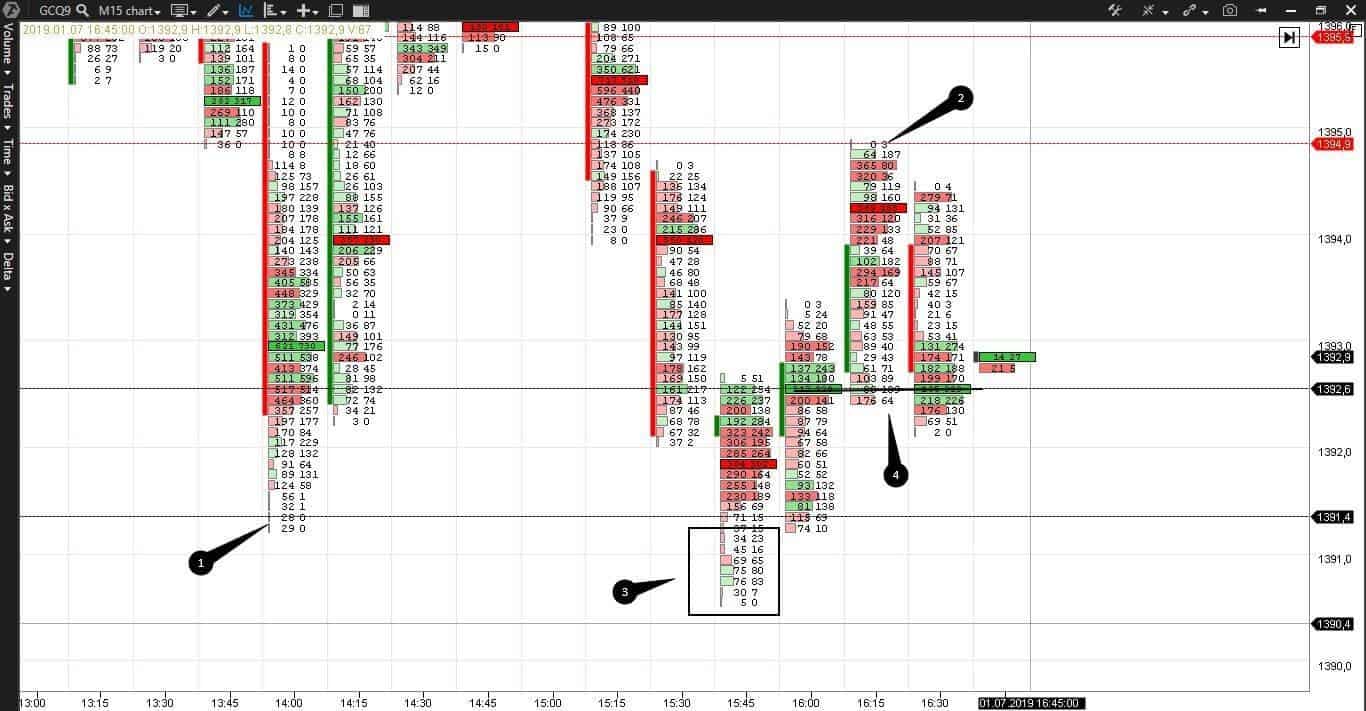
Let’s consider an example in the 15-minute gold futures (GCQ9) chart. In the first example, we will use support/resistance levels taken from one of the analytical resources.
Black horizontal lines are the closest support levels. Red horizontal lines are the closest resistance levels.
We marked the supposed stop-loss orders with numbers 1 and 2, since there are zero values here. We marked exhaustion of sells with number 3 – the main volume of this bar is above the resistance level. We marked POC (Point Of Control) of two bars, which fall at the support level, with number 4. Which means that the traders knew about this level and used it for posting orders. The coloured footprint shows what exactly took place at the resistance/support levels and who won – buyers or sellers.
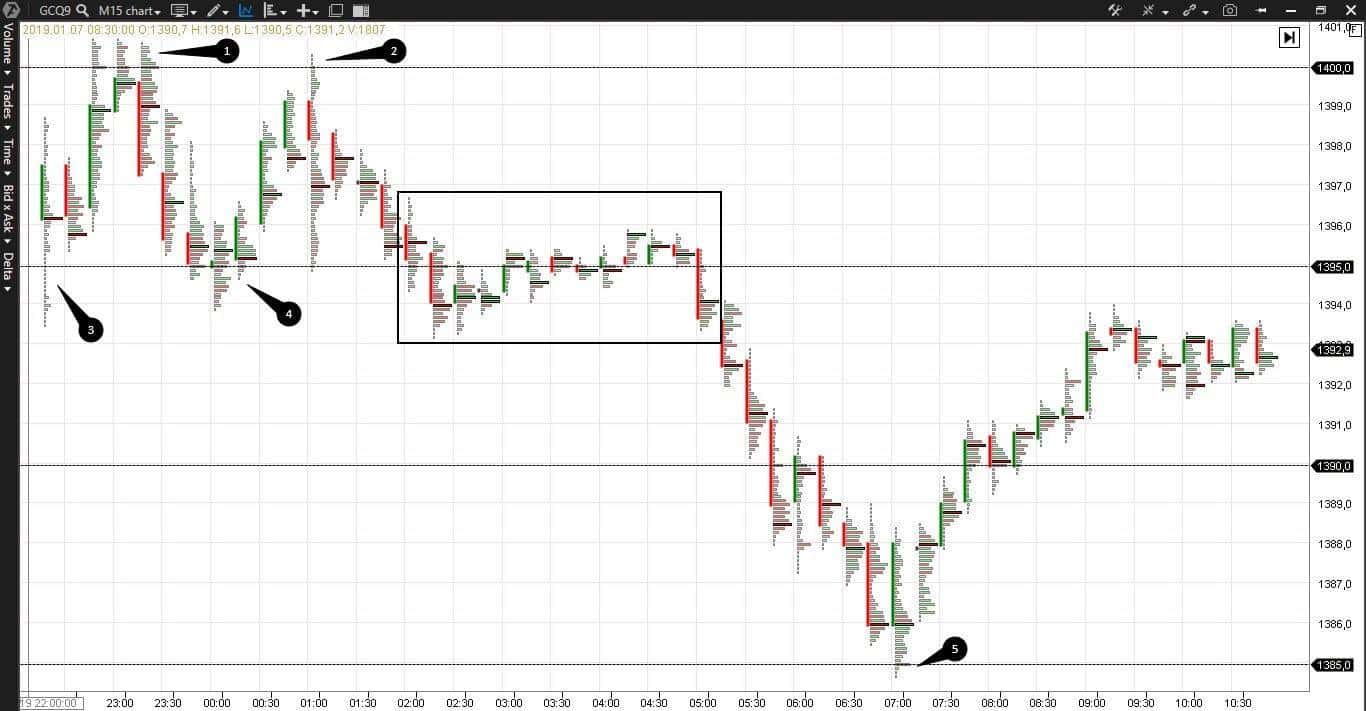
And now we will check what happened with the same 15-minute gold futures (GCQ9) chart at round levels. We marked the round levels with black horizontal lines.
We marked the bars, where, most probably, stop losses were activated and some traders got into a trap waiting for a breakout, with numbers 1-5. These are quite thin tails. The red footprint cells in point 1 show that sellers emerge. Green cells in points 4 and 5 show that buyers emerge. Note that the maximum POC candle volumes do not go behind the round levels. We marked a fight of buyers and sellers at the level of 1,395 with a black rectangle. You can use round levels in your trading strategy.
And now let’s take the Moscow Exchange, since we can use the Open Interest here to understand whether the traders opened or closed their positions at round levels. ATAS has a great indicator – OI Analyzer, which shows actions of buyers and sellers separately. But, in our example, we use the Smart Tape in the historical mode, that is for a passed period of time. It is very convenient if you want to see what types of trades took place at each price level, when you were away from your terminal.
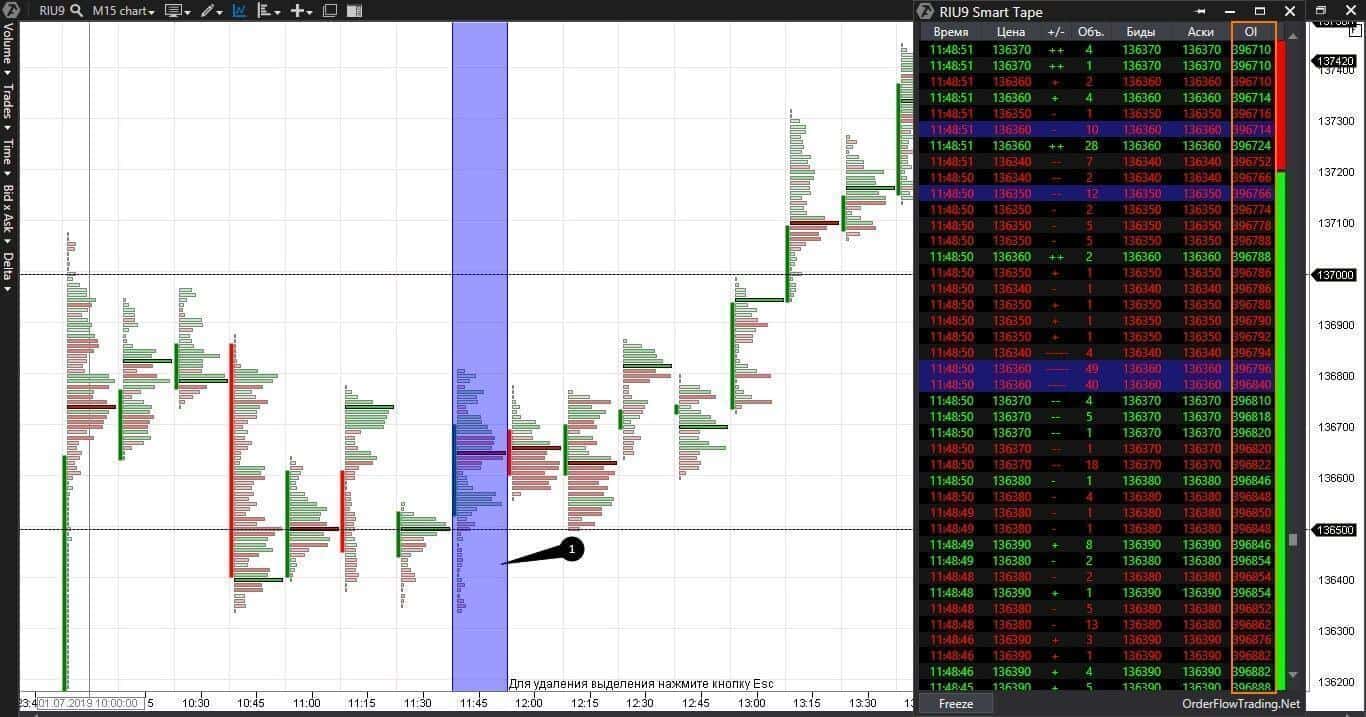
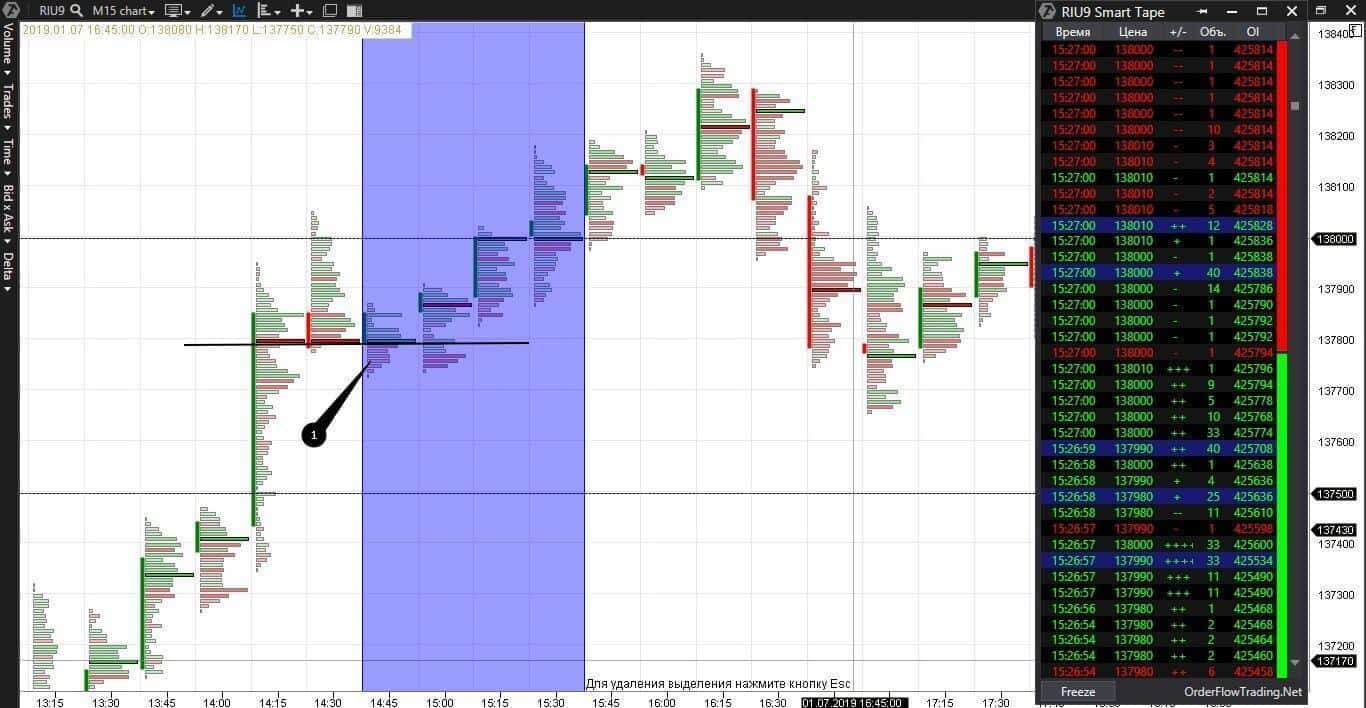
Here we have a 15-minute RTS index futures (RIU9) chart with marked round levels.
Stop-loss and take-profit are closing of an already existing contract. It means that the Open Interest (OI) should not increase. Perhaps, it is not the easiest way to detect stop losses and take profits by the open interest, but no one can prohibit us to experiment searching for the truth. OI is decreasing globally in our section of the tape. Numbers in the yellow rectangle reduce from 396,882 to 396,710 just in 5 seconds. In this case, we look at the tape from bottom to top, since the earlier events are in the bottom. Many trades took place in the marked bar, but we were interested in the 136,300-136,400 range, where the tail marked 1 is just under a round number. That is why, we looked for what types of trades took place in this range in the marked part of the tape.
Of course, we cannot show all trades of this bar in one chart physically, but you can always find the necessary information in ATAS.
This part with market sells of the tape confirms that traders close their long positions. They sell, which means they were in longs. While trading during this day, the traders with long positions make losses in the range of 136,300-136,400 because the main trading activity developed higher. We found what we were looking for – these are stops behind a round level. It is crucially important for us that these are not new sell orders, which means that, most probably, the price fall would stop and it would reverse.
Let’s check what happened at the level of 138,000. We see a breakout and reversal. Let’s follow the course of events on tape. Ideally, if major players expect a breakout, they gradually accumulate their positions BEFORE the level, during the periods of accumulations and distributions. Major players have too big positions to be able to open/close them at a breakout. Regular traders should monitor not only round numbers but also the levels before them to be able to notice a growing activity in time.
In our example, such an activity was at the level marked 1. As regards the level of 137,800, the sellers and buyers obviously fought there, POC of neighbouring bars formed a local support level, by the way, again before a rather round number. Let’s check what happened further at 138,000. Namely here the traders opened new long positions and the Open Interest grows. You can find all trades on tape on July 1, 2019, during the period from 14:45 until 15:30. The price rolled back a bit and buys for 100 contracts in one lot appeared on tape. And now let’s see how much it is in money terms. An RTS index futures security guarantee is RUB 21,658. In order to buy or sell 100 contracts, there should be minimum RUB 2.2 million on the account (without the broker’s credit leverage). Perhaps, it is not the biggest money in the world, but a beginner trader definitely does not have it. It is the one who wants and can make money on the exchange, so, we will monitor such orders.
Both scalpers and intraday traders could find trading opportunities at both levels – 136,500 and 138,000. Besides, it was possible to open trades both for buying and selling.
Conclusion.
Let’s draw a conclusion and formulate how to use round levels on the exchange as your advantage:
- To open a trade before the level and catch a brief strong impulse of a breakout and stops after the level. You need skill, accuracy and fast reaction to do it. Perhaps, it is not the best tactics for beginners. It is an ideal scalping, but the risk is high.
- To wait for stops and takes to end. To make sure that there are new orders and to enter a trade together with new orders at a round level. It can be seen in our examples that the round levels are tested by the price several times, so you have time to think it over and decide.
- To open a trade along with the main trend from one round level to another. The impulse should be rather strong with a big number of new orders.
- To monitor big orders before round levels and to join the managed money.
- Do not post your stops and takes immediately after the round levels, that is at those places where many traders do it.
Summary.
Maybe traders lack imagination to figure out not a round level for his stop. Do they feel too lazy to do it? Do they lack time and every second counts? Is the problem in psychology? Reasons are different but, one way or another, the round numbers really attract traders. And the time confirms this fact.
You shouldn’t use the levels, which attract everyone, in order to avoid being ‘kicked off’ by a stop accidentally or purposefully. You shouldn’t use these levels for making a fast profit. ATAS will show you what other traders do not see. You will not get into a mess and will not be entrapped by cascade stops.
Do you have your own opinion with respect to round numbers in trading? Share it in the comments.
Original sources
Here are those studies we worked with:
STOP-LOSS ORDERS AND PRICE CASCADES IN CURRENCY MARKETS
Support for Resistance: Technical Analysis and Intraday Exchange Rates

