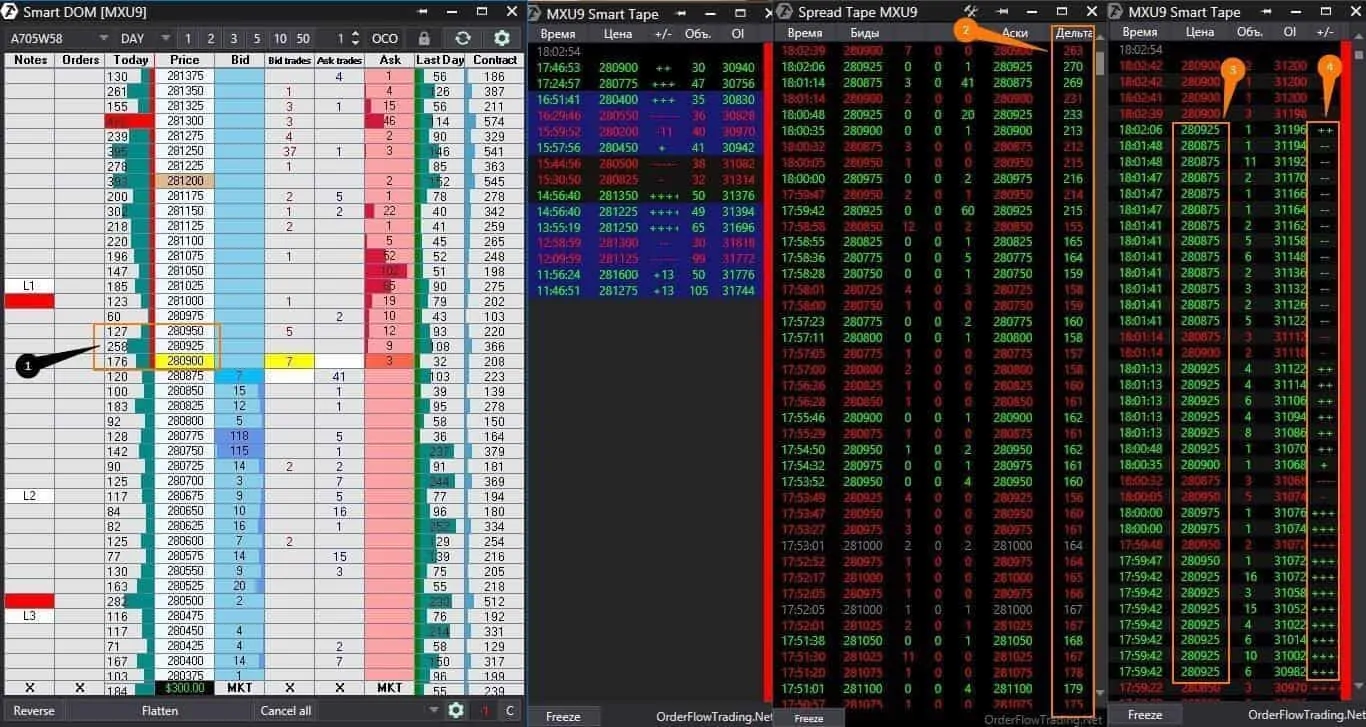
First, a couple of words about the chart legend.
- Red rectangles are round levels. They have the informative load only.
- L1, L2, and L3 are the levels of gradual expansion of the day’s Low during a trading session. In other words, the price first broke the Low (L) and reached the Low1 (L1) level and then rolled back. Then it broke Low1 (L1), and so on. Any trader puts these and other marks for himself.
- We marked the Smart DOM level, at which especially many trades were made, with number 1. We became interested in this level after seeing big new buys on the tape. The Open Interest grows, meaning these are new contracts rather than the closure of old positions.
- Number 3 marks the price levels at which traders bought.
- We marked the delta, which grew approximately by 100 contracts, with number 2. We calculate from top to bottom – from earlier to later. At first sight, the new buys should move the price up. But not in this case.
We marked a handy column in the tape – Up Tick & Down Tick – with the number 4. Ideally, if traders buy, we see + or several +++ in this column. If traders sell, we see – or several — in this column. But if we see – at buys, it works as a divergence. That is, traders buy, but the price doesn’t move higher. Instead, it moves lower. It isn’t good if we observe many consequent minus signs during buys in the green area. It is a red light for buyers. It is a primitive explanation, and you shouldn’t apply it mechanically.
In this example, we consider a combination of factors:
- appearance of new buy orders – we see it from the OI growth;
- accumulation of new buy orders approximately at the same price level – we see it from the delta increase;
- absence of price growth during buys and even some reduction – we see it from Up Tick & Down Tick.
We conclude that we want to sell at this level. This is because new buy orders ‘bump into the ceiling’ and cannot break it. Sooner or later, the traders would realize that and start to exit from long positions. As soon as it happens, we would see a sharp downward movement.
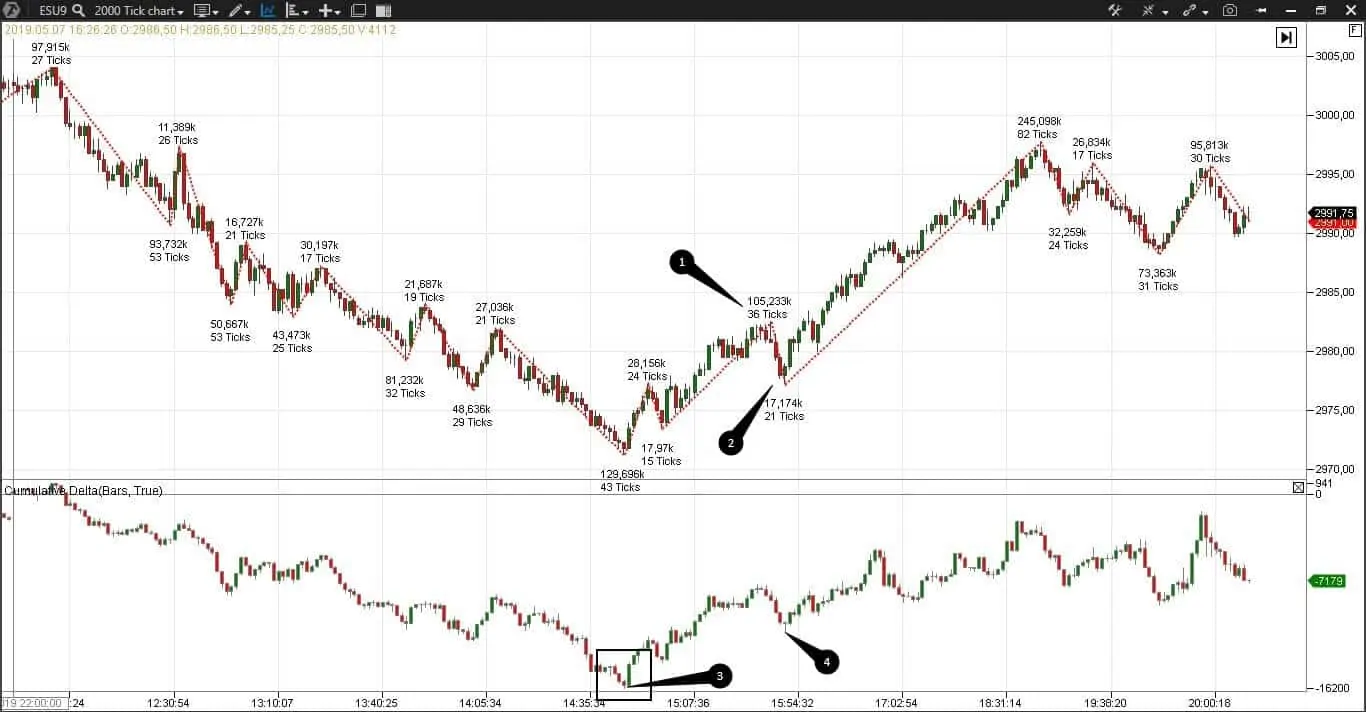
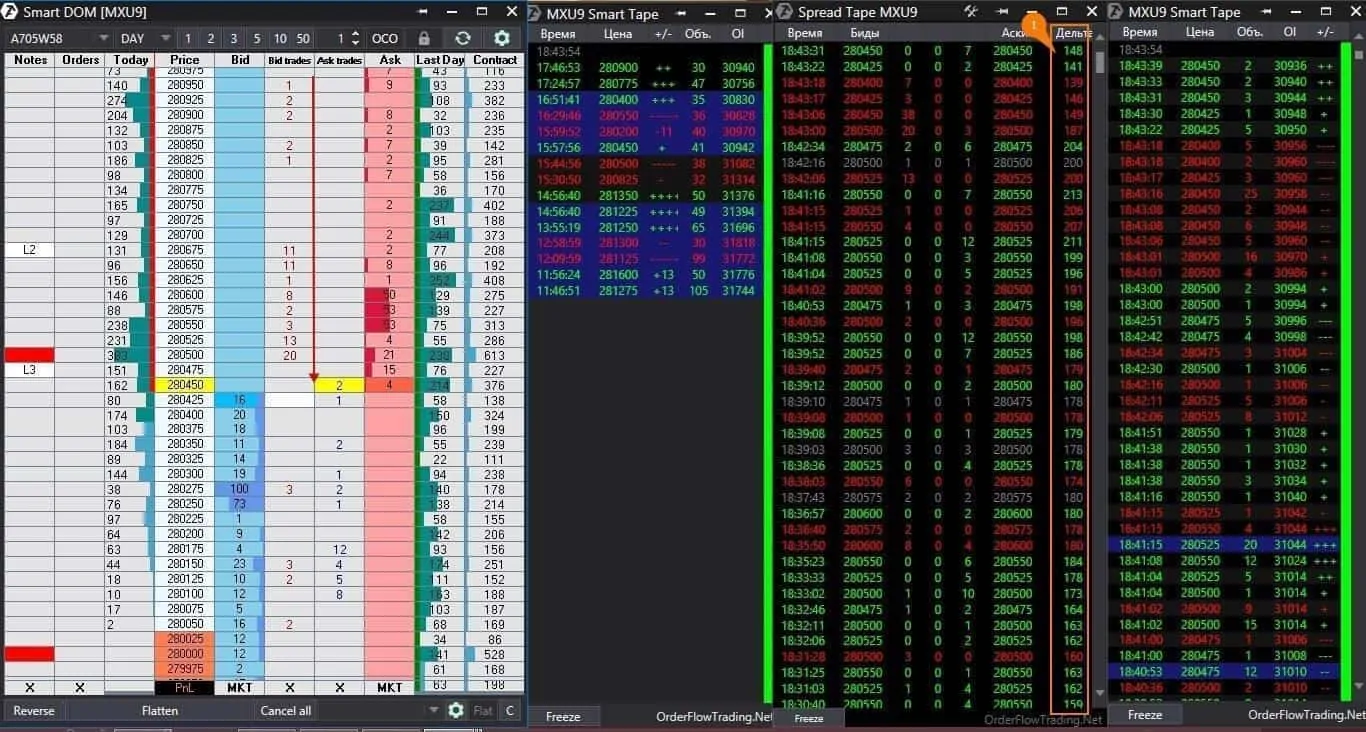
The result is in the following chart.


