What Is the Falling Wedge Pattern and How Does It Work?
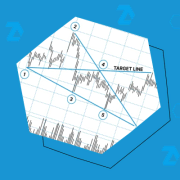
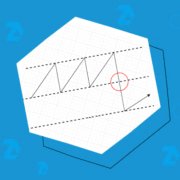
The falling wedge is a chart pattern (or formation) in technical analysis that belongs to the category of triangle patterns. According to classical interpretations, the falling wedge signals a potential trend reversal. But does this hold true in practice? In this article, aimed at beginner traders, we examine the falling wedge in more detail: how […]