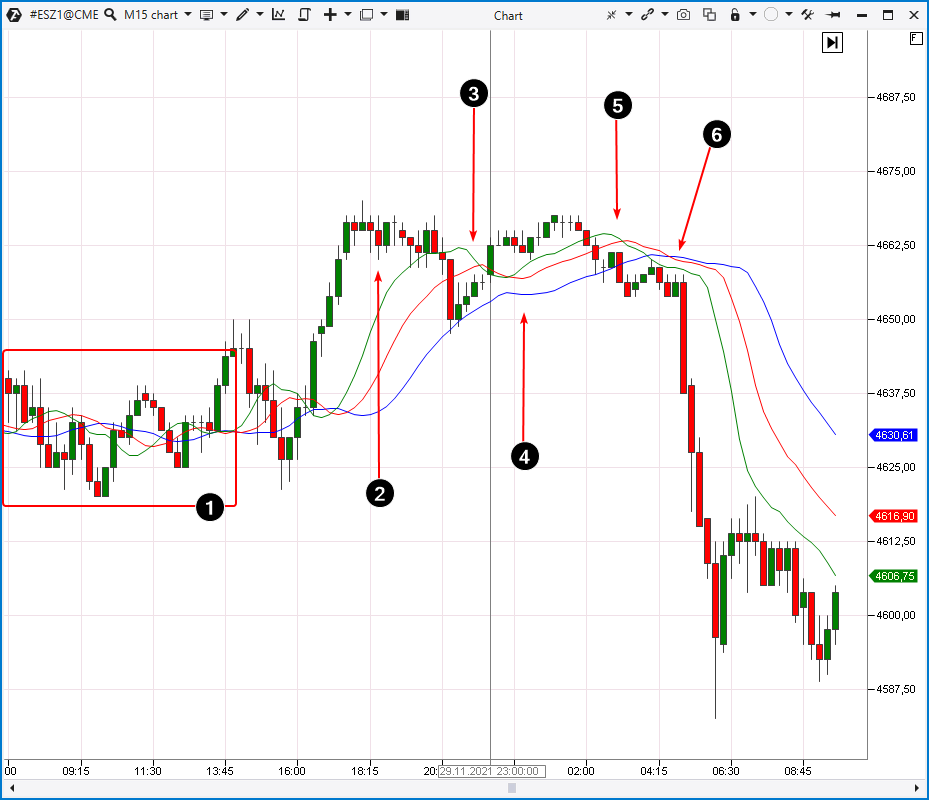
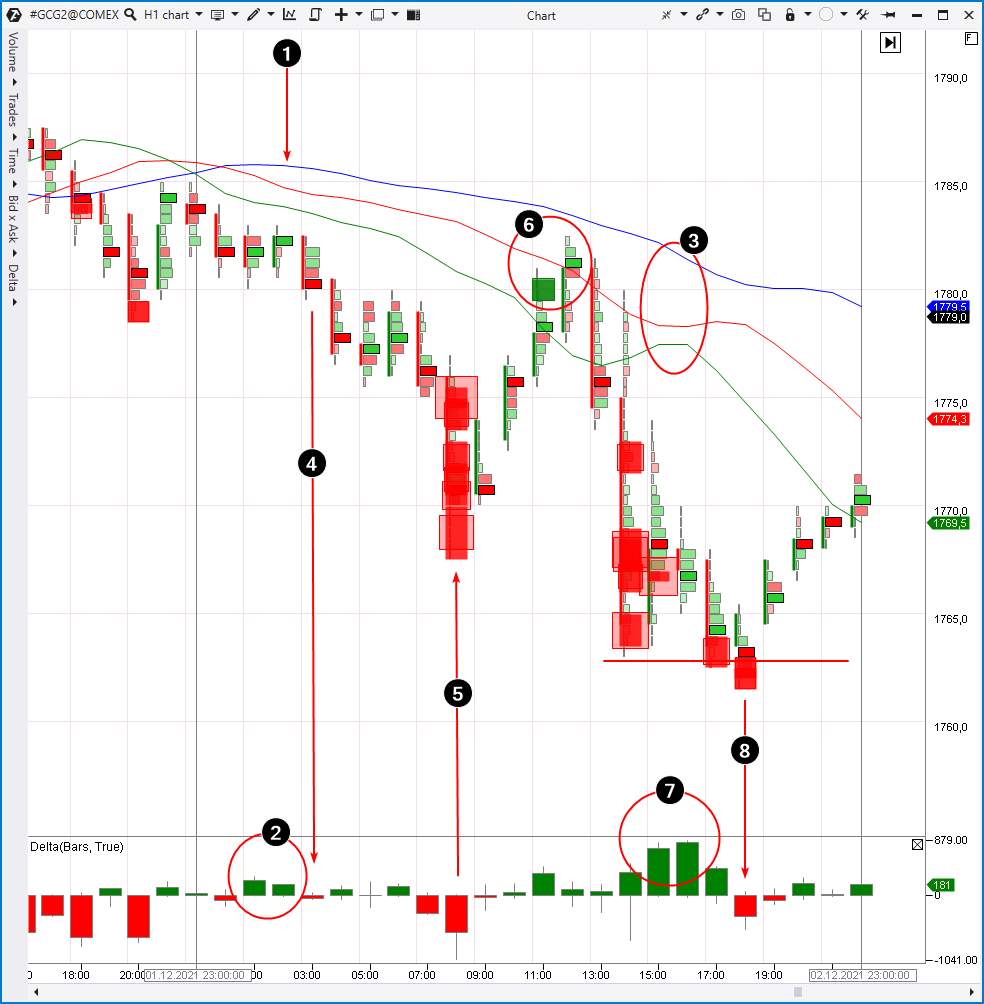
Number 1 indicates that the entry conditions to go short according to the Alligator strategy are met. Please note that cluster analysis confirms the validity of the short entry, as the buyers’ efforts, noticeable on the Delta indicator (2), do not demonstrate any progress in the form of price growth. If the price does not rise despite the buys, the chances of its decline increase. This is what eventually happens when sellers appear (4).
The position starts to bring profit. When should you exit? When the Alligator lines get closer to each other (3)? Yes, it is possible or you can hold the position until the lines crisscross each other (the Alligator “falls asleep”). The final decision is at trader’s discretion.
Cluster analysis provides more valuable information for decision making.
Pay attention to the events that happen on the candle marked with number 5. The Big Trades indicator shows large single sales at the market price. However, the candle does not close at its lows. Moreover, we see a long tail on the Delta indicator which means that a buyer has entered the market. It is reasonable to expect a bounce off 1770 level under these conditions. Unfortunately, the Alligator indicator is not able to capture these important nuances for analysis.
The appearance of the buyer leads to the price increase marked with number 6. Here we see that the Big Trades indicator has been triggered. However, this time the square is green, which indicates large buy market orders. Most likely, this is a local buying climax within the day.
There is a high probability that the peak of buys at number 6 has a significant number of shorts that are closed by stop losses set above 1780 level. Having activated these stop losses, the market goes down, which is a huge disappointment for traders.
The 14:00 candle demonstrates a series of the Big Trades indicator triggers. It seems that in those moments the market was dominated by panic but look at the Delta indicator. There is a long lower shadow on the 14:00 candle; it indicates that at some point buyers appeared in the market and “outweighed” the sellers with their activity.
The Delta indicator shows (7) that buyers did not disappear on following candles. It proves that the downtrend got significant support.
Number 8 indicates an attempt to go down but the price only “thrust” the previous low, set by the candle at 14:00, and quickly returned up. This movement dynamic is typical for false breakouts aimed at activating buyers’ stop-losses. Surely the red squares of the Big Trades indicator on candles at 17:00 and 18:00 show the closing of longs by stop losses. Having made such conclusions, a cluster chart reader may decide to close the short, as the downtrend within the day exhausted itself. At the same time, the Alligator indicator did not give even a hint of closing shorts.
From our point of view, the best entry points for the short position were the tops marked with number 6. According to traders’ terminology in moving averages it was a test of the MA (8), but does it sound convincing enough to risk your money? The information obtained from the cluster analysis method sounds more reasoned.

