All about analytics for beginner traders
What does it mean – to analyze? The answer is in the root of the Latin word analysis – breaking up. Consequently, to analyze (Latin analyzare) means to break up the whole into parts. It means that to analyze the market means to break it up. You can study the market in detail after breaking it up.
What does the market consist of? Obviously, it consists of sellers and buyers.
The ATAS platform, as an analytical instrument, allows breaking up charts of any market, practically, into atoms. It presents actual information about each trade, which was registered on an official exchange, both in the real-time mode and using historical data. We will speak about it in detail a bit later.
First of all, let us decide what the market analysis should be conducted for. Why breaking up a chart into sellers and buyers is a vital element in the everyday work of a professional trader.
Why we need to analyze the market
Market is a constantly changing structure. What does it mean?
For example, if an auto mechanic in an automobile repair shop takes 3 engines of similar cars into pieces, he will get the same result every time. The engine has a standard structure. If an analyst would break up the market, he would get a unique result every time. Because the market is a produce of unsteady thoughts of a multitude of human beings. Each moment in the market is different from any previous one.
Expectations of traders are permanently changing under influence of many factors:
– publication of some economic statistics;
– statements of politicians and officials;
– reports of major companies;
– interviews of competent analysts in popular media;
– psychological price high or low;
– advice, rumors, astrologist forecasts and …;
– … and a million of other reasons.
As a result, all conclusions of all traders are reduced to one of two results – a decision to Buy or a decision to Sell. Well, there is one more possible decision – to Wait. But it is inactive and cannot change the price, that is why it is of no interest for analysis.
This is how the market demand and supply form. Traders’ decisions turn into broker’s buy (demand) and sell (supply) orders and are submitted to the exchange. Then they are processed by the exchange and become accessible to traders for study in a trading and analytical platform through the service of the price quote supplier.
The picture above shows a window of the Smart Tape module of the ATAS platform. This Smart Tape (Time and Sales Tape) shows a flow of executed trades in a form convenient for analysis.
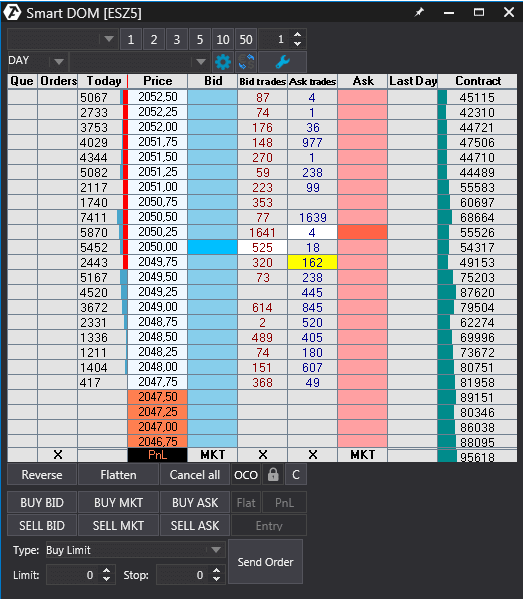
The Smart DOM module from the trading ATAS platform gives a possibility not only to analyze the posted orders, but also to post your own ones. You can find more details in the Knowledge Base.
Constant monitoring of the executed order flow (through Smart Tape) and posted orders (through Smart DOM) provides understanding of what side has more control in the market at this moment (or it is in a balance). Thus, an individual trader gets a key for trading in harmony with the market in general and with major professional players in particular through the analysis of the changing balance of buyers’ and sellers’ forces.
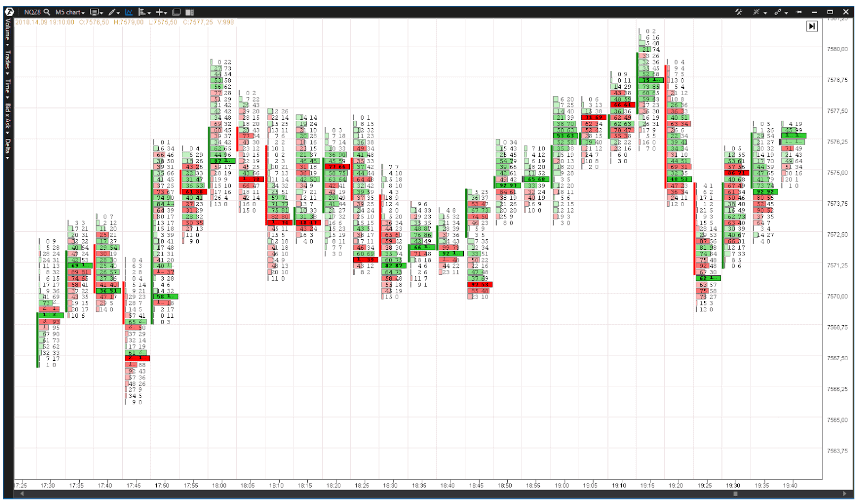
Footprint or a cluster chart is like a detailed map, which clearly visualizes executed trades taking into account time, volume, price and trade direction.
If you want to significantly increase your chances for a positive result, it is necessary to plan operations “on the right side”. You need to conduct a regular market analysis namely for this purpose.
How to assess the balance of sellers and buyers? Respective instruments will help you to do it.
Analytical instruments of a trader
Another example with our auto mechanic. Can he take the engine into pieces just with a screwdriver and wrench? No. He needs professional instruments, the cost of which is much higher than that of the economy class of its analogues (mostly produced in China). A professional needs to be sure of his instruments.
The trading and analytical ATAS platform is a rich set of unique, convenient and, most important, useful instruments for the market analytics. They allow high quality monitoring of the second-by-second fluctuations of the current balance of demand and supply with a possibility to connect to any known exchange (MOEX, NYSE, NASDAQ, Bitfinex, BitMex and so on).
Download a free test version of the platform from here.
One of the ATAS platform indicators, which is called the market depth, shows a change of the market demand and supply in the form of a horizontal bar chart in the right part of the chart.
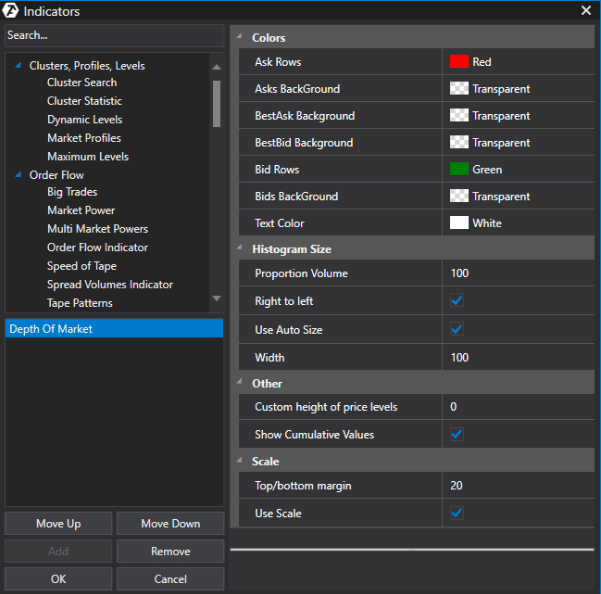
In order to turn on the market depth indicator:
– press Ctrl+I;
– select Depth Of Market in the list of indicators;
– press Add and then OK.
The levels where buyers “stand” are shown in green color. Such levels often provide support to the market. The bigger the bar chart value is, the (usually) stronger the support is.
It is similar for the sellers. Big red lines indicate the resistance levels.
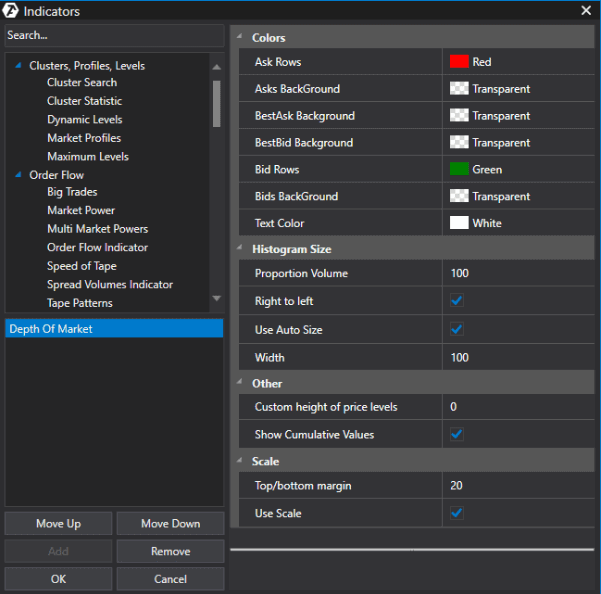
Indication of total values of buy and sell orders could be set at the bottom chart boundary. You can find more information about the Depth Of Market indicator settings in the Knowledge Base.
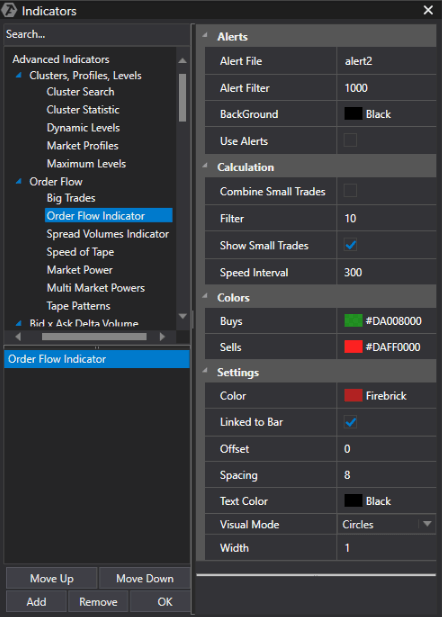
Unlike the Depth Of Market indicator, which reflects just intentions to execute a trade, the Order Flow indicator shows a flow of executed trades. The indicator clearly visualizes them in real time, taking into account the trade (buy or sell) direction, volume and price at which the trade was executed.
To turn on the Order Flow indicator:
– press Ctrl+I;
– select “Order Flow Indicator” in the list of indicators;
– press Add and then ОК.
You can find more information about the Order Flow indicator settings in the Knowledge Base.
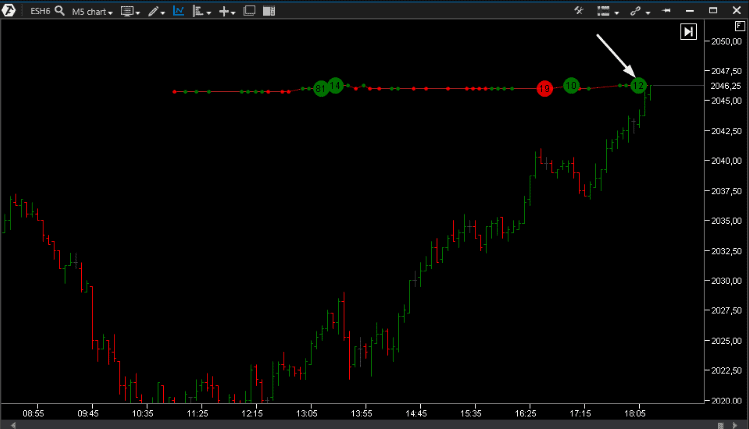
It makes sense to ask a question why some trades are marked green (buying), while the others are red (selling), since there are two interests – of buyers and sellers – in each of them. The answer is the following. The indicator marks those trades green, which were initiated by a buyer with his market order. That is, if you give your broker an order to buy at the market price, the broker will find an offsetting limit sell order for you and such a trade will be marked green. An active buyer came first and then a seller appeared.
For example, in the picture above, an arrow points to a trade for buying 12 E-mini S&P index futures contracts (SP500).
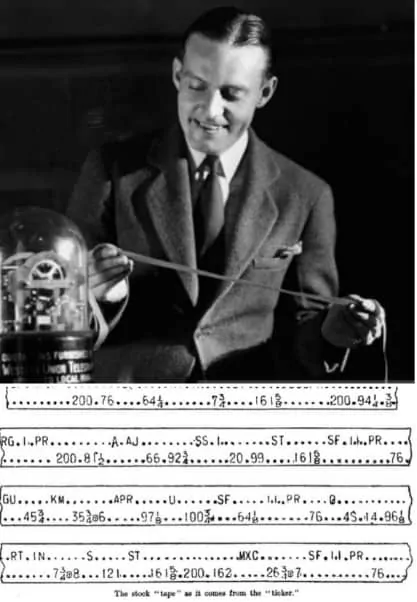
Importance of monitoring the trade flow has a long history. The Order Flow indicator can be traced from the end of the 19th to the beginning of the 20th century. That was the epoch of Jesse Lauriston Livermore, J.P. Morgan, Richard Wyckoff and other legendary exchange dealers from the Wall Street when traders received price quotes through a special device called the stock ticker. The stock ticker used the telegraph principle and printed on its tape:
1) asset name;
2) the last trade price;
3) trade volume.
Traders made huge money in those days without MACD, RSI, Moving Averages and other indicators. Ability to read the tape allowed (and still allows) building up a complete story of the struggle between the buyers and sellers as it develops on the exchange, using individual registered trades.
Every time you study the tape or chart, consider everything you see there as an expression of forces that increase and decrease prices. Study your charts not from the point of view of comparison of stock formations and behavior patterns, but from the point of view of motives of those who dominate it and successes and failures of buyers and sellers when they struggle for power at each move.
Richard Wyckoff, 1931
Due to the Order Flow indicator (or Time and Sales Tape) you can assess:
– efforts and results of activity of buyers and sellers;
– trades of major players;
– beginning of buy and sell waves, their development and culmination.
How beginner traders should read charts
You cannot start taking an engine into pieces from inside the engine. Chart reading is the same story. You should move from general to specific.
For example, first, a trader reads information from the chart using a day and week periods, taking into account an approximately one year history. This way he obtains a global understanding of the market:
- whether it is a long-term trend or flat market;
- where important resistance and support levels are located;
- what the position of the price is with respect to important trend and level lines.
All-sided analysis of day and week charts is a big-scale and important task. Indicators from a rich ATAS arsenal will help to solve it:
- search for big trades – Big Trades;
- tape speed indicator – Speed of Tape;
- Dynamic Levels – indicator, which reflects movement of maximum volumes during a set period;
- Market Profile and Maximum Levels indicator for monitoring important levels;
- Footprint cluster chart for monitoring price movement;
- and other unique instruments (in total – 60 indicators).
Having made a conclusion that the market is in a long-term descending trend, a trader switches to the hourly or 15-minute period in order to get confirmation from the chart about a correctness of his assumption and/or to find the best point of entry into a short position.
Here’s how confirmation in an intraday chart might look from the point of view of a short-term trader:
Example.
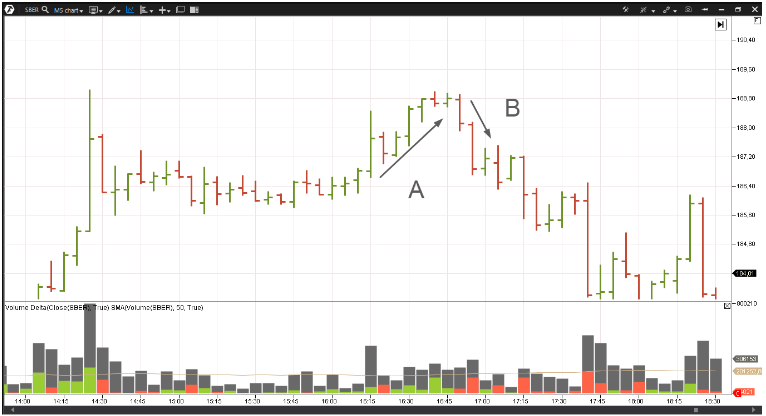
Here’s how confirmation in an intraday chart might look from the point of view of a short-term trader:
Arrows show a failure of buyers near the 188.80 resistance level close to a recent peak in the Savings Bank stock market.
- Arrow A. The buyers undertook a serious effort to break the level (it can be seen from the majority of Buy orders on the Volume Delta indicator where the general volume is higher than average), however, there was no effect. The bar ranges became narrower. The price as if abutted against the ceiling and refused to grow. It is a sign of the bearish power at the level of 188.80.
- Arrow B. A reversal took place as a logical consequence. The price reduced by 0.5% during the next 15 minutes.
How a trader should start to develop his online trading strategy
When you develop your chart reading skills, you start noticing some regularities in behavior of buyers and sellers. And then (which is logical), you have a wish to use the discovered patterns for your profit. But it is important to do it with a cool mind and avoid gambling attitude. You need a well thought over strategy for this.
It is good if you start building your strategy on the basis of understanding the real nature of the market mechanics. Many beginner traders just copy trading methods, which they find in books, blogs and forums.
Good news is that it is easy to copy a somebody else’s strategy.
Bad news is that:
- this online trading strategy might not be good for you personally due to some personal qualities – it might require high level of discipline, concentration and emotional tension;
- it requires corrections and additional developments in non-standard market situations;
- it just does not bring profit in a long-term perspective (all buy&hold strategies worked perfectly well with cryptocurrencies in the fall of 2017, but something went wrong at the beginning of 2018).
Start from understanding one simple fact – you will not make fast and easy money on the exchange. Study different strategies, avoiding those that promise a fortune in 5 minutes.
Trading is a highly competitive business. Simply to buy when a fast MA (moving average) crosses a slow one is a way to a slow but definite “discharge”, since this strategy is accessible to the majority and is not based on a competitive advantage. Why do you entrust your capital to the crossing of two lines? Can they justifiably explain why the very first trade resulted in a loss?
It is difficult to find your own ace. ATAS can help.
Before you start developing your own trading strategy, answer the fundamental question – by means of what the traders make money?
Formulate your ideology. If your profit is the result of errors of other traders, it means that you should sell when buyers make errors. And buy when sellers make errors. Who does act against whom at this moment? Why do I take the buyers/sellers side at this moment? Use the following concepts: demand and supply, strong players and the crowd, effort and result, and cause and effect.
In order to be convinced in stability of principles, study as many charts “from inside” as possible. Read interviews of professional traders between lines.
Here is a checklist of mandatory questions you should answer when building up your online trading strategy, drawn up from advice of successful traders:
- Why do I select this market? Crypto, forex, stock, commodities – what advanced knowledge and skills would help me to make money in this market.
- Why do I select namely this timeframe? Do I have sufficient time to work in this market?
- What is my plan to enter a trade? What market forces and mechanisms, which are hiding behind the price and volume values, will push the price towards me? Do I have a sufficient proof of rationality of my entry?
- What is the exit plan? How do I understand that the potential of the trade is exhausted and the market flywheel (orderly or unorderly) turns against me?
- What risks do I take? What is the size of my position, level of acceptable loss and acceptable number of failures?
- Have I formulated my trading strategy as a hard copy plan? Do I follow it? What are my mistakes and how to improve my trading?
Online trading strategy is a dynamic system, which interacts with a trader. It helps him to develop and he improves it as his professionalism grows.
What trader signals are
Let us come back to our auto topic again. What are driver’s signals? They press a horn to send a signal to other participants of traffic when a special situation emerges. The same is with the trader signals.
If the current market momentum is interpreted by your strategy as a point of entry into buying (long position), it sends you a signal: “Send your broker an order to buy 3 contracts NQ, TP = +30, SL = -10. Immediately!”.
TP – Take Profit (an order to close a trade with profit);
SL – Stop Loss (an order to close a trade with loss);
NQ – Nasdaq index futures contract.
Later, the strategy will send you a signal of a complete/incomplete exit from a trade and/or transfer of SL and/or TP.
You might not only follow this signal, but also share it with other traders. Even for money. If you built a proper strategy, which analyzes the market with the help of ATAS, notices disbalances of strength/weakness of buyers and sellers, has a well-judged risk and, as a consequence, gives positive results in a stable fashion during a long period of time – why not to sell signals?
By the way, a similar functionality is in the plans of ATAS developers. Download the latest version of the platform free of charge using this link in order to try the recent improvements of the trading and analytical ATAS platform. Get the best instrument for market analysis right now.


