Imbalance: make money regardless of the circumstances
Many exchange traders often execute trades the idea of which could be compared with buying potable water in a hot desert or selling ice on the North Pole. Sometimes it is very difficult to avoid such a situation trading in the futures market. Analysis of imbalance can help you to solve this widely-spread problem. Read this article to learn how to use this efficient analytical instrument.
A profitable buy or sell of any commodity lies in a correct choice of the market side. In order to post a futures contract buy or sell order correctly, traders need to know where the biggest volume was formed and who (sellers or buyers) got the initiative. Analysis of imbalances in demand and supply, appearing in the course of trading in the futures market, helps them in this.
We are not always free to select at which side of a trade we find ourselves in real life but we are free to do it in the futures market. We need to select the right side in an executed trade if we want to be successful in the thrilling world of futures trading.
In this article:
- Where should you start the search for imbalances from?
- How will imbalances help you to execute the best trades?
- Use imbalances to your benefit.
WHERE SHOULD YOU START TO SEARCH FOR IMBALANCES FROM?
Perhaps, some of the novices would not like the fact that major capital drives the market. Nevertheless, it is a fact and retail traders who want to have a stable income in the futures market have to open their small trades in the same direction as institutional players do.
But how to identify this direction? It is quite easy to do it if you use the trading and analytical ATAS platform which is oriented at the order flow analysis. The ATAS platform processes these data and visualizes them in the intuitively clear form, which helps traders to find aggressive buyers or sellers, who create imbalances in demand and supply, in the market.
Institutional players form big trading volumes in the market due to their big buy or sell orders. ATAS provides retail traders all opportunities for identification of strong levels of sell or buy volumes and use them for opening or closing their trades.
HOW WILL IMBALANCES HELP YOU TO EXECUTE THE BEST TRADES?
It is absolutely clear for professional traders that the volume lies in the basis of the price movement in the futures market. However, for whatever reason many retail traders never take this into account when they open trades.
The key areas of interest of the futures market participants are expressed by the biggest level of volume and its imbalance in favour of buyers or sellers. A series of big imbalances in a row forms a stacked imbalance. The trading and analytical ATAS platform provides access to these data in the form of the Bid x Ask Imbalance footprint chart in the real-time mode. You can see it below and it is not the only efficient instrument of the volume market analysis, which the ATAS platform offers to its users.
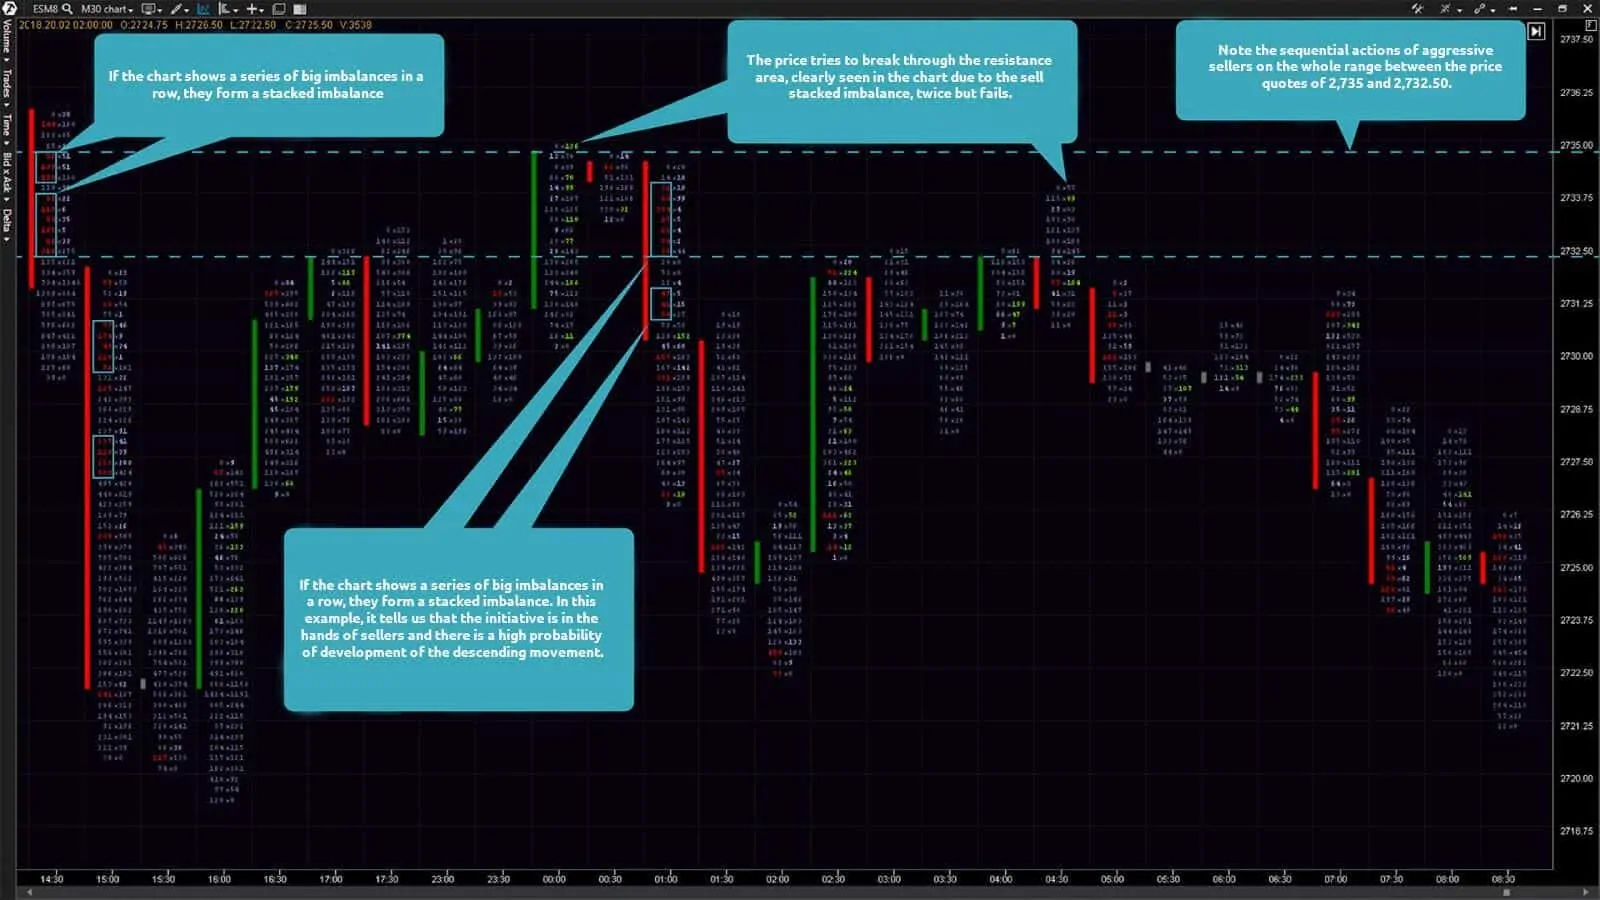
30-minute chart of an E-mini S&P 500 futures (ticker: ES). The Bid x Ask Imbalance footprint chart.
Note two big stacked imbalances on selling an E-mini S&P 500 futures, which were formed in the first 30-minute bar to the left. Several bright-red imbalances in a row immediately send us a signal that the initiative is in the hands of aggressive sellers. The next 30-minute bar demonstrates aggressive downward futures price movement, while two stacked imbalances are formed in its upper half, which tells us about serious intentions of the selling side.
Nevertheless, buyers managed to bring the price back to the initial level of aggressive sells, but they fail to push the price higher. Then aggressive sellers again take the initiative in their hands ‘biting back’ with two new big selling stacked imbalances. Of interest here is that the biggest selling stacked imbalances were formed practically on the whole range of price quotes from 2,735 to 2,732.50 and big stacked imbalances from the side of buyers are not available at all.
Let’s guess now what would, most probably, happen to the futures contract price if it comes back again into the area of interest of aggressive sellers, which was clearly marked by big imbalances already twice? Correct. Most probably, it would meet new resistance and move down. That is why it could be a good trade for us to sell a futures contract. When the price fails to break the resistance level for the second time, it falls down realizing our trading idea with the lowest risk.
Namely that is why a possibility to identify areas where a big volume of buys or sells passed earlier is one of the most important factors of successful trading in the futures market. The change of volume always comes before the change of the price, which is beyond understanding of the majority of retail traders. Although, it is easy to check it if you download the ATAS platform for free using the link at the beginning of the article and open the chart of the instrument you trade.
However, if you still have doubts with respect to the efficiency of such an indicator-free approach to the market analysis, let’s have a look at one more example but with another futures contract and another timeframe.
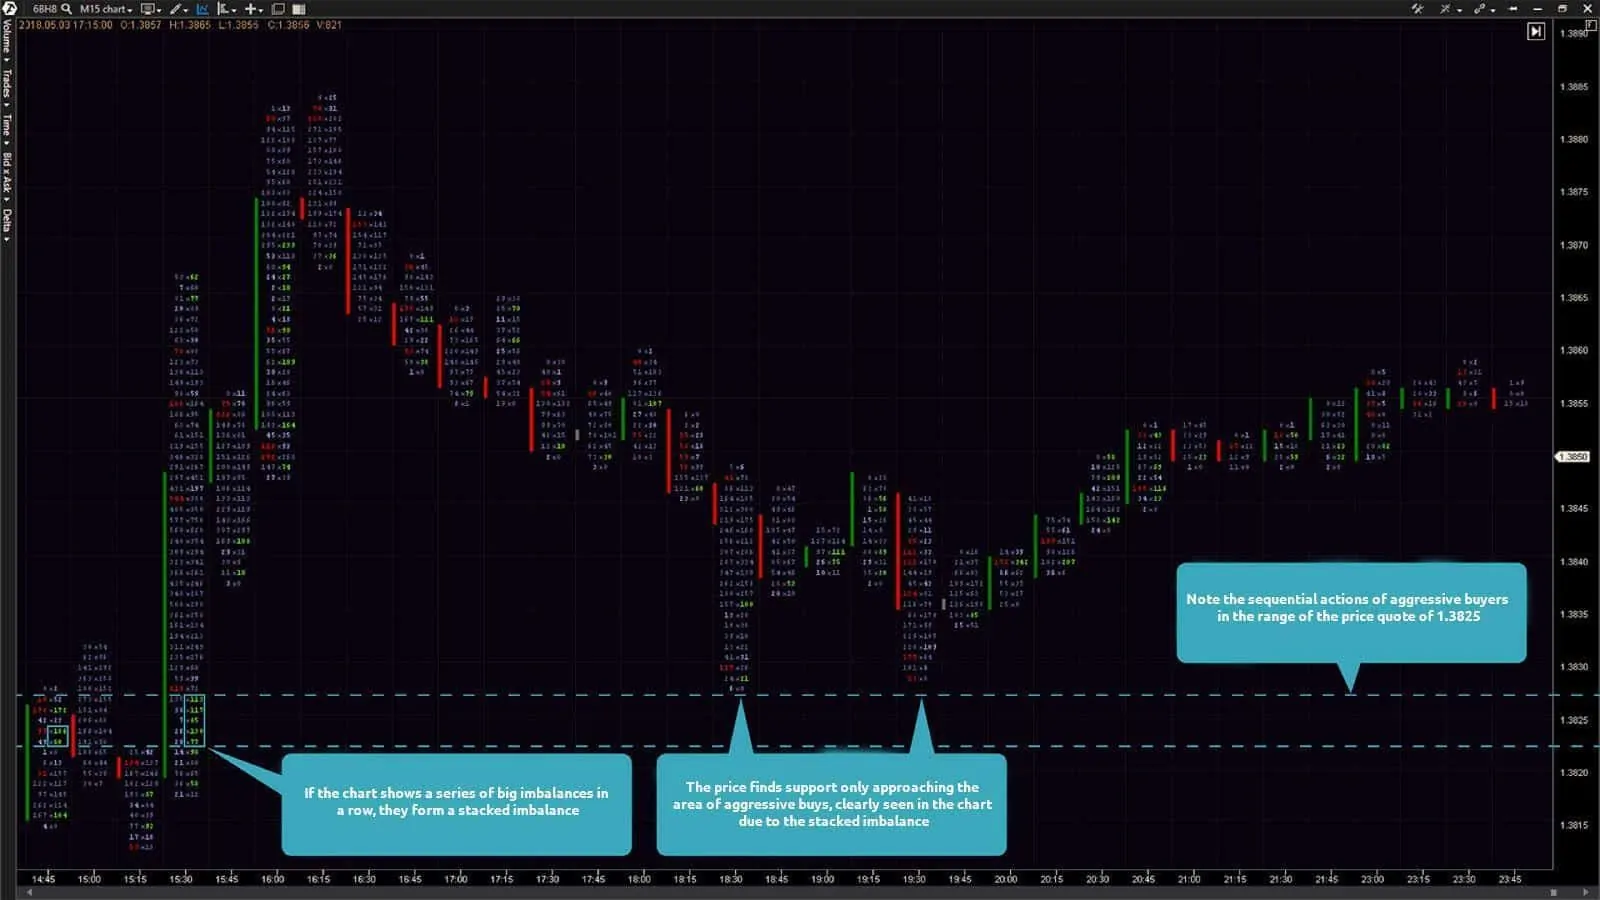
15-minute chart of a GBP futures (ticker: 6B). The Bid x Ask Imbalance footprint chart.
You can see in the chart above how quickly the ascending movement of a GBP futures contract develops. However, should you chase the price which quickly runs away? Of course, not. Let’s behave like professional traders and try to find a big stacked imbalance, which was formed by aggressive buyers, in the Bid x Ask Imbalance footprint chart of the ATAS platform.
The search didn’t take much time and a big stacked imbalance we were looking for turned out to be right in the lower part of the growing 15-minute bar. We know that a big buying stacked imbalance sends a signal about a serious interest of the buying side that is why we should be patient and wait for the price to come back to this area. The goal of our waiting is to get the best price for our trade with the lowest risk. The GBP futures price starts to be corrected after an upward impulse and, as we expected, comes back directly to the area of aggressive buys. Now we just need to execute a trade and take the profit a bit later.
The price has always been an important factor in the market analysis, however, the imbalance in demand and supply and big volume are those factors that move the price in one or another direction. You would hardly wish to use your trading account for selling ice on the North Pole or buying expensive water in a hot desert. The Bid x Ask Imbalance footprint chart will help you to avoid such situations and trade at the right side of the market together with professionals. Let someone else, less informed about what takes place in the market, buy ‘water’ from you at the price of ‘gold’.
USE IMBALANCES TO YOUR BENEFIT
Today we’ve considered the use of imbalances both under conditions of the market consolidation through the example of an E-mini S&P 500 futures and under conditions of its focused movement through the example of a GBP futures. It is extremely important to detect imbalances in the chart as soon as possible since imbalances in demand and supply, as well as traded volumes of futures contracts, lie in the foundation of the futures market movements.
The Bid x Ask Imbalance footprint chart of the ATAS platform will show you where exactly imbalances were formed and how big their volume is in a convenient form. This, in its turn, will allow you to find the areas of interest of institutional players and identify the future market movement direction with a high degree of probability.
Retail traders should understand that the small trades they execute are not able to move the market in the desirable direction. Nevertheless, they are able to open their trades in the same direction as institutional players do if they use the instruments of the advanced volume analysis of the ATAS platform. The use of the Bid x Ask Imbalance footprint chart will help you to avoid the destiny of a trader who buys water in a hot desert or sells ice on the North Pole.


