FEATURES OF THE GOLD FUTURES AND INTRADAY TRADING IDEAS
Do you know about one incredible opinion of Australian scientists that the gold is formed from water under the impact of earthquakes? However, according to other sources, the gold have accumulated on the Earth from fallen meteorites. How then the gold got into our bodies, since there is 0.2 milligrams of gold in each of us?
Whatever the nature of this unique metal is, the gold has always had a special meaning during the whole history of mankind. The gold has never lost its value from the time of appearance of the first golden coins (in 560 BC in Lydia) and for this reason there is a permanent demand on it among investors and traders.
This article is about how to get profit from operations with the most popular exchange instrument for gold trading – a futures contract.
What are futures in the first place? Read about futures in this article.
GOLD IN THE WORLD TRADE
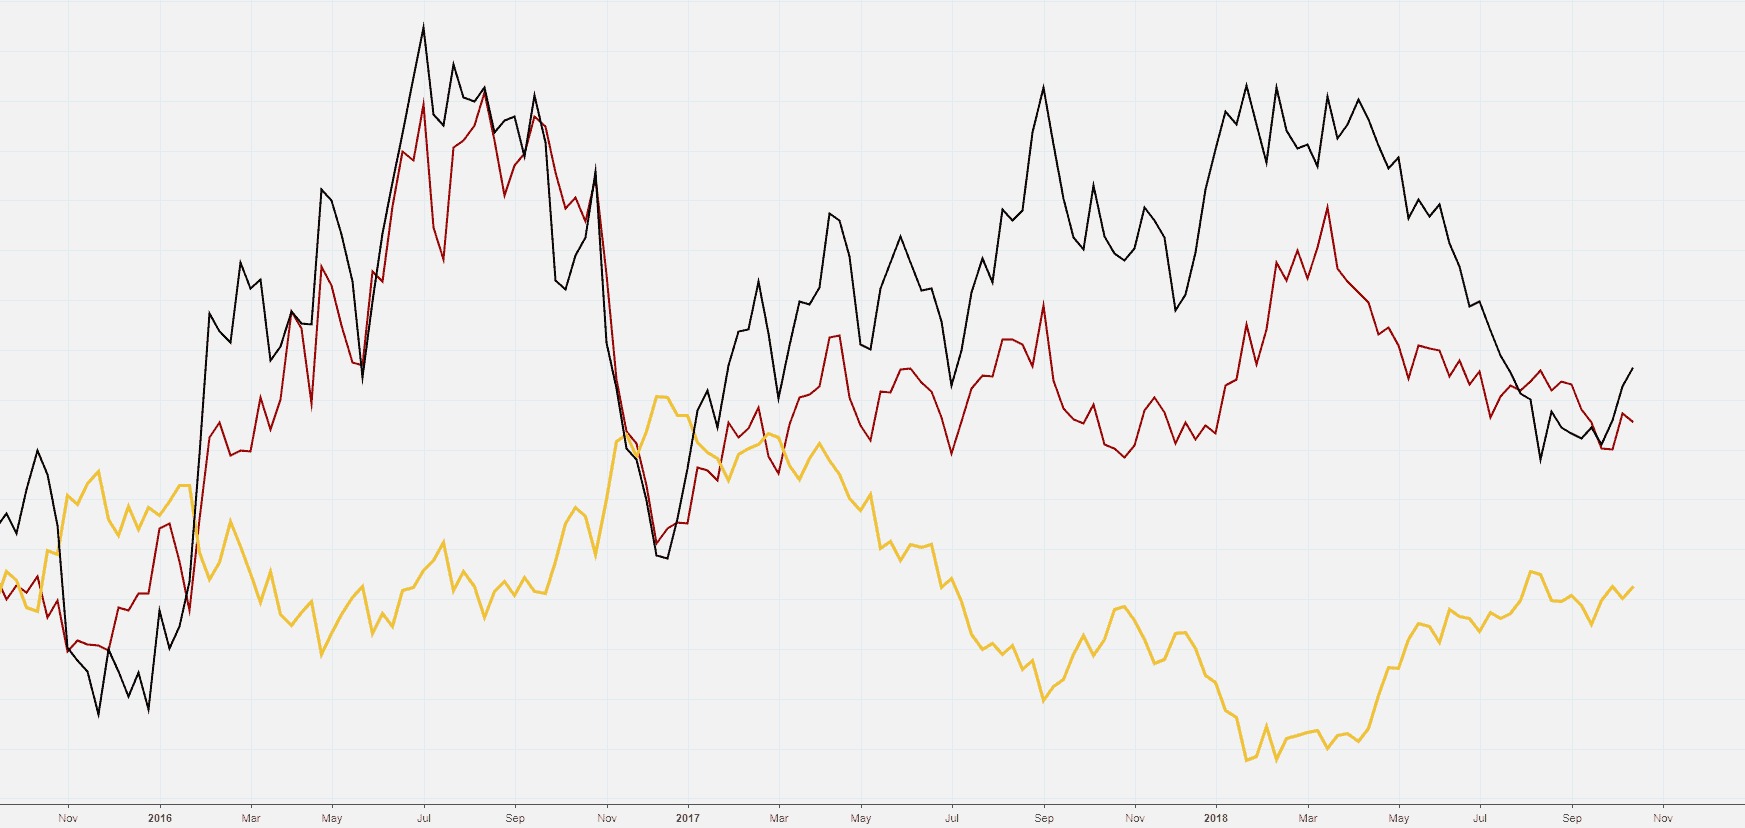
Importance of gold in the world markets and its reaction to important events make it a popular and liquid instrument at the global level. Gold is widely used as a protection from inflation and is considered to be a secure shelter in the times of financial uncertainty. The chart below confirms it:
- Black like is the USD index.
- Red line is the JPY index.
- Yellow line is the gold price.
Note that falls of currency indices correlate with the increase of the precious metal price. This means that when cash loses its attractiveness, investors prefer to go into the shining of the “eternal value”.
WHERE TO BUY/SELL GOLD?
Let us consider two methods, having excluded jewelry shops.
- Buying/selling gold in a bank.
- Trading gold futures contracts in the forward market.
Method 1. Buying/selling gold in a bank
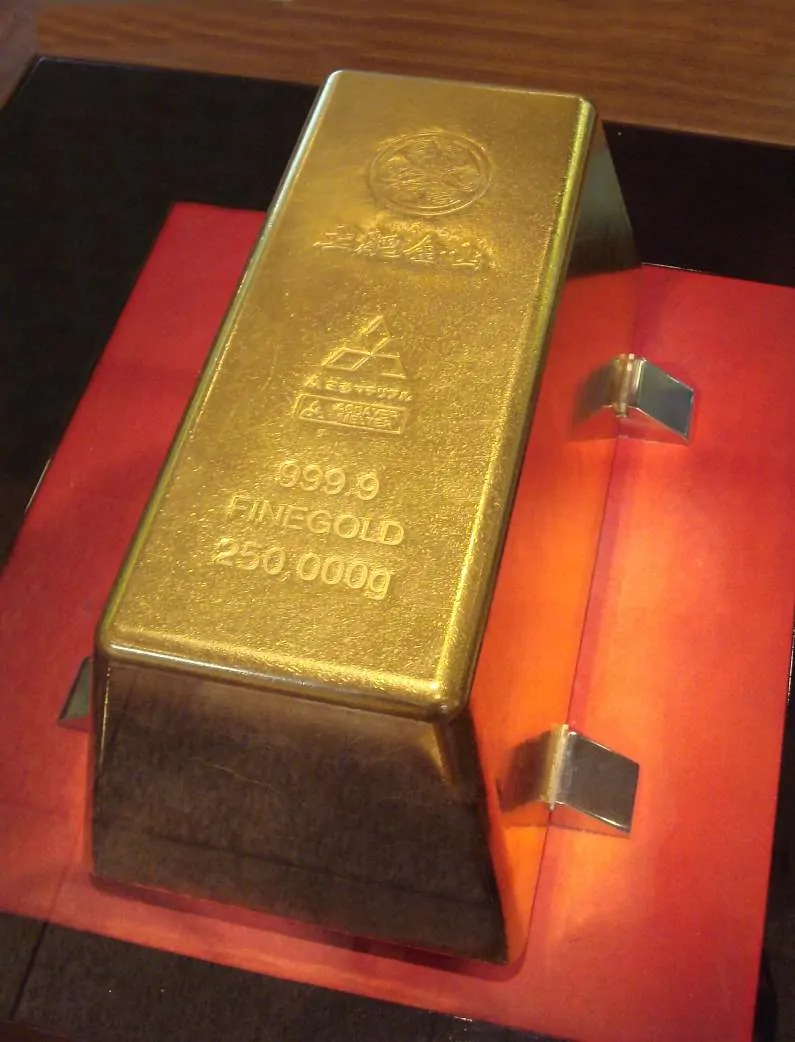
In major branches of major banks a client can buy physical golden coins and bullions of 24K gold of 1 gram to 1 kilogram of weight. By the way, the biggest bullion in the world weighs 250 kilograms. It is not for sale, but it is open for seeing in the Toi Gold Museum in Japan.
People buy banking gold bullions as a traditional method of diversification at a long-term capital storage, which insures against currency exchange rate fluctuations and surges of inflation.
Let us assume that you keep track of the exchange quotations on gold on a day/week period. If we ignore the gold price “dive” to the level of USD 1,130 in December 2016, the price of the yellow metal is stably above USD 1,200 an ounce.
And when in August 2018 the price goes down to the USD 1,180 level, you decide to buy gold at this attractive price. You go to the bank, spend your savings made from your salary to buy bullions, bring them home and sleep like a baby. The personal gold-and-currency reserve protects your sleep.
By the way, where do the physical gold bullions in the bank branches come from? Have you heard about gold fixing? Or about the London Bullion Market?
Traditionally, London is the world capital of gold trading. Physical bullions from only very few proven suppliers are traded in the London Bullion Market. Market operators are just 5 major international banking giants, such as HSBC, ICBC Standard Bank, JP Morgan, Scotiabank and UBS. And only through these banks the gold bullions of proven producers arrive to the bank branches somewhere in your city.
According to gold.org, the volume of gold trading in the London Bullion Market is about 70% of the world trade of precious metals.
The New York Comex exchange is on the second place and the Shanghai exchange is on the third. The Moscow Exchange is among leaders. All of them trade gold futures.
So, now we will speak about gold futures trading in more detail.
Method 2. Trading gold futures contracts on the forward market
If you consider gold not in the form of physical bullions for a long-term protection of savings, but as an instrument for making money through active exchange trading, then you choice is the Gold Futures. This derivative practically completely copies the course of the physical gold price and is used by traders all over the world for making profit from the yellow metal price fluctuations.
We are ready to assume that a reader, when planning to trade gold futures contracts, would select one of the two exchanges in 99% of cases.
1. Comex. The New York COMEX (Commodity Exchange), where silver, copper and aluminum are also actively traded. This exchange operated independently from 1933, it merged with NYMEX in 1994 and these two merged exchanges became a part of the global CME Group structure under the aegis of the Chicago Board of Trade.
The range of gold futures on COMEX includes standard contracts (100 ounces), E-mini (50 ounces) and E-micro (10 ounces), providing the market participants a flexibility and choice in risk management. According to the CME Group, the average volume of gold futures trades on COMEX is about 270,000 contracts a day in 2018. The minimum deposit for trading on COMEX is about USD 250. For this amount you can buy 1 E-micro Gold futures contract without the right to postpone to the next day.
2. Moex. The Moscow Exchange started to trade gold futures in October 2013.The trading volume is about RUB 5 billion a standard day in 2018. In order to start the gold futures trading, one needs to have the minimum deposit of less than USD 100 for providing a guarantee collateral for operations with 1 contract.
As we can see from the size of the minimum deposit, the gold futures trading on the Moscow Exchange is more affordable. This difference becomes more evident when we continue to compare exchange commission fees and brokerage fees. A COMEX advantage is a big volume of liquidity. If you do not plan to deal in major orders, consider the Moscow Exchange. However, every person has the right to make own choice.
GOLD FUTURES TRADING STRATEGIES
Such classic strategies of gold futures trading as the moving average cross (MA Cross) or exit of RSI from the overbuying/overselling area would hardly give you an advantage for trading in this competitive market.
In order to increase efficiency of your trade, it is necessary to conduct an in-depth analysis of the market based on the actual data, namely – volumes of buying and selling in combination with the price dynamics. We speak about the cluster analysis.
Example
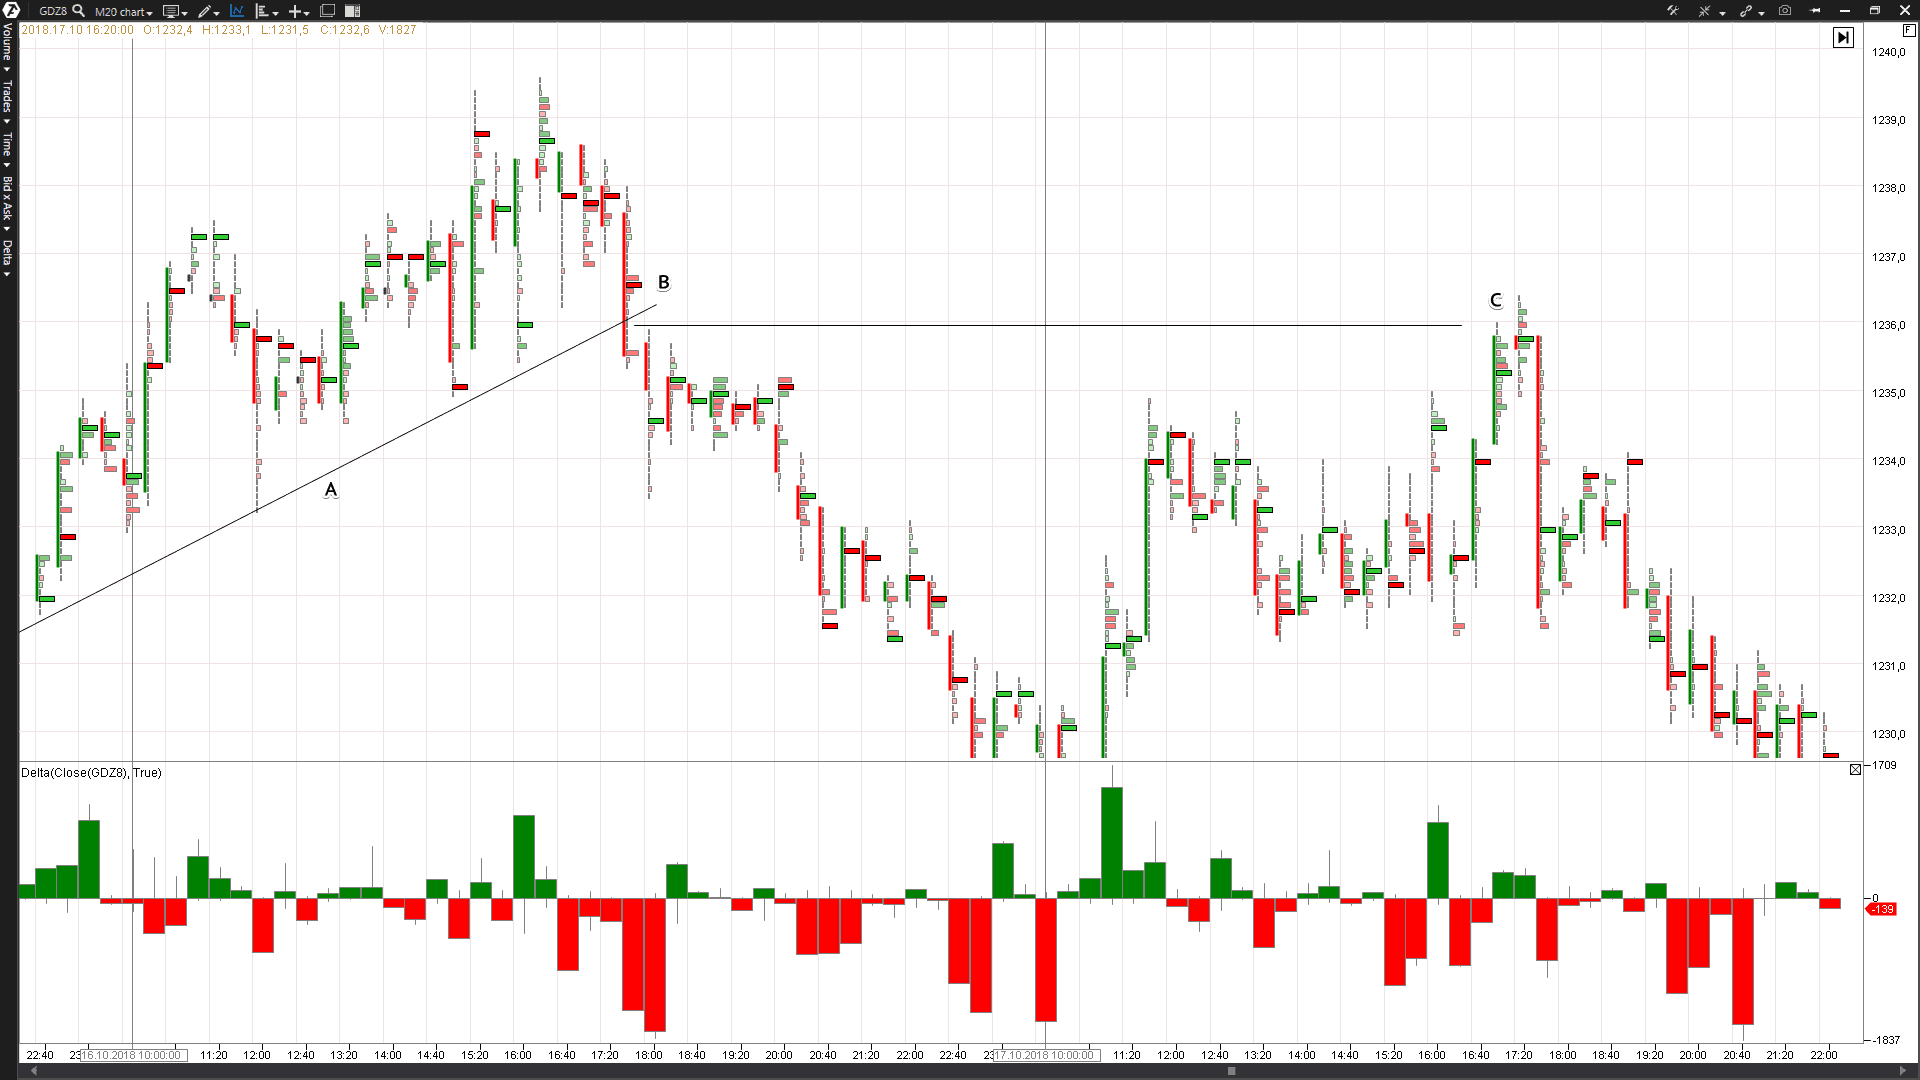
The screenshot from the trading and analytical ATAS platform shows a cluster chart of the forward market with the GDZ8 futures code (a gold futures contract with the date of expiration in December 2018).
The chart period – 20 minutes – is not quite standard. By the way, ATAS provides a possibility to set practically any timeframe. For example, 45 seconds or 25 ticks. An absolute flexibility and easiness of settings for a user is a distinctive feature of this platform.
The chart shows the course of trading on October 16-17. The Delta Indicator computes a difference between buying and selling the contracts. Let us analyze events of October 16.
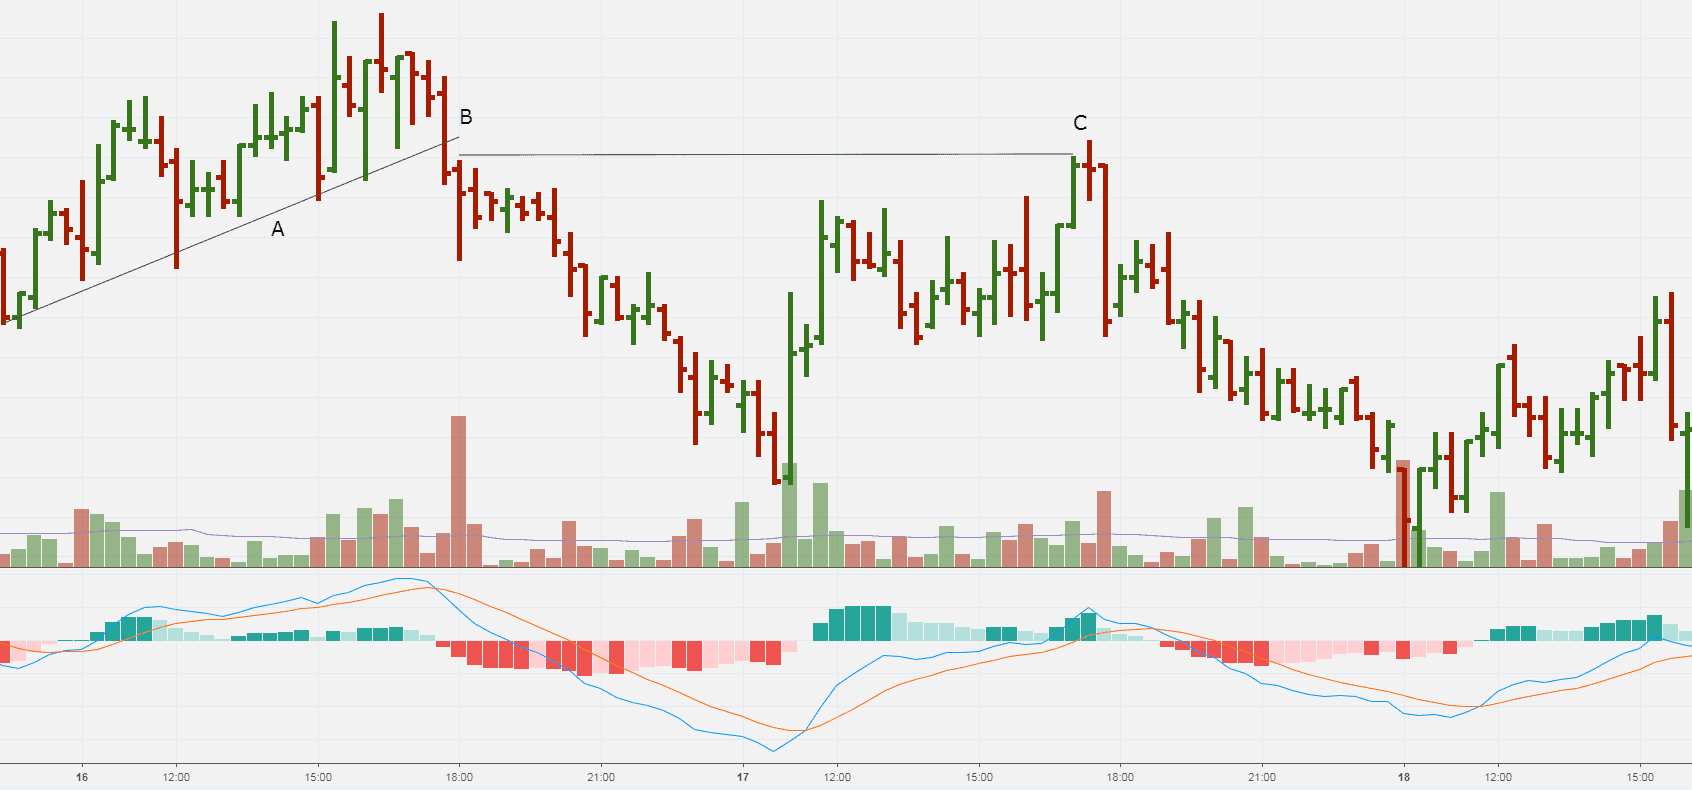
The market opened that morning at the price of RUB 1,234 a contract. Starting from that moment, a gold futures contract was traded with a positive dynamics, receiving support from the “A” trade line (built on local lows on October 17-18).
However, closer to the end of the main session, the price broke the “A” support line and the evening session was closed at the RUB 1,230 level.
Let us assume that we analyze the gold market in the morning of October 17 and build a plan for the coming session. In view of the previous behavior of the price, bears can enter October 16 on their credit side, since they not only managed to break the local line of the trend during the day, but also to close the trading at the lower price than the opening price.
That is why, in view of the fact of the bearish behavior, we make a tactical conclusion that it is more logical to look for selling opportunities on October 17. An interesting question arises: at what level should we short gold?
The cluster analysis and Delta Indicator come to the rescue here.
Let us look into the breaking point “B” before the price of the gold futures contract broke the trend line “A”:
- Firstly, the Delta Indicator shows the increasing pressure of selling (growth of red bars in the lower area of the chart during 17:00-18:00);
- Secondly, note the “red bulge” at the RUB 1,236.5 level in the 17:40 cluster. This was the moment when the sellers applied nearly maximum forces to break the intraday tendency. They will be protecting this level for sure and the increasing price will face resistance here.
This tactics turned out to be sound. The “C” moment – in terminology of the classical technical analysis – is a test of the breakout level. This test formed a local high and gave us a possibility to open a short pursuant to the previously developed plan. Note the brightness of green clusters on the “C” peak before the price went down. The green color of the clusters means buying. But why did the buyers’ activity result in a surprising decrease of the price?
Perhaps, the burst of the buying activity, colored green, is:
- Buying by many minor and weak traders who emotionally opened longs on the background of the breakout of the previous local highs of the day. “Hurry to buy before it’s late!”;
- Activation of stop losses of the sellers who opened longs the day before on the breakout of the “A” line.
Both these forces are not a real pressure of major traders, which is capable of pushing the price to new highs.
Thus, for a cluster reader, the price movements become clearer, more logical and, as a result, more foreseeable.
As a comparison, below is the same chart but from another platform. Just a bar chart with the standard MACD indicator, which, by the way, recommends buying in the “C” point. Can you read the story, described by the clusters, in a standard chart, used by majority of traders (be it noted that the majority always loses)?
As they say – not all that glitters is gold.
Does the described cluster analysis work for searching for entering longs? Is the described approach applicable to gold futures only or it is also relevant for other markets?
Download ATAS and get all answers in a cluster chart.
In as little as 5-10 minutes after installation you will get an advantage for reading the market situation, analysis of buying and selling and search for entering the futures and other markets with a low level of risk.
Here is one more article, which would give you another portion of useful information: THE STRATEGY OF USING A FOOTPRINT TAKING GOLD AS AN EXAMPLE.

