We wrote in the How ATAS volume analysis instruments help to identify the trend absence/weakening article how important it is to have a clear understanding of the current market state in order to increase chances in your favour. If the market fluctuates within a ‘corridor’, the breakout setup trading brings growth of risks.
Consequently, if there is a disbalance of buyers and sellers in the market, a trend emerges, which would last until demand and supply become even.
We will speak about the trend stage in this article:
- What a trend is?
- How to identify it with the help of volume analysis?
- What instruments / indicators could be applied?
- Chart examples.
What bullish and bearish trends are
- A trend or directed price movement is a long-expected time for many traders. There is a clear tendency in the market at this time and either bulls or bears win.
- What does a bullish trend mean? It means that the market grows.
- What does a bearish trend mean? It means that the market falls.
There is a well-known rule – ‘The trend is your friend’. The main problem is that a trend is clearly visible after it already has been formed.
It seems very simple – you should buy here and sell there, however… You can clearly see a trend on historic data only. The majority of traders can see a trend when it has already been formed and is approaching its end. They try to catch the departing train and often make losses.
So, how to learn to identify the bullish and bearish trends using the ATAS volume analysis instruments? Let’s consider 5 ideas.
Idea 1. Volume profile and maximum horizontal volume for a day.
When there is a trend, we can observe consecutive movement of the day’s horizontal volume with respect to the previous day. The maximum horizontal volume moves up, when there is a bullish trend, and down, when the trend is bearish.
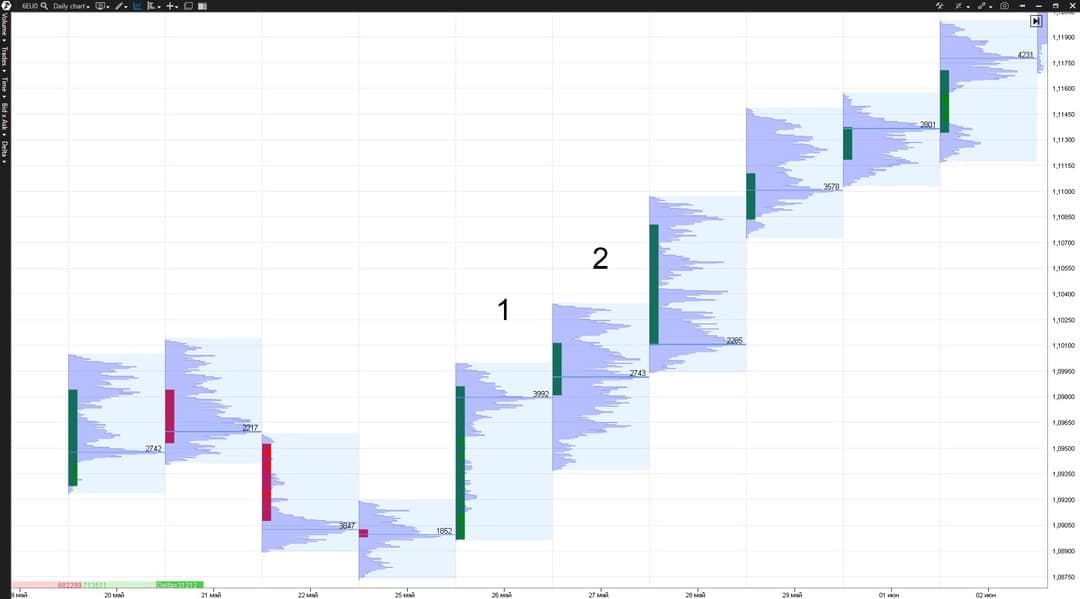
The above chart shows the Footprint of the daily period from the euro futures market (CME data). We will use this market with similar settings in our further examples.
The day marked 1: a sharp up movement of the maximum horizontal volume took place and this movement went higher than the maximum volumes of several previous days. The uptrend beginning could have been forecasted on the basis of this fact.
The next day, marked 2, confirmed the uptrend beginning, since yet another up movement of the maximum horizontal volume took place.
Idea 2. Volume – vertical volume
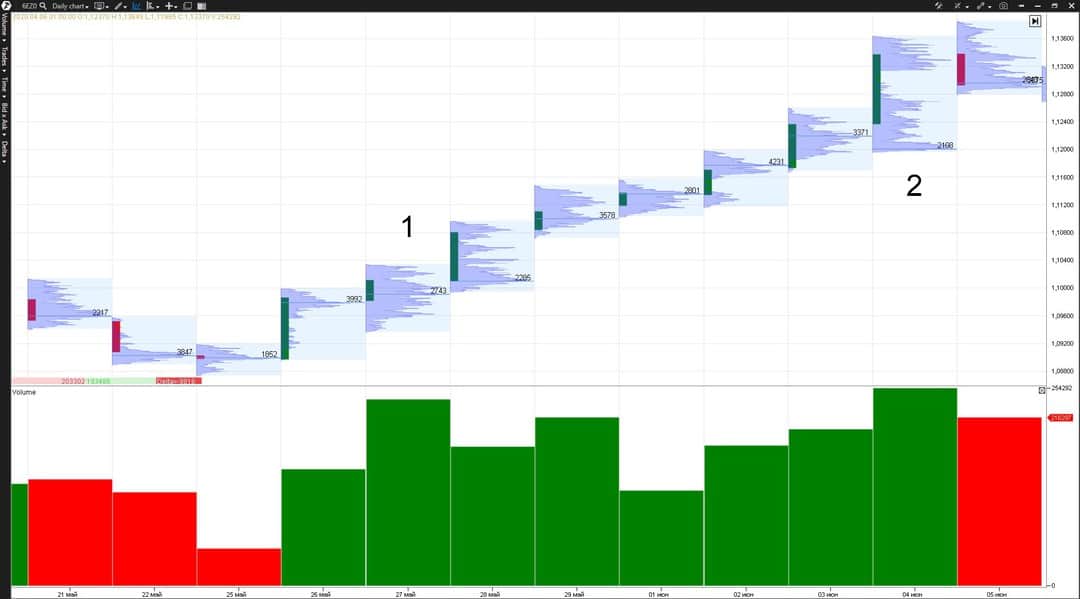
The trading volume falls when there is a winner in a trend and the market maker leads the market to new highs and lows on small and average volumes.
What happens after the price passes a significant distance and the trend becomes visible to the majority of market participants? Trading volumes increase and this is often a sign of the coming end of the trend or a reversal pattern of the bullish trend.
Idea 3. Delta – the difference between buys and sells
When there is a trend, you can often observe the similar (positive or negative) delta of several trend days in a row. If the delta changes to the opposite one during a trend, it may testify to the change of the market mood and, consequently, the probable trend’s end.
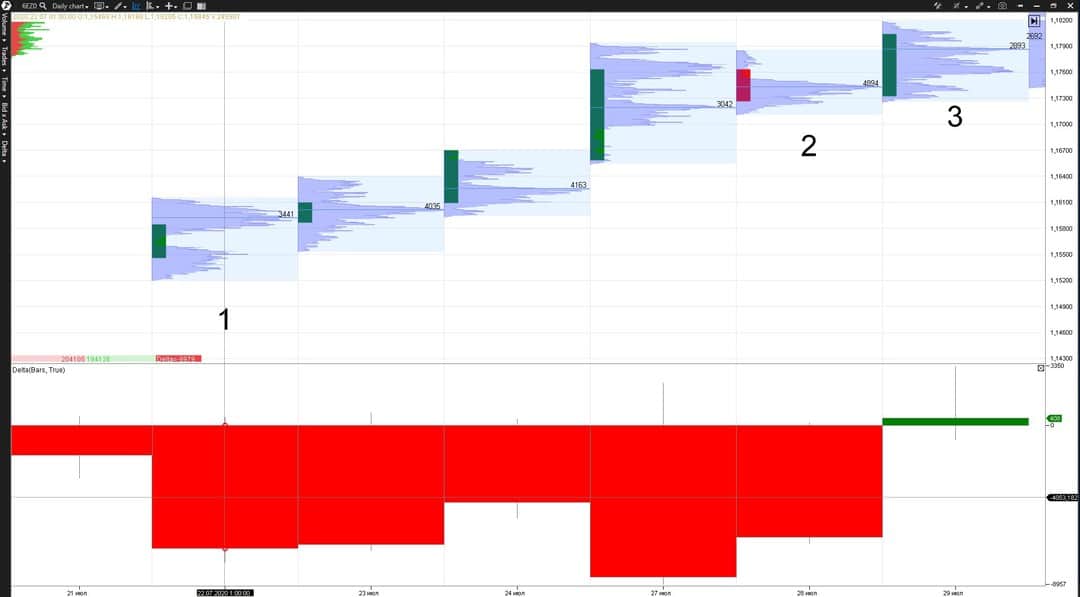
Why did the price increase on the negative delta in this example? Perhaps, because major limit order players took out the complete negative delta and moved the price up.
Idea 4. Candlestick pattern. Day closing.
You could often observe predominance of trend candles in a trend. A trend candle is a candle, which body is bigger than shadows.
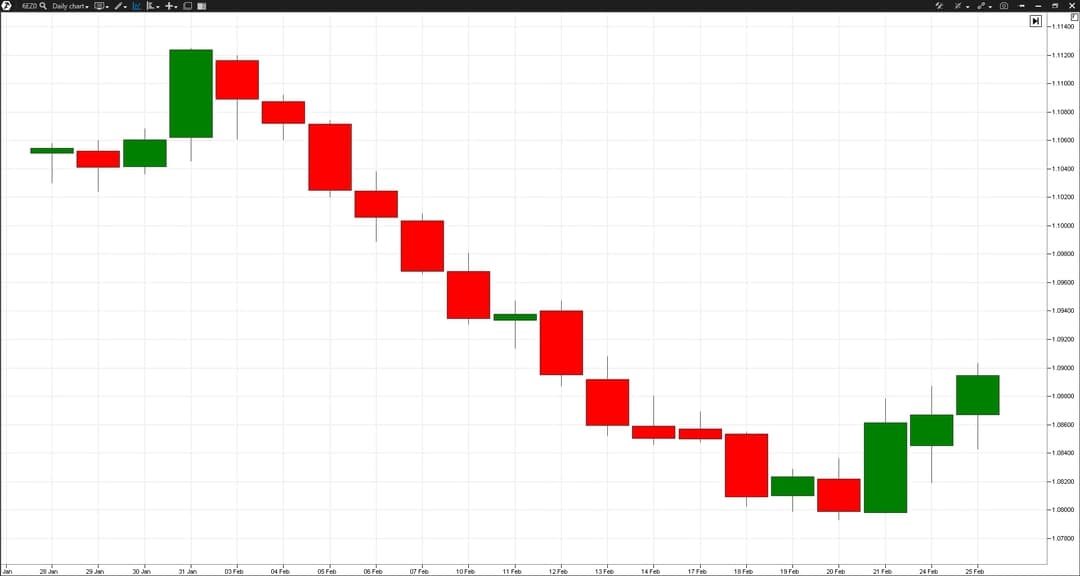
It is quite the opposite in the uptrend. Violation of the consecutive day closing in one direction tells us about the trend weakening and its possible completion.
Idea 5. Day’s extreme points
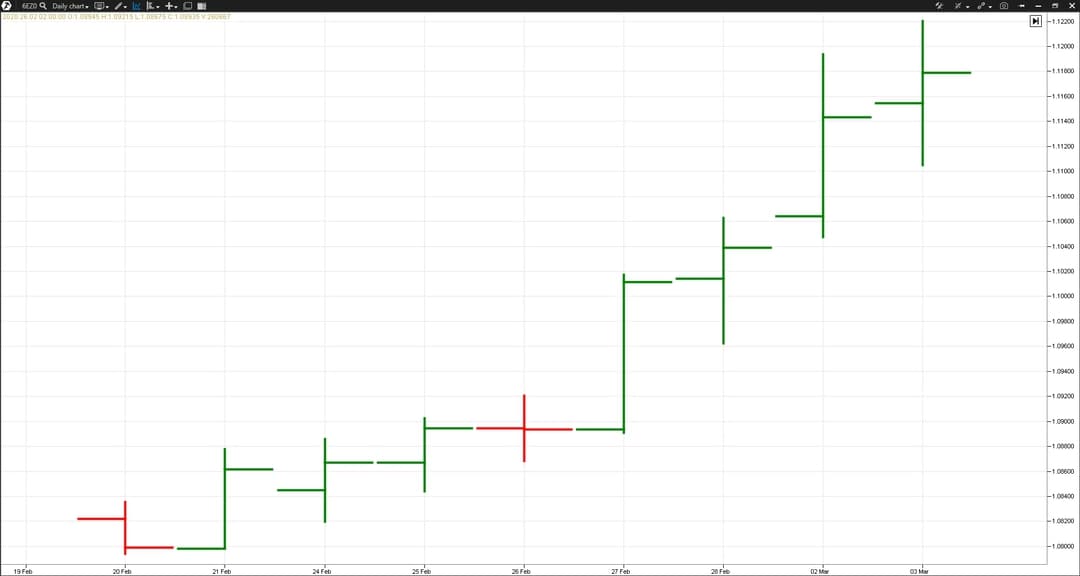
The standard identification of the uptrend are increasing highs and lows. The downtrend shows decreasing lows and highs.
How to use understanding of the market state in trading
So, what should be done in practice?You should start your trading day with identification of the current market state.
A ship captain does the same. He needs to look at the sky in the morning to understand what the weather is like, which way the wind blows and how strong it is.
The same is true about a trader, who shouldn’t immediately look for buying or selling opportunities. First of all, he should understand what would be most efficient to do today and what trades would have a higher probability of making a profit.
- If there is a flat, you can safely both buy and sell. You can trade in accordance with flat trading systems, which show good results in flats. There is no sense to use trend trading systems, since the potential of making a profit reduces while there is a balance in the market. Trend systems may bring significant losses when the market is flat. And the flat market may last for several days or even weeks.
- If there is an uptrend, selling in such a market means to increase the probability of making losses. The trend is the trader’s friend. Never trade against the trend since the probability will not be on your side. When there is a trend, you should use trend systems, which goal is to take a big profit and strong movements in the market facilitate it. However, you may also use flat systems during a trend, the most important thing is to open trades in harmony with a trend.
- If there is a downtrend, look for sells. The downtrend often has higher volatility and potential than the uptrend, since the prices fall faster than grow. Presumably, it is connected with the fact that fear is the strongest human emotion.
Add an additional section ‘Identifying the current market state’ to your trading system, and the subsequent trading system rules should take into account various market states and adapt to them. It will give you a possibility to minimize losses and maximize profits, since you will act in harmony with the market.
Conclusions
You should apply the market state volume analysis for profitable trading. It will allow you to learn the current market state and will insure you from trading against its mood. Traders (especially beginners) need to:- fight for a higher PROBABILITY of a profitable trade than a loss-making one. Trend trading gives a possibility to increase this probability;
- start a trading day with identification of the current market state, using volume indicators of the trading ATAS platform;
- both sell and buy when the market is flat but do not use trend trading systems;
- only buy when there is an uptrend in the market;
- only sell when there is a downtrend in the market.
Correct understanding of the current market state will help you to make even simple trading strategies profitable!
Information in this article cannot be perceived as a call for investing or buying/selling of any asset on the exchange. All situations, discussed in the article, are provided with the purpose of getting acquainted with the functionality and advantages of the ATAS platform.


