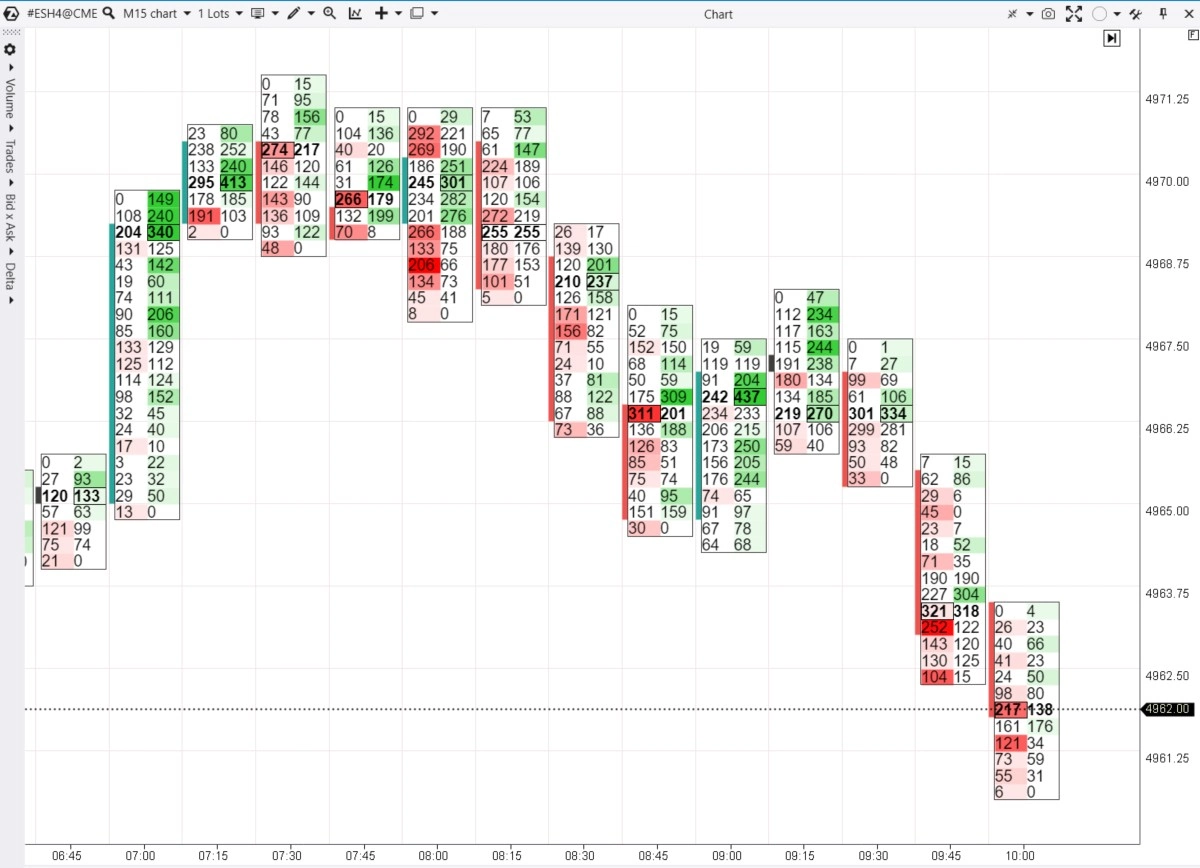
Initiating trades drive the price to a point where a trade that satisfies both sellers and buyers can occur. If supply exceeds demand, the price can only go down where it will meet reacting buyers.
At higher levels, supply exceeds demand, and new buy orders can be satisfied with slightly higher limit orders. Here, the activity of participants who were pushing quotes upward sharply decreases.
The upward movement will stop once demand for the asset is satisfied by supply. Trading is ready to enter a flat phase, i.e., sideways fluctuations without clear trend movements, when new participants cannot absorb the assets offered at the top.
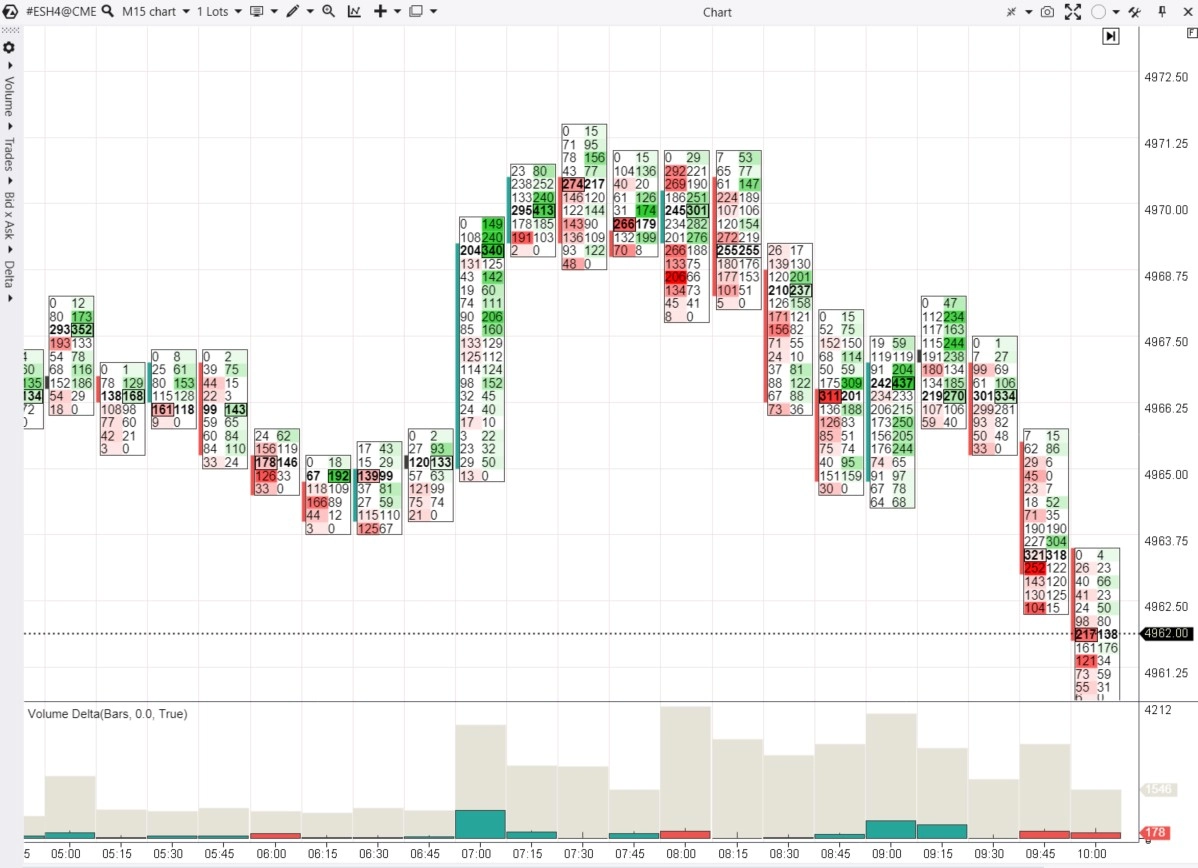
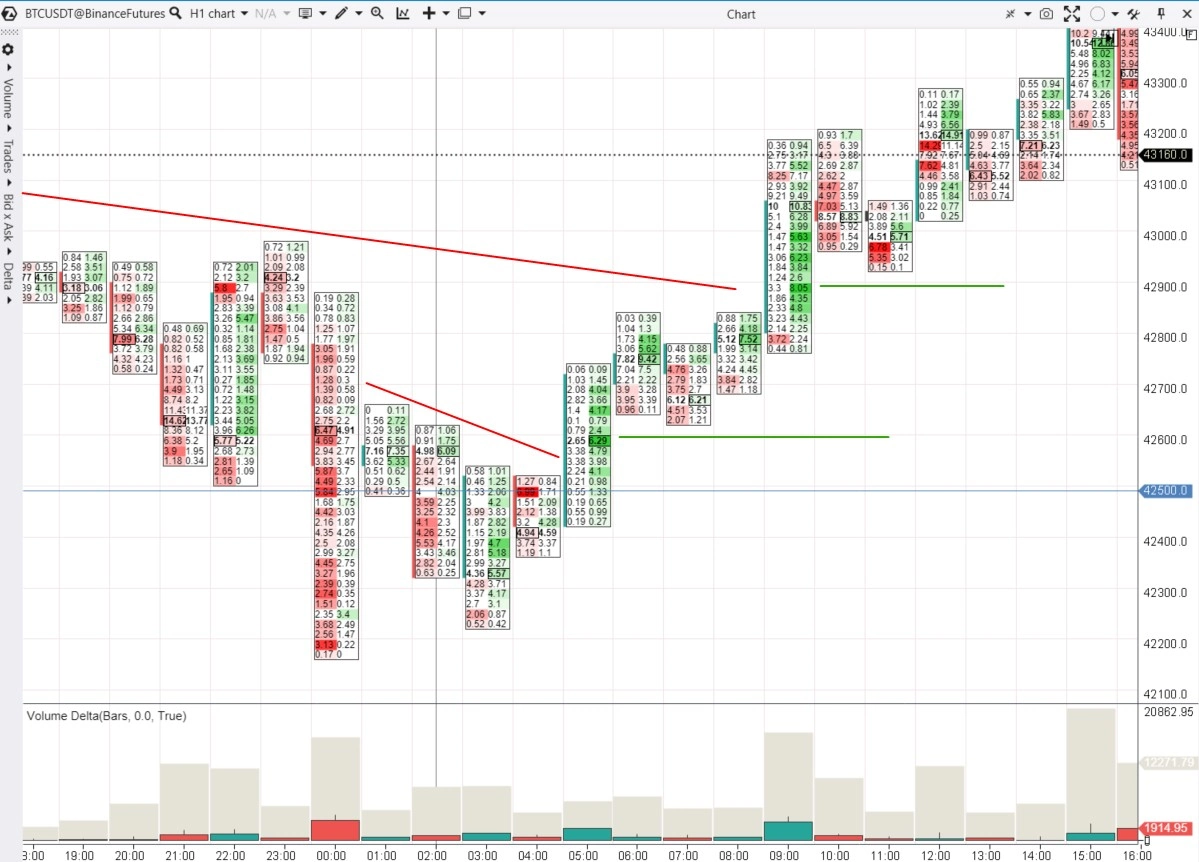
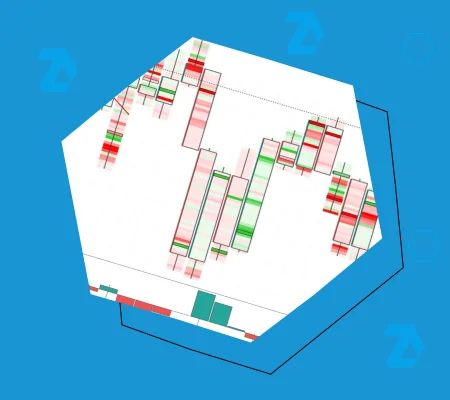
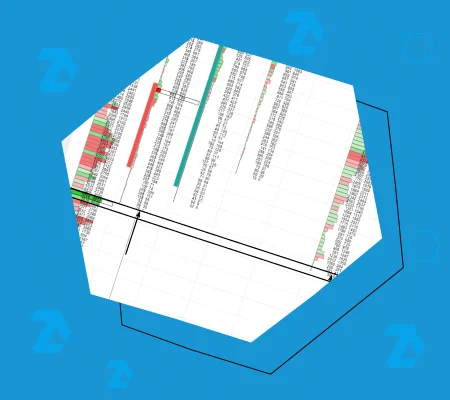
The footprint will indicate that the initiative is shifting towards sellers, as the volumes of trades on the ask side are lower than the executed bid orders. There will be no resistance in case of a level breakout. Trading operations will take place within a certain zone – a channel.
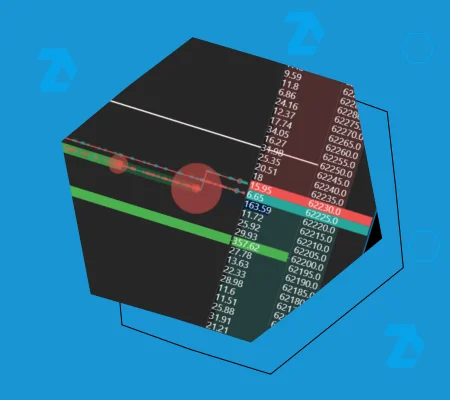
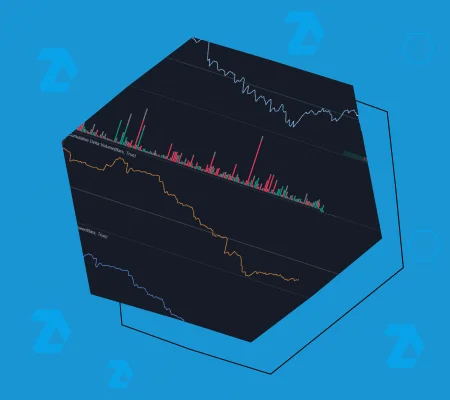
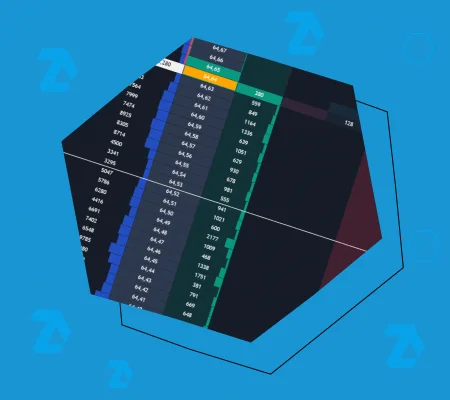
Limit orders that are placed at a certain level can stop the movement. The reason for this movement, however, is market orders that are displayed on the Smart Tape.
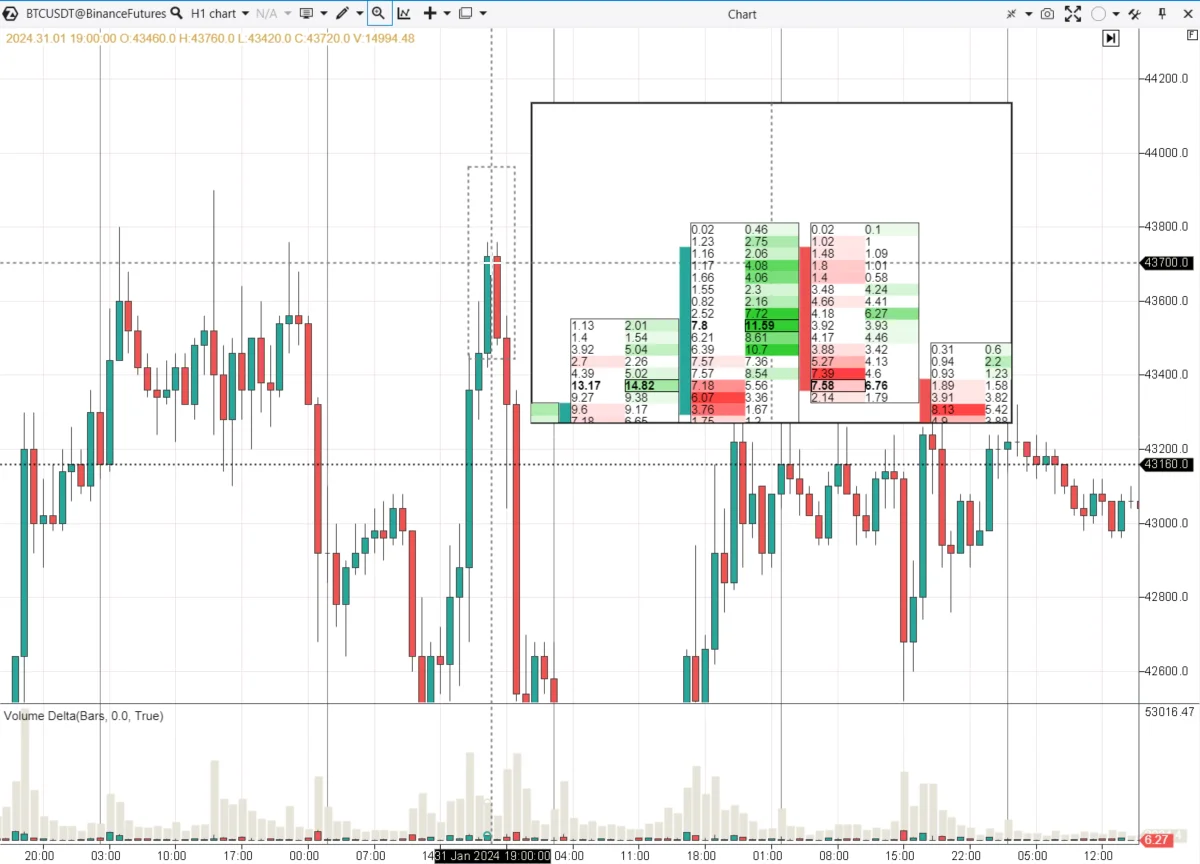
A substantial volume emerges at a level where bulls and bears meet, which means that significant two-way trades are made. This unveils the fair price towards which the market was moving.
Only a new imbalance in supply and demand will make the chart initiate a new movement.
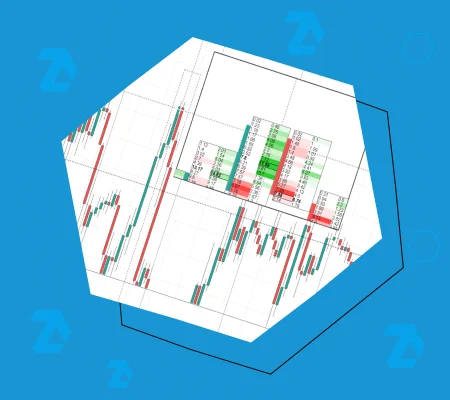
Asset quotes move in a specific direction due to market orders. While limit orders have the potential to stop this movement. It is important to pay attention to the highest volume in the bar at the moment of their execution. Stops and reversals occur at crucial levels in areas where significant volumes accumulate.

