How to find low-risk entrances using OI Analyzer
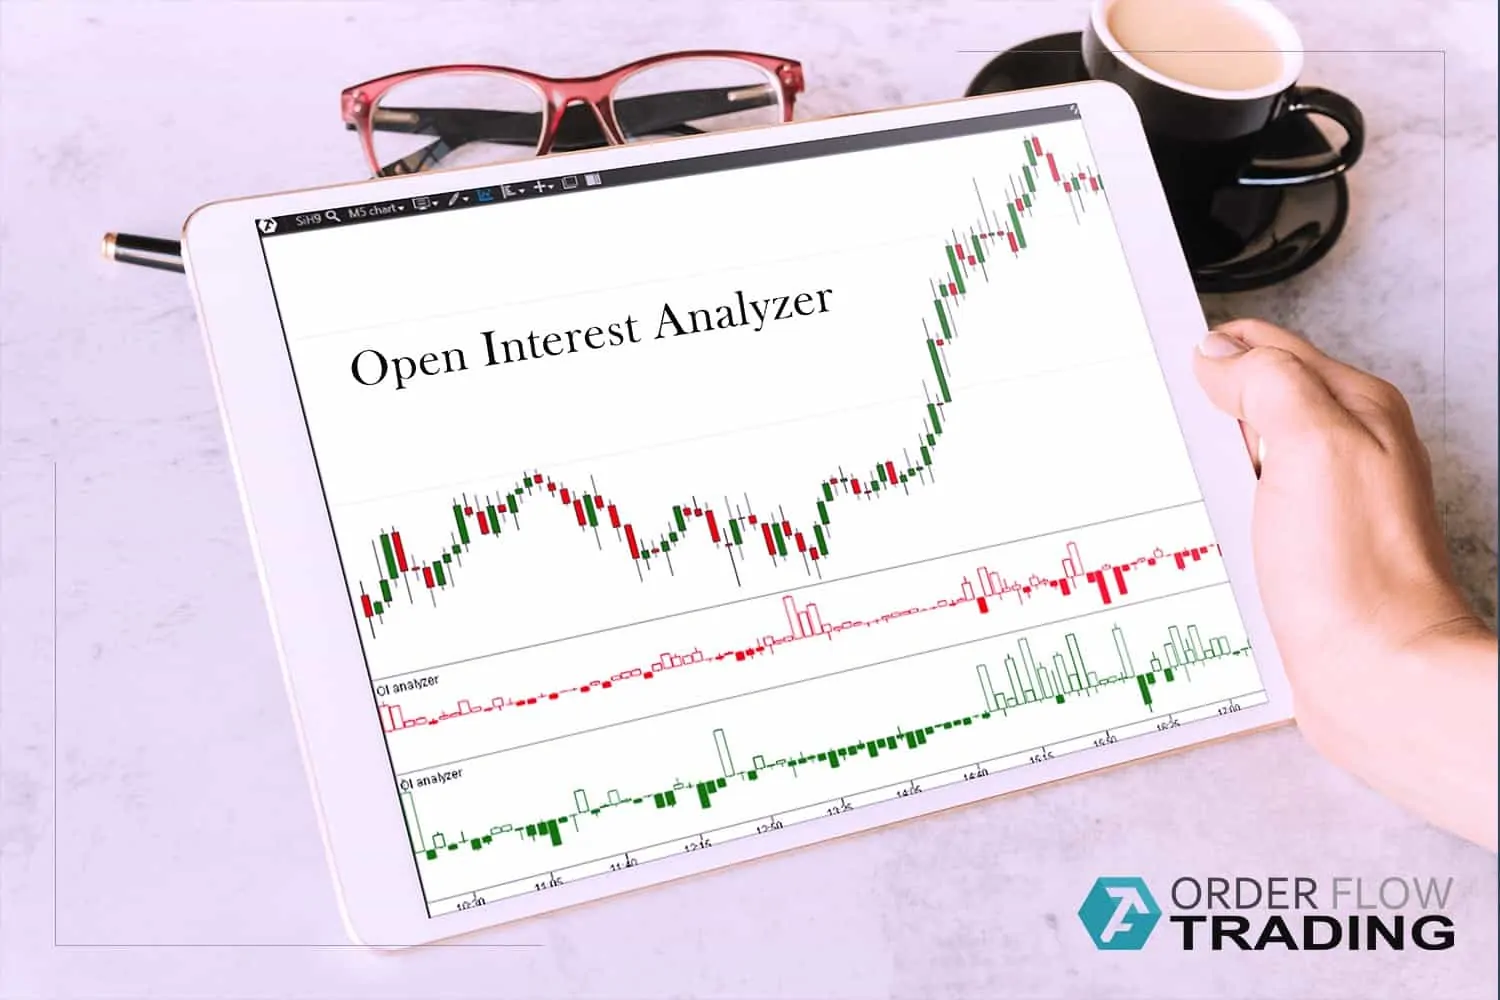
The goal of this article is to consider such a statistical parameter of the Moscow Exchange for assessment of the forward market instruments as Open Interest and also to learn how to build own trading patterns on the basis of real-life facts with the help of the OI Analyzer Indicator.
Read Today:
- Open Interest concept;
- Principle of formation of the Open Interest on the exchange;
- Comparison of the Open Interest and OI Analyzer Indicators;
- Points of interest in the 5-minute chart;
- Accumulation of long positions in the RangeUS chart;
- Combination of the Big Trades and OI Analyzer Indicators;
- Example of building a trading pattern.
Principle of formation of the Open Interest on the exchange
If a buyer opened his position with a view to the price growth on the expense of the seller’s offer, who opened his position with a view to the price reduction, this trade will result in emergence of mutual obligations and, as a consequence, to the Open Interest growth. The obligations within this trade are ensured by initial margins of each of the parties. If the price moves towards the buyer, the variation margin of the seller will reduce and the one of the buyer will grow.
Thus, the bigger the Open Interest i, the more mutually opened positions of buyers and sellers will be.
If both parties closed their previously opened positions, the value of the Open Interest will decrease.
However, such ideal situations when both parties simultaneously open or close their positions do not happen in the market all the time. The buyer might open his position against the seller’s offer, who, in his turn, closes his position. In a case like this the Open Interest value does not change.
In order to make it clear, let us make a list of possible variants of how the Open Interest (OI) value might change:
- The buyer and seller open their positions – OI goes up;
- The buyer and seller close their positions – OI goes down;
- The buyer opens his position and the seller closes his one – OI does not change;
- The buyer closes his position and the seller opens his one – OI does not change.
The Open Interest value always changes by a number multiple of 2. This is due to the fact that there are always two sides in the market and if Open Interest increases, it increases both with the buyer and seller. This rule is also true when the OI value decreases.
The Open Interest value is transmitted in the forward market of the Moscow Exchange in real time. You can get information about the current value in the ATAS platform using one of the following ways:
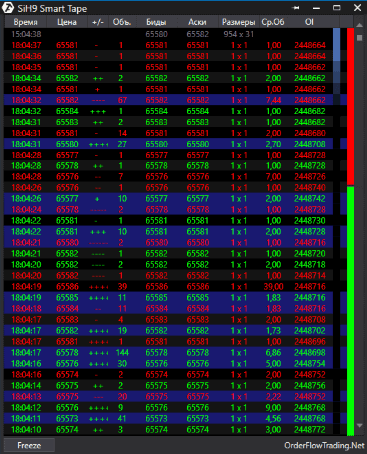
- from the Time and Sales Tape;
- add the Open Interest Indicator to the chart.
On the tape, the Open Interest is displayed in the form of a digital value for each trade:
If we add the Open Interest Indicator to the chart, there will be a bar chart in the bottom, where green bars show increase of the Open Interest and red bars – decrease:
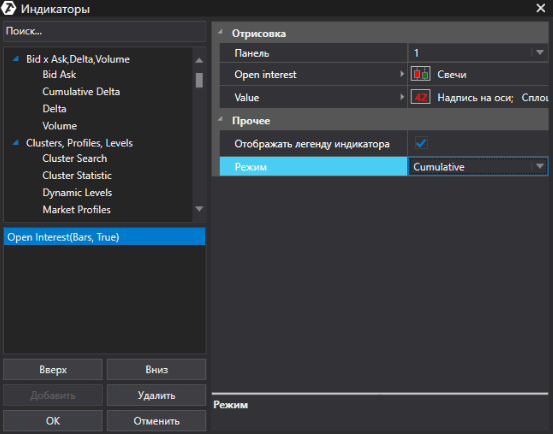
You can set the Cumulative mode in the indicator settings in order to see the cumulative value of the Open Interest during a day:
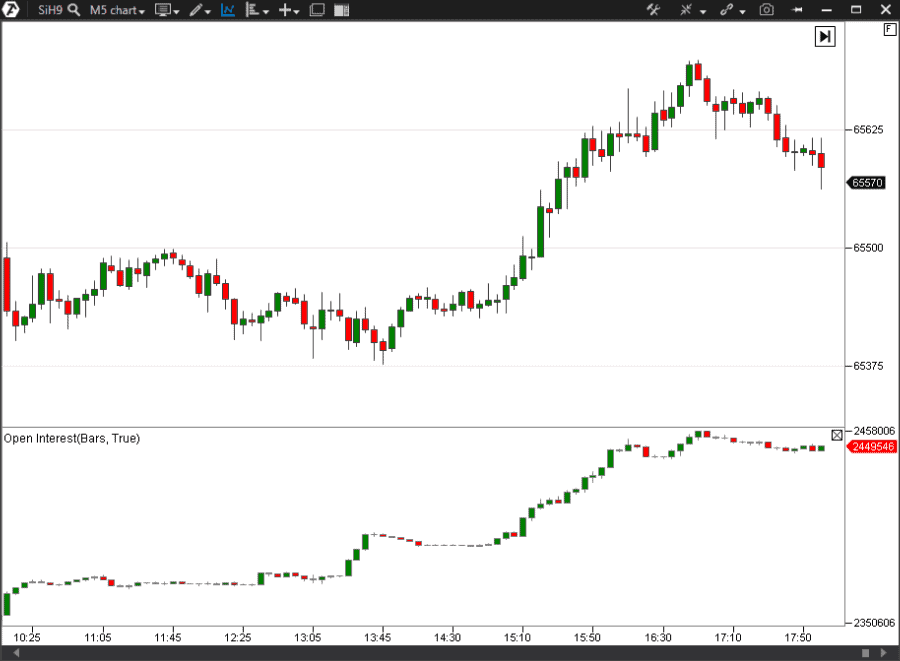
The indicator will look as in the picture below after the above setting:
The information about the Open Interest is very important, since it reflects expectations of the market participants. If the market participants actively accumulate their positions, the Open Interest will grow as in the picture above.
As we already found out, growth of the Open Interest means that both the seller and buyer open their positions, however, the market can move in one direction only. There could be situations, of course, when the price moves sideways for a long time, but, one way or another, exit from this side movement will be focused.
OI Analyzer Indicator
Well, how to analyze those market participants who were right and made profit separately from those who made losses, because they selected a wrong direction.
The OI Analyzer Indicator, which allows splitting participants into those who open and those who close their positions, will help us to do it.
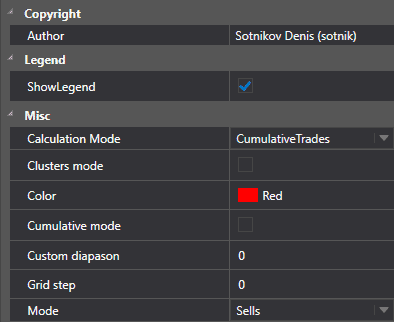
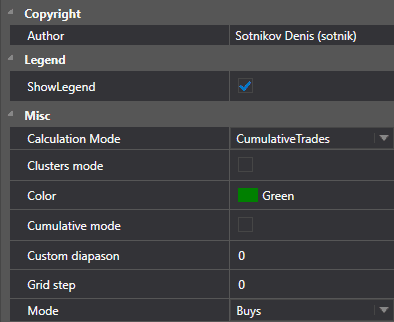
First, we need to add two OI Analyzer Indicators to the chart. You need to adjust settings for each of them as it is shown in the pictures below:
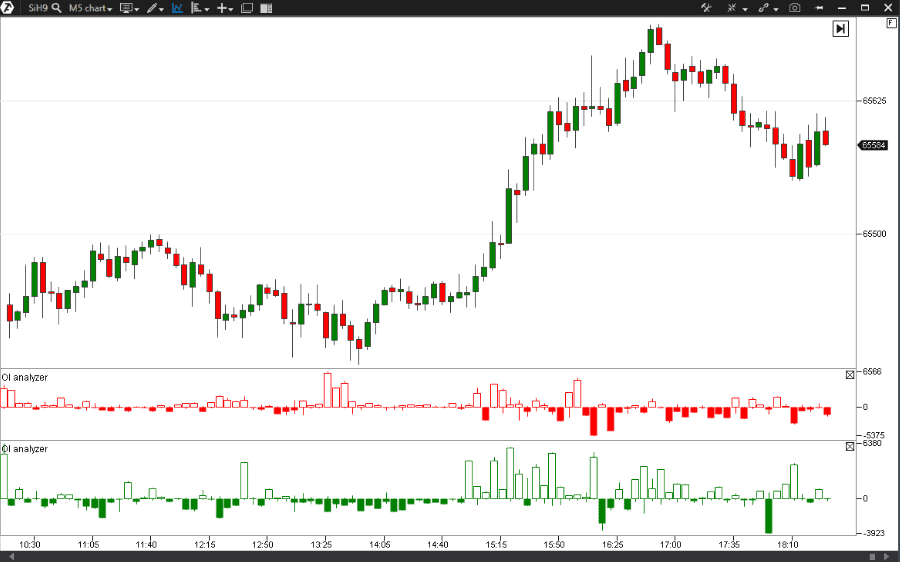
One of the indicators will be responsible for sells, the other – for buys. The chart should look as follows now:
Now we divided our market participants into sellers and buyers. This way we can see who initiated the trade, which resulted in the Open Interest change.
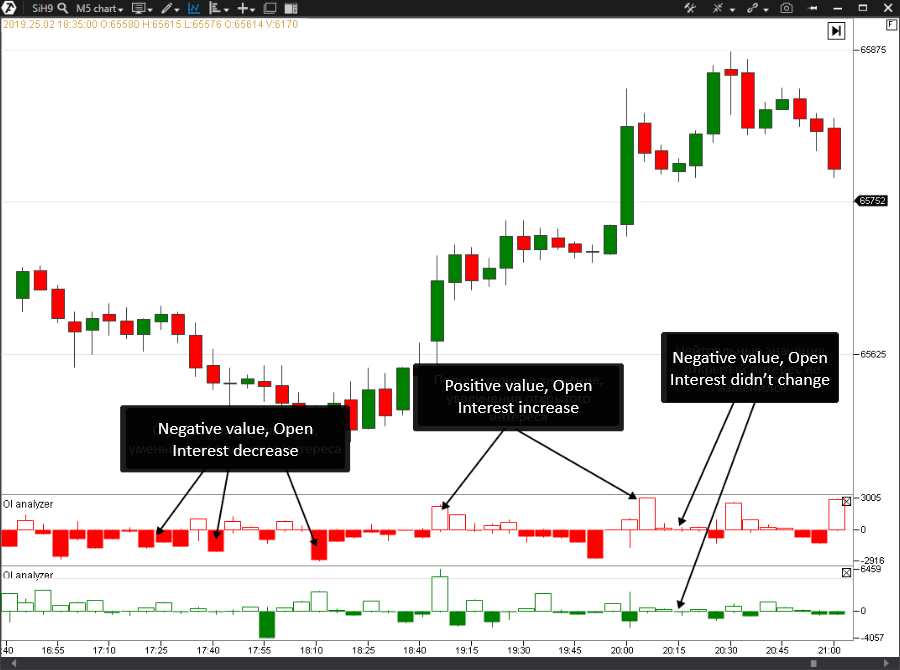
The indicator values could be the following:
- positive values (when Open Interest increased);
- negative values (when Open Interest decreased);
- neutral values (Open Interest didn’t change).
Points of interest in the chart
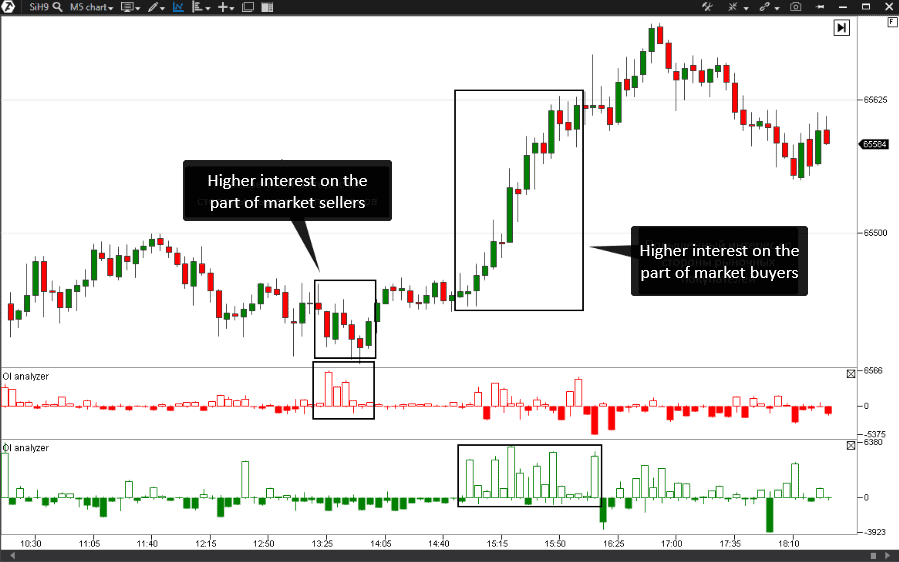
To make it clearer, we added areas with higher interest of the participants to the chart:
Note the area where sellers actively closed their positions. In fact, this area became a starting point for the price reversal. And the sellers’ positions made losses.
Further on, we marked the area of higher activity of buyers, who actively gained their positions on the asset growth, on the upward section.
Thus, we can see points of interest of both buyers and sellers in the chart. This information helps us to understand who suffers “the max payne” with respect to their loss-making positions.
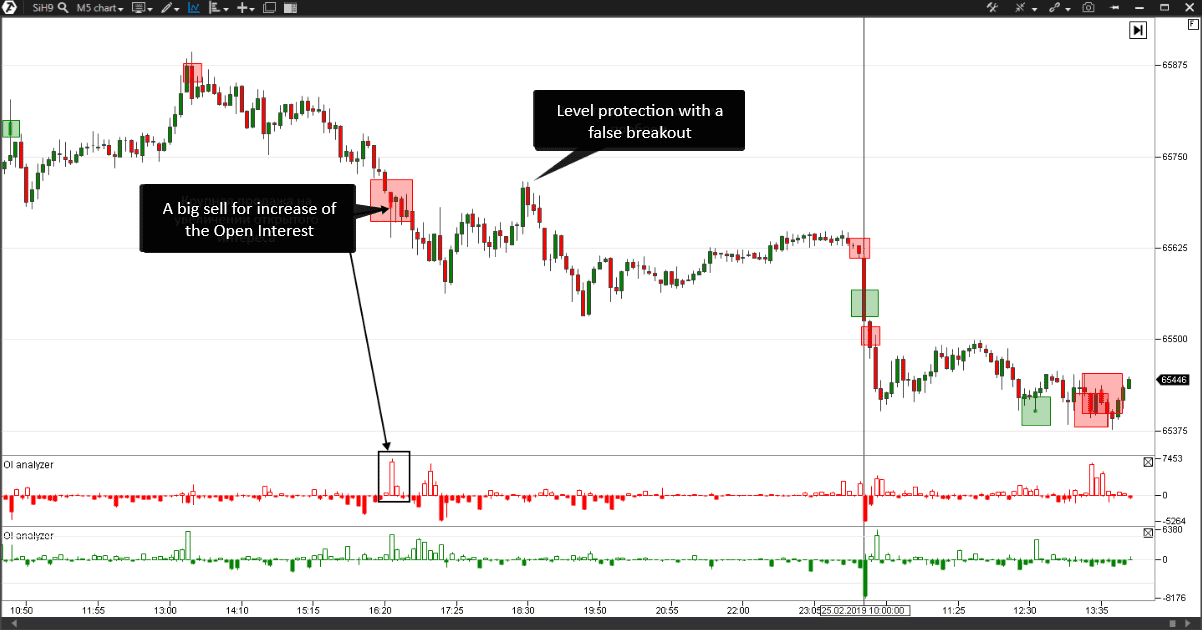
The next example shows how a big seller didn’t retreat, held his level and the price continued its downward movement:
This information clearly shows us who controls the market, the buyer or seller, and against whom the game is played at the current moment. The game rules become more transparent when you understand what is behind the chart. And it becomes much easier to win.
Accumulation of major positions in the RangeUS chart
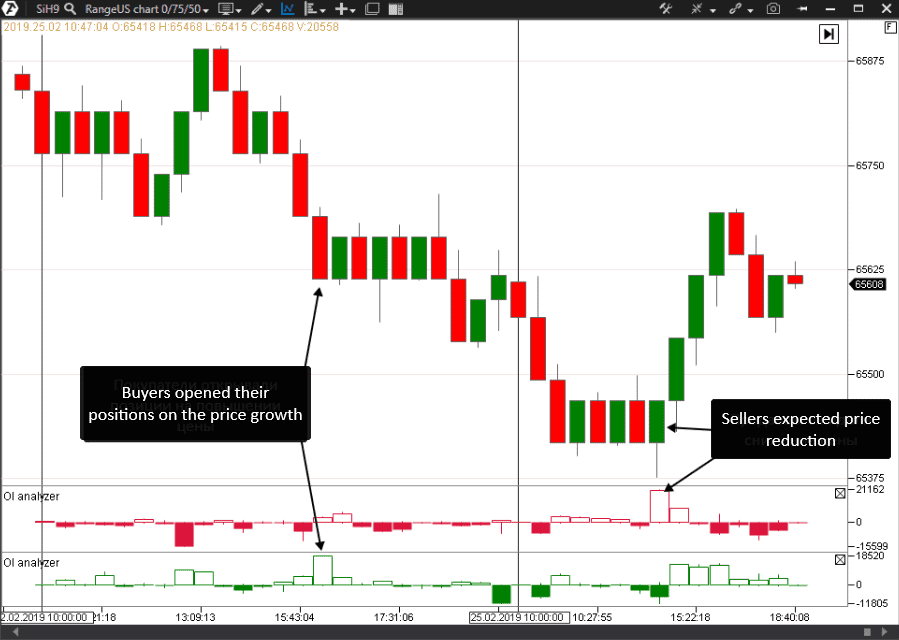
When you apply the OI Analyzer Indicator, you can not only see the game of the market participants, but also detect areas of focused accumulations of the market participants. For this purpose, you need either to use a bigger timeframe or set the chart in the RangeUS format. Such a chart doesn’t take into account the time interval, it unites multiple chaotic price movements into clear fragments.
This approach provides an easy way to detect major accumulations.
If you monitor it for a certain time, you will be able to notice major accumulations in those areas where the price is traded in a range for a long time. Unfortunately, the OI Analyzer Indicator cannot reflect the history, but shows values only for the current trading session, that is why we recommend you to mark important areas using drawing tools.
Combination of Big Trades and OI Analyzer Indicators
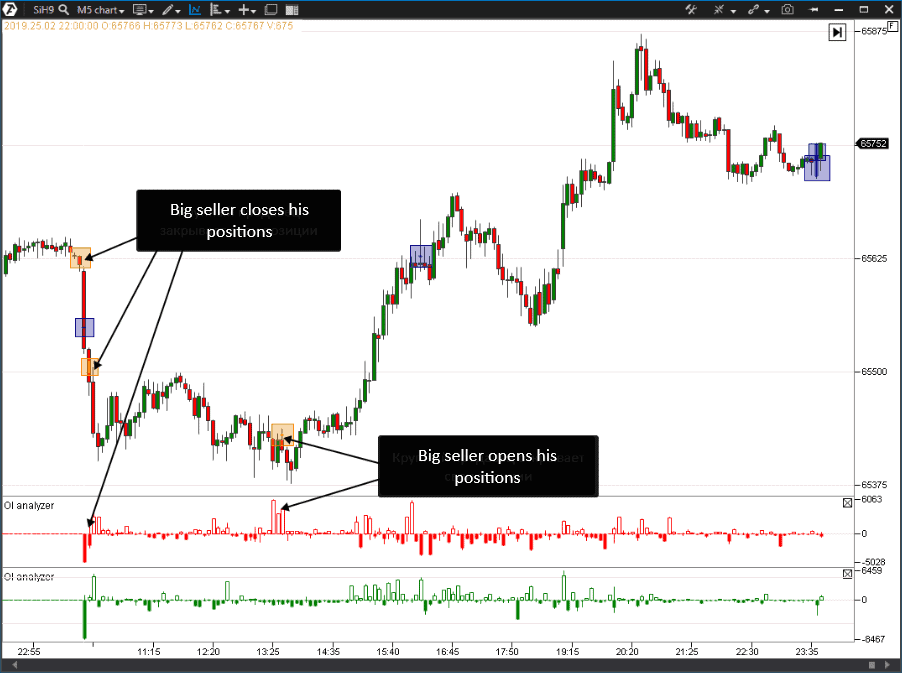
Using a combination of Big Trades and OI Analyzer Indicators allows detecting areas of presence of a big participant and identifying nature of his actions.
The picture below shows an example of such a combination:
You should note for yourself the value of the OI Analyzer Indicator in case of major buys or sells.
For example, if we see a major sell trade and the OI Analyzer Indicator, set for the search for sellers, took a negative value close to the size of the major trade, we have grounds to make a conclusion that the seller closed his market positions.
If we see a major sell trade and the OI Analyzer value increased, we have grounds to decide that the seller opens his position.
It is important to remember that if the OI Analyzer value increases, not only a market player opens his position but his limit opponent does it too.
Let us see now – how we can use all the above in our trading.
A practical example of trading pattern building
One of the most important issues, when deciding about a direction of your position, is to identify “who calls the tune” in the market. Study the chart and find areas of price consolidation and try to determine what influenced exit from consolidation in one direction or the other.
The market often enters into consolidation in order to determine the further movement direction. You should look for the major player specifically in consolidations.
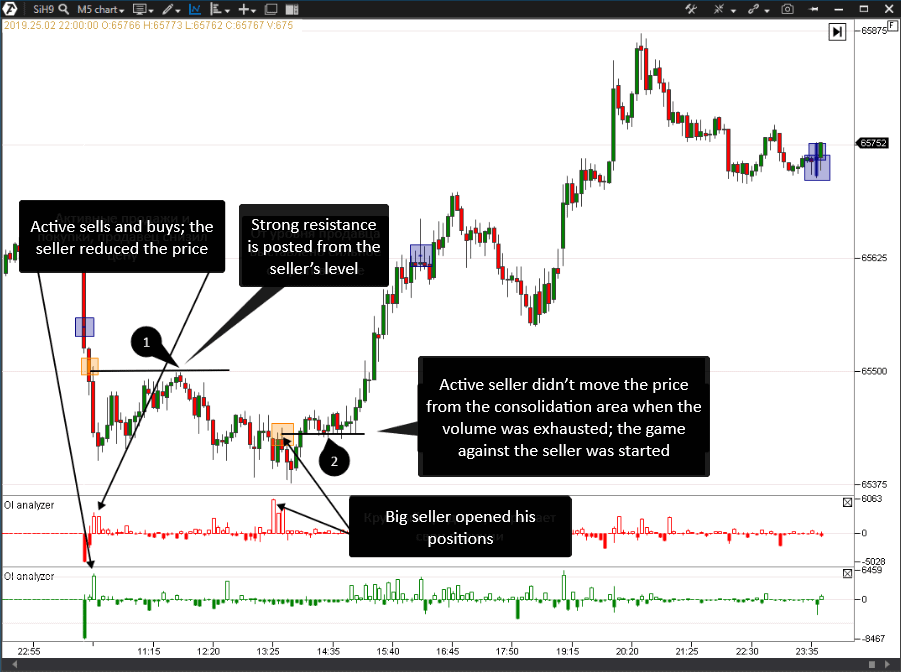
Let us consider an example of how a combination of the Big Trades and OI Analyzer Indicators helps to decide in what direction to exit from the consolidation.
The active seller’s level is tested in point 1. Such a situation envisages a possibility to open short position, because:
- the active seller opened his positions;
- the price didn’t enter into consolidation;
- the active buyer, who also opened his positions but the price moved against him, was at this level.
A combination of these factors allows building a trading plan for going short from the seller’s level during its testing. The stop, in this case, should be posted behind the seller’s level and the take should be put at the level of renewal of closest lows.
We observe beginning of a game against the seller in point 2. In this situation it is expedient to open long positions and take-profit should be posted on renewals of the closest highs of the price.
Note the following in such situations:
- the active seller opened his positions;
- the price didn’t exit the consolidation;
- the seller failed to hold his level;
- testing of the seller’s level, which was broken from above; the level turned into its mirror reflection.
Summary
Value of the Open Interest lies in the fact that it works with the data of another type. While the majority of known indicators are based on the price or volume, the Open Interest data provide a picture of dynamics of the number of the forward market positions. OI Analyzer is a unique instrument, which adds more value, since it allows splitting position opening and closing activity into the buyers’ and sellers’ actions.
We used application of the OI Analyzer Indicator data on futures of the USD/RUB pair. Perhaps, you will move further and find application of the described techniques in other markets and with other periods. Try to monitor accumulation of players during price consolidations and pay attention to directions of exits from consolidation after major accumulations.

