
Footprint strategy on wti oil example

Today we continue a series of articles about the strategies of use of the Footprint chart through the examples of various financial instruments. This time we will consider the Footprint chart of crude oil, which is the most important financial instrument of the modern futures market.
In this article:
- Review of the crude oil futures market;
- Main principles;
- Examples of Light Sweet Crude (WTI).
REVIEW OF THE CRUDE OIL FUTURES MARKET
Electronic trading of crude oil (and energy products in general) became very popular from the moment of launching electronic trades. Many ATAS platform and Footprint chart users discovered the key principles of trading in these markets since the energy product prices are stable and this situation, most probably, would stay for a long time.
Sometimes there is a confusion regarding what type of a crude oil contract is discussed in one or another publication. All the market situations, discussed in this article, will be considered through the example of a CME WTI futures (ticker: CL). It is traded with a minimum price increment of USD 0.01 per barrel. There is also an oil mini-contract, which is popular among many traders. The price increment of this trading instrument is USD 0.025 per 1 barrel.
Energy markets fit well for trading with the use of the Footprint due to high volatility and ‘sweeping’ price swings. The Footprint (cluster chart) ensures key understanding of the market dynamics and delivers it through price and shape. It provides accurate and easy-to-understand information about demand and supply, which allows traders to make well-considered trading decisions.
MAIN PRINCIPLES
Monitoring of tendencies for detecting signs of the market weakness or strength traditionally assumed the use of a vertical bar chart of volume in the lower part of the chart together with several indicators of the market overselling/overbuying. The Footprint chart offers traders a more accurate and reasonable way of market analysis. The cluster chart helps you to monitor the volume distribution by prices step by step and also to understand how this volume came to the market.
We do not propose you to monitor each trade executed in the market. Let Footprint do for you the work on systematization of the general flow of exchange data. It will give you a better understanding of the basic principles lying at the root of the developments. The demand and supply dynamics will be developing in front of your eyes. It will increase sensitivity of perception of the market information, which, in its turn, will give you confidence when you make trading decisions.
EXAMPLES OF LIGHT SWEET CRUDE (WTI)
Chart 1 shows a very good example of a crude oil futures fall by 66 cents with a further bounce from the lows at the level of USD 32.10. Note how the price tested the level twice before the sellers realized the demand strength. There was a big volume of sells at the level of USD 32.10 but the sellers failed to move the price lower.
An important fact in this situation is that the market has already fallen by that moment by 66 cents. The first attempt to push the price lower failed, since it was late and the price, at least, had to be consolidated for a potential continuation of the descending movement. At the second attempt, after consolidation, the price managed to outdo the level of USD 32.10 and go lower.
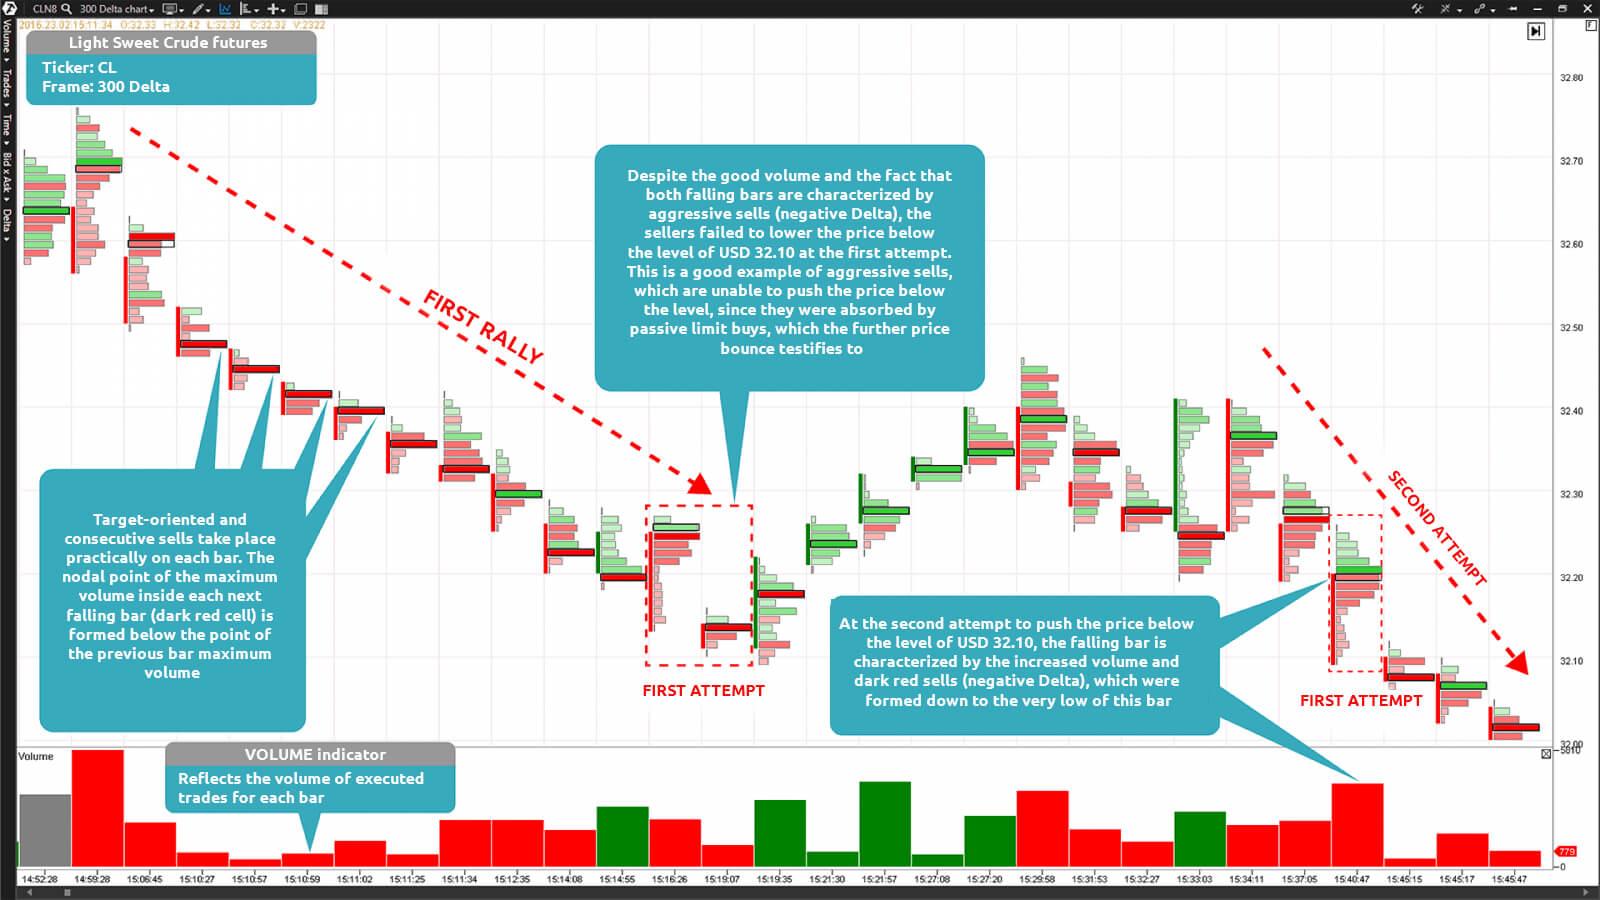
Chart 1. Footprint of a Light Sweet Crude futures built by the Delta with the value of 300 contracts
Chart 2 shows an excellent example, which demonstrates the process of formation of the market demand and supply. Since a new bar will emerge only when the Delta reaches the value of 300, the only factor of formation of new bars would be the volume preponderance in favour of one of the market sides.
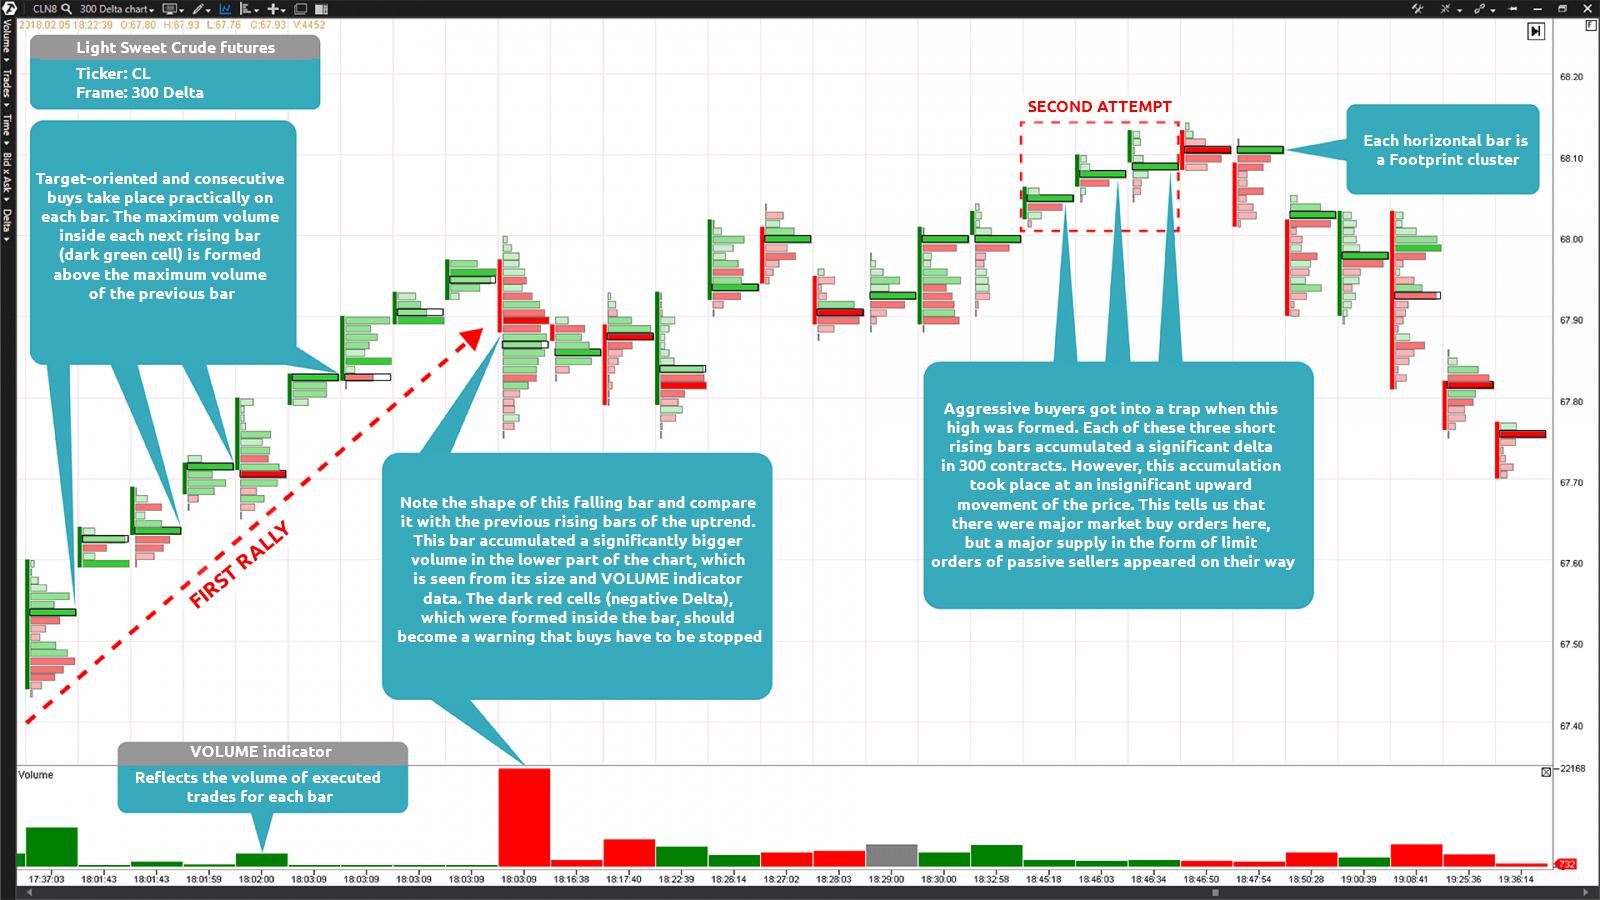
Chart 2. Footprint of a Light Sweet Crude futures built by the Delta with the value of 300 contracts
As soon as a disbalance of market forces takes place, the Footprint, built by the Delta, would provide you information whether it was aggressive supply (selling) or aggressive demand (buying). We can see in chart 2 that the first rally was rather fast and without a big supply. Nevertheless, a bar was formed at 18:03:09 before its completion and this bar turned out to be much wider than the previous ones because the supply started to dominate over the demand. As a result, the bar was closed with a negative Delta.
The second attempt of the futures to trade higher at 18:45:18, 18:46:03 and 18:46:34 was accompanied with the blocks of aggressive buys (dark green cells), which covered only a few prices in the chart. Although aggressive buys arrest attention due to respective colouring of the cells, when you first look at this market situation, the main fact, in reality, is the availability of significant supply, since the whole demand was absorbed within a very narrow price range.
Here comes the most interesting thing. If a break starts to fail and we identified major buyers at highs, it may provide additional ‘fuel’ for the descending movement.
Check out our new publications about the strategies of use of the Footprint charts of the trading and analytical ATAS platform. Best of luck, friends!

